Open Access
Fig. 4
Download original image
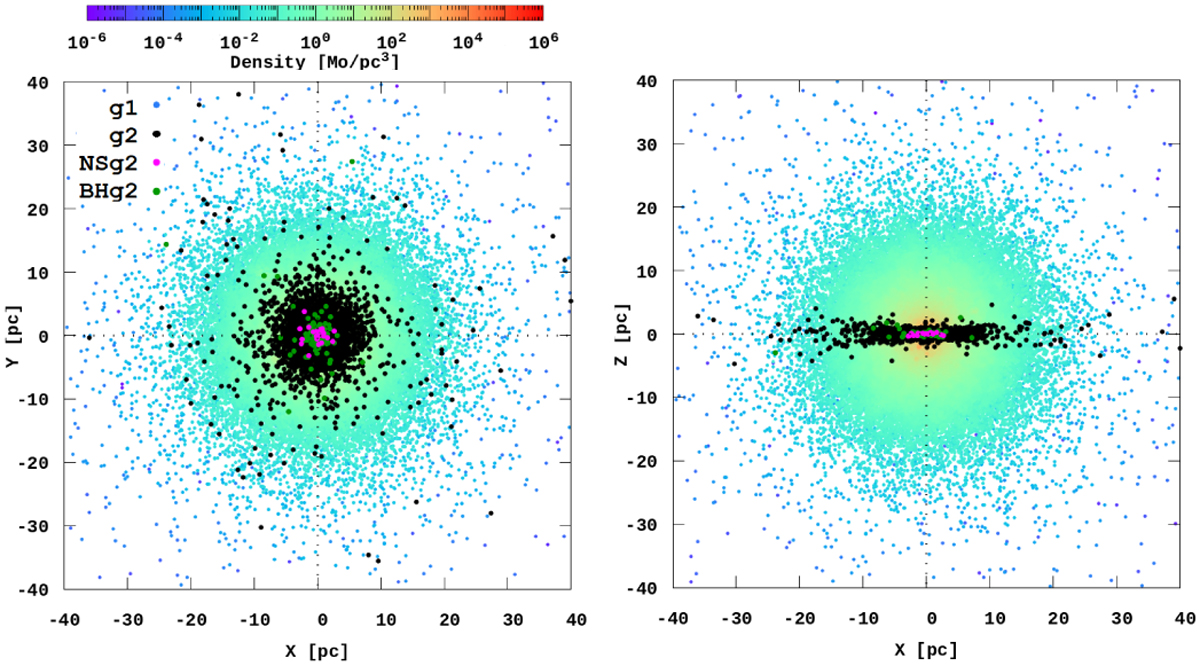
GC density distribution at −6.0 Gyr lookback time for the ISO model. The dark green and magenta dots show the BHs and NSs, respectively. The black dots represent the initial positions of the second- generation stars ɡ2.
Current usage metrics show cumulative count of Article Views (full-text article views including HTML views, PDF and ePub downloads, according to the available data) and Abstracts Views on Vision4Press platform.
Data correspond to usage on the plateform after 2015. The current usage metrics is available 48-96 hours after online publication and is updated daily on week days.
Initial download of the metrics may take a while.