| Issue |
A&A
Volume 678, October 2023
|
|
|---|---|---|
| Article Number | A69 | |
| Number of page(s) | 10 | |
| Section | Galactic structure, stellar clusters and populations | |
| DOI | https://doi.org/10.1051/0004-6361/202346553 | |
| Published online | 05 October 2023 | |
Milky Way globular clusters on cosmological timescales
III. Interaction rates
1
Main Astronomical Observatory, National Academy of Sciences of Ukraine, 27 Akademika Zabolotnoho St, 03143 Kyiv, Ukraine
e-mail: This email address is being protected from spambots. You need JavaScript enabled to view it.
2
Fesenkov Astrophysical Institute, Observatory 23, 050020 Almaty, Kazakhstan
3
Astronomisches Rechen-Institut, Zentrum für Astronomie, University of Heidelberg, Mönchhofstrasse 12-14, 69120 Heidelberg, Germany
4
Nicolaus Copernicus Astronomical Centre, Polish Academy of Sciences, ul. Bartycka 18, 00-716 Warsaw, Poland
5
Konkoly Observatory, Research Centre for Astronomy and Earth Sciences, Eötvös Loránd Research Network (ELKH), MTA Centre of Excellence, Konkoly Thege Miklós út 15-17, 1121 Budapest, Hungary
6
Al-Farabi Kazakh National University, 71 al-Farabi Ave., 050040 Almaty, Kazakhstan
7
Energetic Cosmos Laboratory, Nazarbayev University, 53 Kabanbay Batyr Ave., 010000 Astana, Kazakhstan
Received:
31
March
2023
Accepted:
7
August
2023
Abstract
Aims. We carry out the self-consistent dynamic evolution of the orbital structure of Milky Way globular clusters. This allows us to estimate possible and probable close passages and even collisions of the clusters with each other.
Methods. We reproduced the orbits of 147 globular clusters in 10 Gyr lookback time using our own high-order N-body parallel dynamic φ-GPU code. The initial conditions (three coordinates and three velocities for the present time) were derived from the Gaia DR3 catalogue. For each of the GCs, 1000 initial conditions were additionally generated, taking the Gaia measurement errors into account. The galaxy is represented by five external potentials from the IllustrisTNG-100, whose masses and sizes of the disk and halo components are similar to the physical values of the Milky Way at present.
Results. We present a statistical analysis of the cumulative close passages rate: About ten close passages with relative distances shorter than 50 pc for every billion years for each of the five external potentials. We present the 22 most reliable collision pairs with a good probability. As an example: Terzan 4 vs. Terzan 2 (49%), Terzan 4 vs. NGC 6624 (44%), Terzan 4 vs. Terzan 5 (40%), Terzan 4 vs. NGC 6440 (40%), and Terzan 4 vs. Liller 1 (42%). The most active globular cluster in the collision sense is Terzan 4, which has 5.65 collision events on average (averaged over all individual 1000 initial condition realisations). Most collisions are located inside the Galactic disk and form two ring-like structures. The first ring-like structure has the highest collision number density at ∼1 kpc, and the second sturcture has a maximum at ∼2 kpc.
Conclusions. Based on our numerical simulations, we can conclude that the few dozen Milky Way globular clusters probably undergo some close encounters and even possible collisions during their lifetimes, which can significantly affect their individual dynamical evolution and possibly even their stellar content.
Key words: globular clusters: general / globular clusters: individual: Terzan 4 / methods: numerical
© The Authors 2023
 Open Access article, published by EDP Sciences, under the terms of the Creative Commons Attribution License (https://creativecommons.org/licenses/by/4.0), which permits unrestricted use, distribution, and reproduction in any medium, provided the original work is properly cited.
This article is published in open access under the Subscribe to Open model. This email address is being protected from spambots. You need JavaScript enabled to view it. to support open access publication.
1. Introduction
According to the ΛCDM model, the Milky Way (MW) globular clusters (GCs) are one of the first bound stellar systems formed in the early Universe as gravitationally bound stellar systems (Weinberg 1993) with typical ages of about 10–12 Gyr (Marín-Franch et al. 2009; VandenBerg et al. 2013; Valcin et al. 2020) and current masses ≳105 M⊙ (Harris et al. 2013; Kharchenko et al. 2013; Baumgardt et al. 2019; Baumgardt & Vasiliev 2021. About 160 GCs are found in the MW today, whose parameters based on Gaia data (Gaia Collaboration 2021) are measured with a relatively good precision, including the full 6D phase-space information (Vasiliev & Baumgardt 2021; Baumgardt & Vasiliev 2021).
During the orbital analysis of GCs in our previous papers (Ishchenko et al. 2023b, hereafter Paper I; Ishchenko et al. 2023c), we observed that some GCs have a large number of orbital revelations over 10 Gyr, for example, NGC 6624 has ∼450 turns, and Terzan 4 has ∼620, and some of them are associated with the specific Galaxy regions (bulge or disk). Due to the long-term presence of these objects in same Galactic space volume (including even the Galactic center; Ishchenko et al. 2023c), close interactions of these objects with each other are expected. Based on these general considerations, the probability of a close meeting of our GCs cannot be neglected.
In our preliminary investigations based on Gaia DR2, we analysed the possible orbital crossing or collision of 150 GCs. Chemerynska et al. (2022) integrated the GC orbits up to 5 Gyr in the fixed MW-like gravitational potential, that is, in this case the masses, scale lengths, and scale heights of the MW external potential were not evolved. In these simple conditions, we found several GC collision pairs with a probability higher than 20%. Ishchenko et al. (2023a) integrated the GCs orbits up to 10 Gyr in an MW-like gravitational potential that changed in time, that is, the masses, scale lengths, and scale heights were evolved. The values of the measurement errors from Gaia DR2 for radial velocities and proper motions were also taken into account to obtain statistically more significant result. We also found several GC collision pairs that probably interact closely with each other.
A similar type of investigation was carried out by Khoperskov et al. (2018), who analysed the close passages of thick-disk GCs and presented the collision rate. de la Fuente Marcos et al. (2014) also analysed the possible influence of GC close passages on the formation and/or distraction of open clusters. The authors presented GC FSR 1767 (2MASS-GC04) as a candidate destroyer of the open cluster on a long timescale.
Although the MW GC subsystem is usually assumed to be collisionless, more recent studies showed that many of them have disk-like kinematics (Casetti-Dinescu et al. 2010; VandenBerg et al. 2013), which enables their close orbital passages and gravitational interactions with possible rotation angular momentum gain. These interactions may result in a mutual mass-exchange and in changes in orbital motions (Khoperskov et al. 2018). Another source of an orbital transformation of GCs is the mass growth of the Milky Way, whose stellar content increased by a factor of 10 in the last 10 Gyr (Bajkova et al. 2021; Garrow et al. 2020; Boldrini & Bovy 2022), where the increase in mass should squeeze the orbits of the GCs over time and might increase the probability of close passages or collisions of the GCs. Finally, massive satellites orbiting the MW can impact the gravitational field of the Galaxy and also affect the motion of a stellar system in the halo and the disk (Garrow et al. 2020; Boldrini & Bovy 2022). Finally, if the GCs were more massive at earlier epochs, their gravitational interaction might lead to the scattering of their orbits, which is especially important in the innermost parts of the MW disk or in the bulge region.
The paper is organised as follows. In Sect. 2 we introduce the initial conditions of GC data sampling with an overview of the MW-like potentials and integration procedure. In Sect. 3 we estimate the GC collision probability with different selection criteria. We also present the distribution of GC collisions by Morton ordering and in a 3D Cartesian galactocentric coordinate system. In Sect. 4 we present the results of our selected GC sample and summarise our findings.
2. Initial conditions and integration procedure
Before the orbital integration, we analysed the GC Gaia measurement errors from the catalogues of Vasiliev & Baumgardt (2021) and Baumgardt & Vasiliev (2021), which contain information about more than 160 objects. The catalogues contain the complete 6D phase-space information required for the initial conditions of our simulations: right ascension (RA), declination (Dec), heliocentric distane (D⊙), proper motion in right ascension (PMRA), proper motion in declination (PMDEC), and the radial velocity (RV). After the analysis of the error measurements for PMRA, PMDEC, RV, and D⊙, we excluded GCs with large uncertainties (relative errors more that 30%), see Baumgardt & Vasiliev (2021)1: Pal 1, AM 1, NGC 2419, Pal 3, Crater, AM 4, NGC 6380, NGC 6553, BH 261, NGC 6760, Lae 3, and Pal 13. We also excluded the GC Mercer 5 because no mass information for this GC is available in the catalogues above: During the dynamical simulation of the GCs, we used the clusters with the self-gravity together with the Galaxy external potential. Thus, we finally obtained a sample of NGC = 147 GCs for the future integration and analysis.
Although we excluded objects with large errors from further analysis, small errors in the measurements can lead to a change in the shape of the orbit if the orbital integration is performed over a long period of time. Thus, in order to obtain statistically significant results, we performed 1000 simulations in which we varied the initial velocities (PMRA, PMDEC, and RV) and heliocentric distance (D⊙) of the GCs using the normal distribution of the corresponding measurement errors (±σ) taken from the catalogue above. We carried out 5000 simulations: 1000 times five TNG-TVPs.
To perform a more realistic integration of our MW GC orbits, we used the publicly available data from the IllustrisTNG-100 cosmological magnetohydrodynamical simulations (Pillepich et al. 2018; Nelson et al. 2018, 2019; Springel et al. 2018; Marinacci et al. 2018; Naiman et al. 2018). From the simulated MW-like potentials in the IllustrisTNG-100, we selected five galaxies that reproduce the currently best Milky Way parameters (Mardini et al. 2020, Paper I). From the simulated IllustrisTNG-100 galaxies, we selected our five objects (411321, 441327, 451323, 462077 and 474170) that reproduce the MW basic parameters well at zero redshift (disk and halo masses with the spatial scales). In Fig. 1 we present the evolution of halo and disk masses as an example and their characteristic scales for external potential of 411321 selected from the IllustrisTNG-100 cosmological database. The evolution of another four TNG-100 time-variable potentials (TNG-TVP) are presented on the web-page2, and details about the selection procedure and fitting can be found in Paper I.
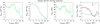 |
Fig. 1. Evolution of halo and disk masses, and their characteristic scales for 411321 TNG-TVP as a typical example. From left to right: halo mass Mh, disk mass Md, Navarro-Frenk-White halo scale parameter bh, and Miyamoto-Nagai disk-scale parameters ad and bd. The solid green lines with dots show the parameters recovered from the IllustrisTNG-100 data. The dotted and dash-dotted blue lines correspond to the values after the interpolation and smoothing with a 1 Myr time-step that was used in the orbital integration. |
For the GC orbital integration, we used the high-order parallel N-body code φ-GPU3, which is based on the fourth-order Hermite integration scheme with hierarchical individual block time-steps (Berczik et al. 2011, 2013). The external gravity was also added to the code (see more details in our previous publication, Sects. 2.2 and 2.3, Paper I).
The present-day positions and velocities of the 147 MW GCs were used as the initial conditions for the backward integration for 10 Gyr. The procedure of transformation from the DR3 reference frame to the Cartesian galactocentric rest-frame for GCs initial positions and velocities is also described in Chemerynska et al. (2022) and Paper I.
For the transformation of the positions and velocities into the Cartesian galactocentric rest-frame (see Johnson & Soderblom 1987 and Bovy 2011 for the coordinate transformation equations), except for the equatorial position of the North Galactic Pole (NGP), we used the updated values RA , Dec
, Dec , and
, and  (Karim & Mamajek 2017). We assumed a galactocentric distance of the Sun of R⊙ = 8.178 kpc (GRAVITY Collaboration 2019; Reid & Brunthaler 2004), a height above the Galactic plane of Z⊙ = 20.8 pc (Bennett & Bovy 2019), and a velocity of the local standard of rest (LSR) of VLSR = 234.737 km s−1 (Bovy et al. 2012; Drimmel & Poggio 2018). Accordingly, the Sun is located at X⊙ = −8178 pc, Y⊙ = 0 pc and Z⊙ = 20.8 pc in our Cartesian galactocentric coordinate system. For the peculiar velocity of the Sun, we used the following values with respect to the LSR: U⊙ = 11.1 km s−1, V⊙ = 12.24 km s−1, and W⊙ = 7.25 km s−1 (Schönrich et al. 2010).
The detection of the GC close passages can be sensitive to the integration time-step parameter η (Makino & Aarseth 1992). In the particular case of the fourth-order Hermite integration scheme, a time-step can be written as
 (1)
(1)
 (2)
(2)
where a(k) is the kth derivative of the ith particle acceleration. Thus, the time-steps are directly proportional to the η parameter, which is finally is responsible for the total integration accuracy itself. For the highest-order integration Hermite scheme, the generalised Aarseth criterion can be found in Nitadori & Makino (2008).
Using our initial conditions, we made additional calculations for 11 different η parameters: 0.01, 0.03, 0.04, 0.05, 0.001, 0.002, 0.003, 0.005, 0.007, 0.008, and 0.0001. For lower values of η, the integration time-step is proportionally smaller, which accordingly means more individual points on each GC orbit. For this set of runs, we used the same initial position and velocities for all additional 11 calculations in the selected 411321 external potential. The resulting global close passage rates are presented in the Fig. 2 (for details of the close passage, see Sect. 3.1).
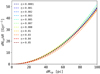 |
Fig. 2. Comparison of the GC global close passage rate in the same initial configuration, but with 11 different timestep parameters η in the 411321 TNG-TVP external potential. |
Figure 2 shows that the integration parameter accuracy value η affects the close passage rate very little. η = 0.01 limits the total relative energy drift (ΔEtot/Etot, t = 0) over a 10 Gyr backward integration to below ≈2.5 × 10⁻¹³. The typical integration time (on a desktop system AMD Ryzen Threadripper 3960X 24 core with ten parallel threads) for η = 0.01 takes approximately 21 min instead of 1080 min for η = 0.0001 for a single run. The wallclock time calculation for the main set of 1000 production runs in one of the external potentials with η = 0.01 takes more than 20 days of continuous calculations.
3. Globular clusters tracking a collision on a cosmological timescale
3.1. Globular cluster close passages rate
The first step is estimating the GC close passage rate. We adopted two main criteria to characterise the close passages between the GCs. At the same time, (i) the distance between a pair of GCs dR should be less than 100 pc, and (ii) the relative velocity between a pair of GCs dV should be less than 250 km s−1.
In Table 1 we present the total number of close passages (column two), averaged over all individual 1000 randomisations and for all our different TNG-TVP. We call these events multiple close passages (i.e. an event occurs a few times during one run between the same two GC1 and GC2). The total number of close passages is quite similar (approximately ±11%). The minimum number of close passages is obtained for 441327, and the maximum events are recorded for the 474170 potential. We also defined the average number of individual unique close passage pairs (without multiplicity) for each of our potentials: 411321 = 4.15, 441327 = 4.33, 451323 = 4.18, 462077 = 4.54, and 474170 = 3.97.
Total average number of close passages and collisions in five TNG-TVP potentials (averaged over all individual 1000 randomisations).
We marked the GC close passages with cp. Figure 3 shows the cumulative passage number rate as a function ofthe minimum relative distance dRcp of the GCs at the moment of closest approach. The resulting distribution as a function of dRcp can be well fitted by a simple power-law function,
 (3)
(3)
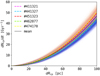 |
Fig. 3. Close passages rate of GCs as a function of the relative distance for the 1000 runs in each of the five TNG-TVP (thin solid coloured lines). The dashed lines are the power-law fit (see Eq. (3)) for each TNG-TVP. The solid black line is the mean fitting curve (see Table 2) for all GC orbital close passages. |
where the best-fit slope parameters a and b are compiled in Table 2.
Fitting parameters for the GC close passages rate as a function of the relative distance for five TNG-TVP potentials.
The rate of the close passages can be described by a simple quadratic relation dNcp/dt ∼ (dRcp)2, which likely is a direct consequence of the overlap of the simple cross-section expression for each GC. Table 2 shows that the a and b slope parameters of the simple power function (Eq. (3)) have quite small variances: a = 1.999 ± 0.112 and b = 0.005 ± 0.003, averaged for five TNG-TVPs. By analysing Fig. 3, for example, we can conclude that at a relative distance between the pairs of 50 pc, we can expect about 10 close GCs passages per 1 Gyr on average.
3.2. Deep passage rates of globular clusters
As the next step, we carried out the more detailed analysis of the GC close passages with each other. To do this, we applied the additional condition that the distance between the individual GCs should be less than four times the sums of their half-mass radii: dR < 4(Rhm, i + Rhm, j). We call these events collisions. To statistically verify the obtained results reliably, we re-analysed all possible pairs in all 1000 randomisations for five external TNG-TVPs. In Table 1 we present the total number of collisions (column tree) averaged over all individual 1000 randomisations for all of our different TNG-TVP. The total average numbers of the collisions are quite similar. The largest number of collisions was obtained for 474170, and the fewest were obtained for 441327 potentials. We also defined the number of individual unique collision pairs (without multiplicity) for each run: 411321 = 2.91; 441327 = 3.22; 451323 = 2.97; 462077 = 3.21 and 474170 = 3.01.
In Fig. 4 (left panel) we present the time distribution for all possible GC collisions, applying the three selection criteria for the full 10 Gyr time interval. Different colours represent each TNG-TVP for each 1000 randomized data sets. The number of total GC events does not depend on the GC global orbital evolution and remains approximately at the same level during the whole backward-integration time. In addition, we can also conclude that the GC collision events for different TNG-TVP potentials are not significantly different.
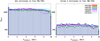 |
Fig. 4. Distribution of all possible GC collisions taking the selection criteria (ii) and (iii) during the whole 10 Gyr time interval into account (left panel). Same as in the left panel, but encounters only with the GC Terzan 4 (left panel). The time bin is 0.3 Gyr. |
After the analysis of all 5000 datafiles with the full GC collisions according to our three criteria, we present only pairs with mean probability values highert than 15% over the five TNG-TVPs. Thus, in Table 3 we present the sample of 22 GCs with these unique collision pairs from all five TNG-TVPs. For possible multiple collisions (e.g., five times in the same run between Terzan 4 and NGC 6624), we count these collisions as only one event. In this sense, we define the term “unique collision” event.
Probability of unique collisions between GCs in five TNG-TVP external potentials applying criteria (ii) and (iii).
Table 3 shows that statistically, the obtained collision probability is noticeable and can reach for individual pairs a mean level of ≈40% for all the five TNG-TVPs, even considering that we used the present-day half-mass radii of hte GCs. Taking into account that in the past, GCs had larger half-mass radii (Madrid et al. 2012, see Fig. 2), we can assume that GCs can have an even higher probability of collisions in the past. Table 3 shows that the most active GCs (with a noticeable collision probability) from our sample are Terzan 4, Terzan 2, NGC 6624, Liller 1, and NGC 6624. As an example, we present in Table 1 the total number of events with Terzan 4 in all five TNG external potentials. Figure 4 (right panel) shows the time distribution for the GC Terzan 4 collisions, applying our three criteria during the whole 10 Gyr interval, as for the most active GC. We also conclude that there is no significant difference between the GC collision events for different TNG-TVP potentials.
We additionally estimated the impact of the random sample sizes on the results obtained in Table 3. For this investigation, we randomly sampled the total 1000 random realisations for 200, 400, 600, 800, and 1000 in 411321 TNG-TVP potential. As expected, starting from 200 sample size, the collision results practically no longer depend on the sample size. This means that starting from a few hundred realisations, the collision numbers are saturated. As an example, we show the Terzan 4 vs. Terzan 2 collision probabilities: 59% (sample size 200), 49.75% (400), 62% (600), 58.13% (800), and 51.3% (1000). The Terzan 4 vs. NGC 6624 collision probabilities are 40.5% (sample size 200), 41.25% (400), 55% (600), 51.62% (800), and 55.6% (1000).
We estimated the number of unique close passages and collisions for each individual cluster listed in Table 3, using four different distance criteria: N100 pc, N4Rsum, N2Rsum and NRsum, see Fig. 5. We counted all the close encounters and collision events for the 19 selected GCs with all the other GCs, including all the pairs even with a low probability (lower then 15%). In this figure, we obtain different numbers for each of these criteria. As an illustration, we provide this additional analysis for the 411321 TNG-TVP external potential.
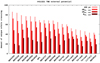 |
Fig. 5. Number of unique orbit crossings for selected clusters from Table 3 for four different distance criteria and for the selected 411321 TNG-TVP external potential. |
Figure 5 shows that the different criteria give us the different unique crossing (collision) numbers. They change proportionally, however, depending on the relative distance criteria. The highest value of a unique crossing number is reached for the full 100 pc distance criteria. The 4Rsum also gives us comparable numbers, however. The 2Rsum and Rsum = Rhm, i + Rhm, j criteria proportionally give us smaller numbers. The changes are smooth, which means that we properly resolved all the unique orbit crossings in our full dynamical MW GC system.
The actual collision percentage probability between GCs here are quite different from our earlier results based on the initial data of the Gaia DR2 catalogue. We can easily compare our current results with our previous work (Ishchenko et al. 2023a) because we previously used the same conditions of integration, external potentials, and scheme of collision analysis. For example, in Table 3 for the pair Terzan 4 vs. NGC 6440, we now obtain a mean value of 40%, and according to the DR2, we obtain 26%; for Terzan 4 vs. Terzan 5, we now obtain 40% in contrast to 18%; and for the Terzan 2 vs. Terzan 4 pair, we obtain 49% compared with GR2, 22%. More example comparisons can be found in Table 3 in Ishchenko et al. (2023a). Thus, the increase in the accuracy of the observed positions, and especially of the proper motions and velocities of the clusters, has increased the GC collision events by almost a factor of two. This significant increase in the collision event numbers is probably a pure chance effect.
In Appendix A we present the Terzan 4 orbital evolution with the collision points with other GCs in the 411321 TNG external potential, as presented in Table 3. Collision events for Terzan 4 with a statistical probability higher than 25% in this potential are shown by colour-coded circles.
3.3. Distribution of the globular cluster probability
Our third step was to perform a visual analysis of the statistical probability of the GC collisions in the current (at the present time) specific energy and specific angular momentum 3D phase space (E, Ltot, Lz) of the GCs. To sort the data (clustering), we used a 3D Morton space-filling curve (Lebesgue 1904; Morton 1966; Sagan 1994). Using these phase-space values after normalisation (i.e. fitting the specific energy and specific angular momentum ranges from 0 to 100), we sorted all our GCs into this constructed one-dimensional distribution (i.e. we obtained the Morton sorted order (number) GCMorton for each GC). In Fig. 6 we present the GC distribution in our 3D phase space, colour-coded by appropriate GCMorton sorted number for the potential 411321. We also show the GCs with black crosses (from Fig. 5) that show a close collisions. These GCs are well clustered in the middle of our Morton ordered list (around low values of E and Ltot). In Fig. 7 we present the analysis of statistical probability of collisions, based on the values of GCMorton sorted numbers GC1 and GC2 for all five TNG-TVP. We excluded the case of GC1 ≡ GC2 from the collision count. We show the statistical probability of GC collisions in percent according to the adopted criteria (ii) and (iii). The probability distribution in Fig. 7 shows that certain groups of GCs, sorted by physical parameters (energy, total angular momentum, and zth component of the angular momentum) form a fairly high percentage of the GCs collisions, more than 30%. Based on these plots, we can conclude that the collisions with the highest probability in all five potentials are are concentrated between the GCMorton sorted numbers 60–100. These collisions are almost all listed in our Table 3 and are also presented in the Fig. 5.
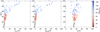 |
Fig. 6. Projections of the individual GCs positions from the 3D phase space of the normalised specific values of (E, Ltot, Lperp, and Lz) to (Ltot and E) plane in the left and center panel (Lperp, E), and in the (Lz, E) plane in the right panel. The data are represented for the 411321 TNG-TVP potential after sorting by the Morton space-filling curve, where the colour indicates the order of the GCs after the Morton analysis. The black crosses indicate the selected GCs from Fig. 5. |
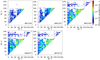 |
Fig. 7. Statistical probabilities of GC collisions with each other for five external TNG-TVP potentials after sorting by Morton space-filling curve. As input data for the Morton space sorting, we used the values of total specific energy E, total specific angular momentum L, and the zth component of the specific angular momentum Lz for each GC. The colour indicates the percent of the individual GC collision probability. The X- and Y-axes show the new GC indices obtained after the Morton space ordering. |
We also present the distribution of collision points in Fig. 8 in a 3D Cartesian galactocentric coordinate system. Each point represents the individual collision events (criteria (ii) and (iii)). The colours of the points represent the lookback time of these events.
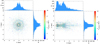 |
Fig. 8. Distribution of GC collision pairs for 411321 TNG-TVP external potential. The colour of the points represents the lookback time of these events. The histogram presents the projected number density of the all collision events (criteria (ii) and (iii)) independently of the lookback time. |
Most collisions are located inside the Galactic disk at a cylindrical distance shorter than ∼4 kpc. The distribution of the collision point distance from the Galactic plane is also well below ±2 kpc. The (X, Y) distribution shows that the collision points are located in a ring-like structure. The first ring-like structure has the highest collision number density at ∼1 kpc, and the second ring structure has a maximum at ∼2 kpc. These rings are most probably connected with the pericentre and apocentre values of our most active collisional GCs (e.g., Terzan 4, NGC 6624, and Terzan 2; see the webpage of the project4). Several dozen GC collision lie very close to the Galactic centre (see more details in our previous publication, Ishchenko et al. 2023c).
4. Conclusions
The evolution of our Galaxy GC subsystem is one of the most discussed topics of modern day astrophysics: they help us to understand the early Galaxy, the history of the Galaxy formation due to accretion events, the evolution itself, and and so on. Our study of the GC time-evolved orbital evolution is an attempt to proceed in this field of investigation. In this case, in the third part of the series of our papers, we presented the analysis of the statistical probability of GC close passages and even collisions with each other.
To perform our GC orbital integration in the realistic model of our Galaxy, we used the mass distribution data from the IllustrisTNG-100 cosmological modelling database. We selected five Milky Way-like time-variable external potentials that have the closest parameters to our Galaxy at the present time: 411321, 441327, 451323, 462077, and 474170. To estimate the probability of individual GC close orbital passages with each other during their evolution, we created a set of 1000 initial randomised conditions. We varied the three velocity components (on the base of the errors in the proper motions and radial velocity) to obtain the velocity in the Cartesian galactocentric rest-frame coordinate system for each individual GC. This approach yielded reliable results.
For the individual GC orbital integration, we used the high-order parallel dynamical N-body code φ-GPU, which is based on the fourth-order Hermite integration scheme with hierarchical individual block time steps. Each GC was integrated as a separate N-body particle with its own mass (taking the GC vs. GC gravitational interaction into account as well). The integration of all the 147 GC orbits was performed up to 10 Gyr lookback time.
As a definition of the close passages between the GCs, we adopted two criteria. At the same time, (i) the distance between the GCs dRcp should be smaller than 100 pc, and (ii) the relative velocity between these objects dVcp should be lower than 250 km s−1.
As a definition of the collision event between the GCs, we added one more criterion: At the same time condition (ii), the separation between the two GCs falls below four times the sums of their half-mass radii (iii). The main results of this study are listed below.
-
Applying criteria (i) and (ii), we can conclude that for example at the relative distance of 50 pc between GCs, we can expect about 10 close passages during every 1 Gyr for each of the five MW-like TNG-TVP external potentials on average. At a distance of 80 pc, we can expect already above 30 close passages for the same time interval. The cumulative close passage rate can be very well approximated by the simple quadratic power law, which clearly reflects the quadratic cross-section nature of the GC vs. GC possible close interactions.
-
We defined the average number of individual unique close passages pairs (without multiplicity) for each runs: 411321 = 4.15, 441327 = 4.33, 451323 = 4.18, 462077 = 4.54, and 474170 = 3.97.
-
Applying criterion (iii), we estimated the statistical probability of these events and found the unique collision (without multiplicity) number for each TNG-TVP: 411321 – 2.91, 441327 – 3.22, 451323 – 2.97, 462077 – 3.21, and 474170 – 3.01.
-
We estimated the statistical probability of these events and found the 22 most reliable collision pairs. The most noticeable probability pairs (in percent) were obtained for Terzan 4 vs. Terzan 2 (49%), Terzan 4 vs. NGC 6624 (44%), Terzan 4 vs. Terzan 5 (40%), Terzan 4 vs. NGC 6440 (40%), and Terzan 4 vs. Liller 1 (42%). In the sense of collisions, the most active GC in our sample is Terzan 4, which has 5.65 collision events for all five TNG-TVPs on average.
-
All our selected GCs that undergo a collision event belong to the thick disk of our MW (up to ∼1 kpc in z direction and ∼2 kpc in R), according to Bland-Hawthorn & Gerhard (2016).
-
In many cases, the collisions between GCs occur at separations that are significantly smaller than four sums of their half-mass radii, and sometimes even less. For example, we have 58 individual cross sections for a separation limit of 100 pc and 38 pc for GC Terzan 4 when we simply even sum their half-mass radii. Also as an example, the GC Terzan 2 has 39 individual cross sections for a separation limit of 100 pc and 30 pc when we simply sum their half-mass radii.
-
To visually present the statistical probability analysis of the GC collisions, we used a 3D Morton space-filling curve to sort the GCs based on their values of total energy E, total angular momentum Ltot, and the zth component of the angular momentum Lz. Based on our visual analysis (of the sorted GCs), we find separate groups of GCs with a fairly high percentage of GC collisions. The probability is higher than 30% over all random realisations.
-
We also presented the distribution of collision points in a 3D Cartesian galactocentric coordinate system. Most of the collisions are located inside the Galactic disk at a cylindrical distance smaller than ∼4 kpc. The distribution of the collision point distance from the Galactic plane is also well smaller than ±2 kpc. The collision points form two ring-like structures. The first ring-like structure has the highest collision number density at ∼1 kpc, and the second ring structure has a maximum at ∼2 kpc.
Based on our current simple calculations, we conclude that the GC vs. GC collisions in our Milky Way are relatively common events. In quite different TNG-TVP Milky Way-like external potentials, the frequency of the collision events is similar. The implication of our results would be interesting for the investigation of Galaxy global GC dynamical evolution on a cosmological timescale.
The error values for PMRA, PMDEC, RV, and D⊙ are taken from https://people.smp.uq.edu.au/HolgerBaumgardt/globular/orbits_table.txt
MW-like potentials are taken from https://bit.ly/3b0lafw
N-body code φ-GPU: https://github.com/berczik/phi-GPU-mole
Orbits for all 159 GCs in TNG-TVP potentials: https://sites.google.com/view/mw-type-sub-halos-from-illustr/GC-TNG
Acknowledgments
The authors thank the anonymous referee for his very constructive report and suggestions which helped to significantly improve the quality of the manuscript. The authors thank Sergey Khoperskov for valuable discussions during the entire period of work on the paper. MI, PB, CO, MK and DY acknowledge the support within the grant No. AP14869395 of the Science Committee of the Ministry of Science and Higher Education of Kazakhstan (“Triune model of Galactic center dynamical evolution on cosmological time scale”). The work of MI, MS, PB and OS was supported under the special program of the NRF of Ukraine “Leading and Young Scientists Research Support” – “Astrophysical Relativistic Galactic Objects (ARGO): life cycle of active nucleus”, No. 2020.02/0346. The work of MI was supported by the Grant of the National Academy of Sciences of Ukraine for young scientists. The work of PB was supported by the Volkswagen Foundation under the special stipend No. 9D154. MS acknowledges the support under the Fellowship of the President of Ukraine for young scientists 2022-2024. The work of PB, MI, MS and OS was supported under the special program “Long-term program of support of the Ukrainian research teams at the PAS Polish Academy of Sciences carried out in collaboration with the US National Academy of Sciences with the financial support of external partners”. This work has made use of data from the European Space Agency (ESA) mission Gaia (https://www.cosmos.esa.int/gaia), processed by the Gaia Data Processing and Analysis Consortium (DPAC, https://www.cosmos.esa.int/web/gaia/dpac/consortium). Funding for the DPAC has been provided by national institutions, in particular the institutions participating in the Gaia Multilateral Agreement.
References
- Bajkova, A. T., Smirnov, A. A., & Bobylev, V. V. 2021, Astron. Lett., 47, 454 [CrossRef] [Google Scholar]
- Baumgardt, H., & Vasiliev, E. 2021, MNRAS, 505, 5957 [NASA ADS] [CrossRef] [Google Scholar]
- Baumgardt, H., Hilker, M., Sollima, A., & Bellini, A. 2019, MNRAS, 482, 5138 [Google Scholar]
- Bennett, M., & Bovy, J. 2019, MNRAS, 482, 1417 [NASA ADS] [CrossRef] [Google Scholar]
- Berczik, P., Nitadori, K., Zhong, S., et al. 2011, in International Conference on High Performance Computing, HPC-UA 2011, 8 [Google Scholar]
- Berczik, P., Spurzem, R., & Wang, L. 2013, in Third International Conference on High Performance Computing, HPC-UA 2013, 52 [Google Scholar]
- Bland-Hawthorn, J., & Gerhard, O. 2016, ARA&A, 54, 529 [Google Scholar]
- Boldrini, P., & Bovy, J. 2022, MNRAS, 516, 4560 [NASA ADS] [CrossRef] [Google Scholar]
- Bovy, J. 2011, Ph.D. Thesis, New York University, USA [Google Scholar]
- Bovy, J., Allende Prieto, C., Beers, T. C., et al. 2012, ApJ, 759, 131 [NASA ADS] [CrossRef] [Google Scholar]
- Casetti-Dinescu, D. I., Girard, T. M., Korchagin, V. I., van Altena, W. F., & López, C. E. 2010, AJ, 140, 1282 [NASA ADS] [CrossRef] [Google Scholar]
- Chemerynska, I. V., Ishchenko, M. V., Sobolenko, M. O., Khoperskov, S. A., & Berczik, P. P. 2022, Adv. Astron. Space Phys., 12, 18 [CrossRef] [Google Scholar]
- de la Fuente Marcos, R., de la Fuente Marcos, C., & Reilly, D. 2014, Ap&SS, 349, 379 [NASA ADS] [CrossRef] [Google Scholar]
- Drimmel, R., & Poggio, E. 2018, Res. Notes Am. Astron. Soc., 2, 210 [Google Scholar]
- Gaia Collaboration (Brown, A. G. A., et al.) 2021, A&A, 650, C3 [EDP Sciences] [Google Scholar]
- Garrow, T., Webb, J. J., & Bovy, J. 2020, MNRAS, 499, 804 [NASA ADS] [CrossRef] [Google Scholar]
- GRAVITY Collaboration (Abuter, R., et al.) 2019, A&A, 625, L10 [NASA ADS] [CrossRef] [EDP Sciences] [Google Scholar]
- Harris, W. E., Harris, G. L. H., & Alessi, M. 2013, ApJ, 772, 82 [Google Scholar]
- Ishchenko, M., Sobolenko, M., Berczik, P., et al. 2023a, A&A, 673, A152 (Paper I) [NASA ADS] [CrossRef] [EDP Sciences] [Google Scholar]
- Ishchenko, M., Sobolenko, M., Kuvatova, D., Panamarev, T., & Berczik, P. 2023b, A&A, 674, A70 (Paper II) [NASA ADS] [CrossRef] [EDP Sciences] [Google Scholar]
- Ishchenko, M., Sobolenko, M., & Berczik, P. 2023c, Kinematics Phys. Celestial Bodies, 39, 33 [NASA ADS] [CrossRef] [Google Scholar]
- Johnson, D. R. H., & Soderblom, D. R. 1987, AJ, 93, 864 [Google Scholar]
- Karim, T., & Mamajek, E. E. 2017, MNRAS, 465, 472 [NASA ADS] [CrossRef] [Google Scholar]
- Kharchenko, N. V., Piskunov, A. E., Schilbach, E., Röser, S., & Scholz, R. D. 2013, A&A, 558, A53 [NASA ADS] [CrossRef] [EDP Sciences] [Google Scholar]
- Khoperskov, S., Mastrobuono-Battisti, A., Di Matteo, P., & Haywood, M. 2018, A&A, 620, A154 [NASA ADS] [CrossRef] [EDP Sciences] [Google Scholar]
- Lebesgue, H. L. 1904, Leçons sur l’integration et la recherche des fonctions primitives (Paris, France: Gauthier-Villars) [Google Scholar]
- Madrid, J. P., Hurley, J. R., & Sippel, A. C. 2012, ApJ, 756, 167 [NASA ADS] [CrossRef] [Google Scholar]
- Makino, J., & Aarseth, S. J. 1992, PASJ, 44, 141 [NASA ADS] [Google Scholar]
- Mardini, M. K., Placco, V. M., Meiron, Y., et al. 2020, ApJ, 903, 88 [NASA ADS] [CrossRef] [Google Scholar]
- Marín-Franch, A., Aparicio, A., Piotto, G., et al. 2009, ApJ, 694, 1498 [Google Scholar]
- Marinacci, F., Vogelsberger, M., Pakmor, R., et al. 2018, MNRAS, 480, 5113 [NASA ADS] [Google Scholar]
- Morton, G. M. 1966, A Computer Oriented Geodetic Data Base and a New Technique in File Sequencing (Ottawa, Ontario, Canada: IBM Ltd.) [Google Scholar]
- Naiman, J. P., Pillepich, A., Springel, V., et al. 2018, MNRAS, 477, 1206 [Google Scholar]
- Nelson, D., Pillepich, A., Springel, V., et al. 2018, MNRAS, 475, 624 [Google Scholar]
- Nelson, D., Springel, V., Pillepich, A., et al. 2019, Comput. Astrophys. Cosmol., 6, 2 [Google Scholar]
- Nitadori, K., & Makino, J. 2008, New Astron., 13, 498 [NASA ADS] [CrossRef] [Google Scholar]
- Pillepich, A., Springel, V., Nelson, D., et al. 2018, MNRAS, 473, 4077 [Google Scholar]
- Reid, M. J., & Brunthaler, A. 2004, ApJ, 616, 872 [Google Scholar]
- Sagan, H. 1994, Space-Filling Curves (New York, USA: Springer) [CrossRef] [Google Scholar]
- Schönrich, R., Binney, J., & Dehnen, W. 2010, MNRAS, 403, 1829 [NASA ADS] [CrossRef] [Google Scholar]
- Springel, V., Pakmor, R., Pillepich, A., et al. 2018, MNRAS, 475, 676 [Google Scholar]
- Valcin, D., Bernal, J. L., Jimenez, R., Verde, L., & Wandelt, B. D. 2020, JCAP, 2020, 002 [Google Scholar]
- VandenBerg, D. A., Brogaard, K., Leaman, R., & Casagrande, L. 2013, ApJ, 775, 134 [Google Scholar]
- Vasiliev, E., & Baumgardt, H. 2021, MNRAS, 505, 5978 [NASA ADS] [CrossRef] [Google Scholar]
- Weinberg, S. 1993, The First Three Minutes: a Modern View of the Origin of the Universe (New York, USA: Basic Books) [Google Scholar]
Appendix A: Orbital evolution of the globular cluster Terzan 4 with the collision moments.
As an example, we present the orbital evolution of the most active GC (in the collisional sense) Tezan 4 with its GC counterparts during the whole 10 Gyr time interval.
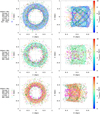 |
Fig. A.1. Pairs for Terzan 4 with a statistical probability higher than 25% in 411321 TNG-TVP. Green circles whos Terzan 2, red circles show NGC 6642, magenta circles show Terzan 5, orange circles show Liller 1, and cyan circles whos NGC 6528. Empty grey circles show the other GCs. The blue points are the start and end of the integration. From top to bottom, the panels represent the interval of integration: 0 – 3 Gyr, 3 – 6 Gyr, and 6 – 9 Gyr in lookback time. |
All Tables
Total average number of close passages and collisions in five TNG-TVP potentials (averaged over all individual 1000 randomisations).
Fitting parameters for the GC close passages rate as a function of the relative distance for five TNG-TVP potentials.
Probability of unique collisions between GCs in five TNG-TVP external potentials applying criteria (ii) and (iii).
All Figures
|
Fig. 1. Evolution of halo and disk masses, and their characteristic scales for 411321 TNG-TVP as a typical example. From left to right: halo mass Mh, disk mass Md, Navarro-Frenk-White halo scale parameter bh, and Miyamoto-Nagai disk-scale parameters ad and bd. The solid green lines with dots show the parameters recovered from the IllustrisTNG-100 data. The dotted and dash-dotted blue lines correspond to the values after the interpolation and smoothing with a 1 Myr time-step that was used in the orbital integration. |
| In the text | |
|
Fig. 2. Comparison of the GC global close passage rate in the same initial configuration, but with 11 different timestep parameters η in the 411321 TNG-TVP external potential. |
| In the text | |
|
Fig. 3. Close passages rate of GCs as a function of the relative distance for the 1000 runs in each of the five TNG-TVP (thin solid coloured lines). The dashed lines are the power-law fit (see Eq. (3)) for each TNG-TVP. The solid black line is the mean fitting curve (see Table 2) for all GC orbital close passages. |
| In the text | |
|
Fig. 4. Distribution of all possible GC collisions taking the selection criteria (ii) and (iii) during the whole 10 Gyr time interval into account (left panel). Same as in the left panel, but encounters only with the GC Terzan 4 (left panel). The time bin is 0.3 Gyr. |
| In the text | |
|
Fig. 5. Number of unique orbit crossings for selected clusters from Table 3 for four different distance criteria and for the selected 411321 TNG-TVP external potential. |
| In the text | |
|
Fig. 6. Projections of the individual GCs positions from the 3D phase space of the normalised specific values of (E, Ltot, Lperp, and Lz) to (Ltot and E) plane in the left and center panel (Lperp, E), and in the (Lz, E) plane in the right panel. The data are represented for the 411321 TNG-TVP potential after sorting by the Morton space-filling curve, where the colour indicates the order of the GCs after the Morton analysis. The black crosses indicate the selected GCs from Fig. 5. |
| In the text | |
|
Fig. 7. Statistical probabilities of GC collisions with each other for five external TNG-TVP potentials after sorting by Morton space-filling curve. As input data for the Morton space sorting, we used the values of total specific energy E, total specific angular momentum L, and the zth component of the specific angular momentum Lz for each GC. The colour indicates the percent of the individual GC collision probability. The X- and Y-axes show the new GC indices obtained after the Morton space ordering. |
| In the text | |
|
Fig. 8. Distribution of GC collision pairs for 411321 TNG-TVP external potential. The colour of the points represents the lookback time of these events. The histogram presents the projected number density of the all collision events (criteria (ii) and (iii)) independently of the lookback time. |
| In the text | |
|
Fig. A.1. Pairs for Terzan 4 with a statistical probability higher than 25% in 411321 TNG-TVP. Green circles whos Terzan 2, red circles show NGC 6642, magenta circles show Terzan 5, orange circles show Liller 1, and cyan circles whos NGC 6528. Empty grey circles show the other GCs. The blue points are the start and end of the integration. From top to bottom, the panels represent the interval of integration: 0 – 3 Gyr, 3 – 6 Gyr, and 6 – 9 Gyr in lookback time. |
| In the text | |
Current usage metrics show cumulative count of Article Views (full-text article views including HTML views, PDF and ePub downloads, according to the available data) and Abstracts Views on Vision4Press platform.
Data correspond to usage on the plateform after 2015. The current usage metrics is available 48-96 hours after online publication and is updated daily on week days.
Initial download of the metrics may take a while.