Open Access
Fig. 3.
Download original image
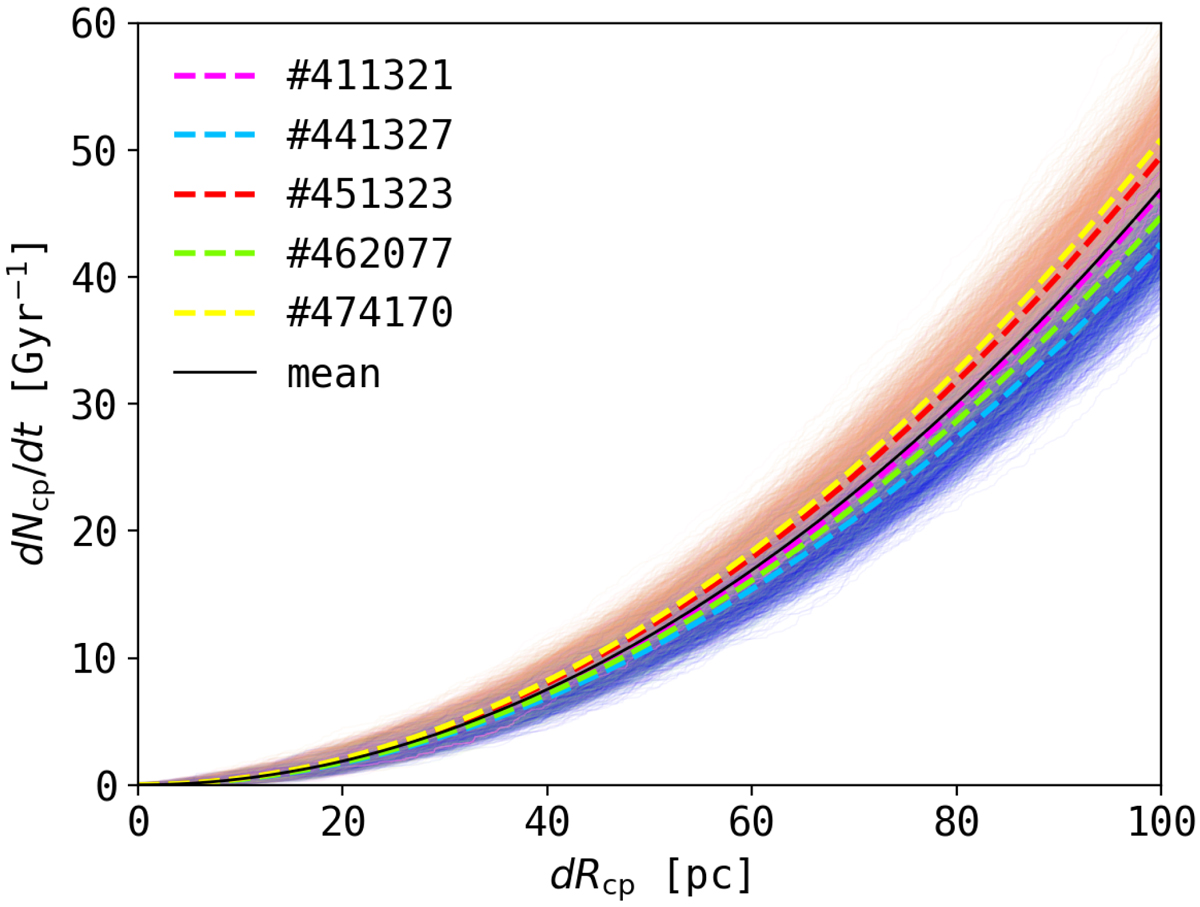
Close passages rate of GCs as a function of the relative distance for the 1000 runs in each of the five TNG-TVP (thin solid coloured lines). The dashed lines are the power-law fit (see Eq. (3)) for each TNG-TVP. The solid black line is the mean fitting curve (see Table 2) for all GC orbital close passages.
Current usage metrics show cumulative count of Article Views (full-text article views including HTML views, PDF and ePub downloads, according to the available data) and Abstracts Views on Vision4Press platform.
Data correspond to usage on the plateform after 2015. The current usage metrics is available 48-96 hours after online publication and is updated daily on week days.
Initial download of the metrics may take a while.