| Issue |
A&A
Volume 674, June 2023
|
|
|---|---|---|
| Article Number | A70 | |
| Number of page(s) | 24 | |
| Section | Galactic structure, stellar clusters and populations | |
| DOI | https://doi.org/10.1051/0004-6361/202245753 | |
| Published online | 02 June 2023 | |
Milky Way globular clusters on cosmological timescales
II. Interaction with the Galactic centre
1
Main Astronomical Observatory, National Academy of Sciences of Ukraine, 27 Akademika Zabolotnoho St, 03143 Kyiv, Ukraine
e-mail: marina@mao.kiev.ua
2
Fesenkov Astrophysical Institute, Observatory 23, 050020 Almaty, Kazakhstan
3
Rudolf Peierls Centre for Theoretical Physics, Parks Road, OX1 3PU Oxford, UK
4
Astronomisches Rechen-Institut, Zentrum für Astronomie, University of Heidelberg, Mönchhofstrasse 12-14, 69120 Heidelberg, Germany
5
Konkoly Observatory, Research Centre for Astronomy and Earth Sciences, Eötvös Loránd Research Network (ELKH), MTA Centre of Excellence, Konkoly Thege Miklós út 15-17, 1121 Budapest, Hungary
Received:
21
December
2022
Accepted:
1
April
2023
Aims. We estimate the dynamical evolution of the interaction of globular clusters’ with the Galactic centre that dynamically changed in the past.
Methods. We simulated the orbits of 147 globular clusters over a 10 Gyr lookback time using the parallel N-body code ‘φ-GPU’. For each globular cluster, we generated 1000 sets of initial data with random proper motions and radial velocities based on the observed values. To distinguish globular clusters interacting with the Galactic centre, we used the criterion of a relative distance of less than 100 pc. We used four external potentials from the IllustrisTNG-100 database, which were selected for their similarity to the present-day Milky Way, to simulate the structure of the Galaxy at different times.
Results. We obtained approximately three to four globular cluster interactions per billion years at distances of less than 50 pc and approximately five to six interactions per billion years at distances of less than 80 pc among the studied 147 globular clusters that had close passages near the Galactic centre. We selected ten of them for detailed study and found almost 100% probability of an interaction with the Galactic centre for six of them.
Conclusions. According to our results, the maximum interaction frequency of globular clusters with the Galactic centre in the Milky Way is likely to be a few dozens of passages per billion years within a central zone of 100 pc. This low frequency may not be sufficient to fully explain the relatively high mass (of order 107 M⊙) of the nuclear star cluster in the Milky Way if we consider only the periodic capture of stars from globular clusters during close encounters. Therefore, we must also consider the possibility that some early globular clusters were completely tidally disrupted during interactions with the forming nuclear star cluster and the Galactic centre.
Key words: globular clusters: general / Galaxy: center / methods: numerical
© The Authors 2023
 Open Access article, published by EDP Sciences, under the terms of the Creative Commons Attribution License (https://creativecommons.org/licenses/by/4.0), which permits unrestricted use, distribution, and reproduction in any medium, provided the original work is properly cited.
This article is published in open access under the Subscribe to Open model. Subscribe to A&A to support open access publication.
1. Introduction
According to the standard ΛCDM model, the Milky Way (MW) globular clusters (GCs) are the first bound stellar systems with a typical age of about 10−12 Gyr that formed in the early Universe (VandenBerg et al. 2013; Valcin et al. 2020). The GCs are quite common objects: at the beginning of 2020, 150 of them were discovered in the MW (Gaia Collaboration 2018), and by the beginning of 2022 about ten more GCs were discovered by Gaia Collaboration (2021) and there are more than ten new candidates for the GCs. In larger galaxies, there may be more of them: for example, in the Andromeda galaxy, their number can reach up to 500 (Barmby & Huchra 2001). Some giant elliptical galaxies, especially those at the centre of galaxy clusters such as M 87, may have up to 13 000 GCs (McLaughlin et al. 1994).
The GCs are a very useful tool in the study of the merging and interaction history of galaxies (Ashman & Zepf 1992). It is known that in our Galaxy, there are even swallowed-up stellar streams (Ibata et al. 2021) and satellite galaxies (McConnachie 2012; McConnachie et al. 2021) with their own GCs. Therefore, the study of the GCs’ kinematic characteristics together with their chemical properties helps in understanding the global evolution of the Galaxy itself.
Centres of most galaxies host a supermassive black hole (SMBH). Observations of the so-called S stars (Genzel et al. 2010; Gillessen et al. 2017) in the centre of our Galaxy have shown the presence of a central object with a mass of 4 million solar masses, which is direct evidence of the existence of the SMBH in the MW centre (Ghez et al. 2005). As a result of recent direct observations of the Galactic centre (GalC) with the Event Horizon Telescope, even the direct image of the MW’s SMBH was obtained (Event Horizon Telescope Collaboration 2022).
According to our preliminary research (Ishchenko et al. 2021, 2023a), we have found that the orbits of some MW GCs can pass close to the GalC. This idea is confirmed in the following papers: Burkert & Tremaine (2010), Harris & Harris (2011), González-Lópezlira et al. (2017), and Harris et al. (2014), where the authors show a correlation between the mass of the central SMBH and the number of GCs in elliptical and spiral galaxies.
In addition to the SMBH, there is a nuclear star cluster (NSC) in the centre of the Galaxy, which is a very dense star system (Neumayer et al. 2020). Observations show that for a large number of galaxies, the formation of the NSC could be the result the GCs in-spiralling (Lotz et al. 2004) towards the centre of the Galaxy due to dynamical friction and their merging into a compact dense star system. It is important to note that the masses of GCs must be large enough for this phenomenon to occur (Arca Sedda et al. 2019). We consider that the destroyed GCs contributed to the formation and growth of the NSC (for a review see Neumayer et al. 2020). The NSC can also grow by capturing stars from the GCs as they pass through the pericentre. Indeed, observations supported by numerical modelling suggest the presence of a distinct metal-poor population of stars in the NSC (Do et al. 2020) that may have originated from an infalling GC (Arca Sedda et al. 2020; Wang & Lin 2023). Moreover, the NSC and SMBHs may not have formed simultaneously at early times, as recent observations suggest a challenge to co-evolutionary models (Chen et al. 2023; Just et al. 2012). In this regard, it would be interesting to study such a possibility of the growth of the NSC. For example, one can analyse the GCs’ orbits passing near the centre of the Galaxy (Ishchenko et al. 2021, 2023b).
The first attempts to analyse, in detail, the MW GCs’ orbital evolution based on the Gaia Data Release 2 data were made by Baumgardt et al. (2019), Bajkova et al. (2020), and Bajkova & Bobylev (2021). The authors investigated the orbital evolution of the MW GCs’ subsystem by integrating back in time up to 5 Gyr. In continuation of these studies, we have already done a similar type of orbital integration in a fixed MW potential, analysing the GCs’ close passages in detail with each other and with the GalC (Ishchenko et al. 2021, 2023a).
In order to increase the realism of our simulations, that is the realism of the Galaxy structure evolution, in a current investigation we applied time-dependent Galactic gravitational potentials extracted from the IllustrisTNG-100 cosmological simulation database. Currently, the IllustrisTNG data are among the best publicly available databases for such an investigation (Pillepich et al. 2018; Nelson et al. 2018, 2019; Springel et al. 2018; Marinacci et al. 2018; Naiman et al. 2018). For example, the simulation’s cosmological box sizes and physical mass resolution are currently among the best. We adopted a multi-dimensional (mass and spatial) fit for the basic Galactic structures, such as the halo and disk (masses and sizes) for each TNG100 simulation snapshot (Mardini et al. 2020).
The main idea of this work is to carry out the dynamic evolution of the orbits of the GCs’ subsystem sample in lookback time up to 10 Gyr. This allows us to estimate, in the common statistical way, the average probability and the possibly of a close interaction of GCs’ with the GalC (that dynamically changed in the past).
The paper is organised as follows. In Sect. 2 we present the GCs’ initial data with the integration procedure in time-variable potentials (TVPs) including the influence of measurement uncertainties on the GCs’ orbits. In Sect. 3.1 we present the GCs’ interactions rate with the GalC and the statistical analysis of such events. In Sects. 4 and 5, we present the physical characteristics of the selected GCs and summarise our findings.
2. Method
2.1. GCs’ initial data
We have selected GCs from catalogues compiled based on Gaia Data Release 3 observations (Baumgardt & Vasiliev 2021; Vasiliev & Baumgardt 2021). The catalogues are up to date and contain information on more than 160 objects. In particular, the catalogues contain GCs’ masses and their 6D phase space coordinates which are used as initial conditions for our numerical simulations: three position coordinates (Baumgardt & Vasiliev 2021), proper motion in right ascension (PMRA), proper motion in declination (PMDEC), and radial velocity (RV; Vasiliev & Baumgardt 2021). To minimise the influence of observational uncertainties on numerical simulations, we excluded the GCs with relative errors in PMRA, PMDEC, and RV larger than 30%1. Several GCs’, twelve, do not satisfy our selection criteria and were therefore excluded from further modelling. During the dynamical simulation of the GCs, we used the clusters with self-gravity (for more details, see the next subsection) in conjunction with the Galaxy’s external potential. However, we excluded the GC Mercer 5 from our analysis due to the absence of mass information for this cluster in the above catalogues. Thus, we finally got the sample of the 147 GCs for the future integration and analysis.
2.2. Time-variable potentials and integration procedure
For the GCs’ orbital integration, we used a high-order parallel dynamical N-body code φ-GPU. This code is based on the fourth-order Hermite integration scheme with hierarchical individual block time steps (Berczik et al. 2011, 2013). Each GC was integrated as one physical particle with the fixed mass from the catalogue (Baumgardt & Vasiliev 2021). All 147 GCs which we investigate in this paper were integrated together taking into account the GCs’ self interactions and the interactions with the external potential.
As an integration time-step parameter (Makino & Aarseth 1992), we decided to use η = 0.01 as a good compromise between the speed of calculation and accuracy of integration. Using η = 0.01, we have obtained the total relative energy drift (ΔEtot/Etot, t = 0) over a 10 Gyr backward integration below ≈2.5 × 10⁻¹³. Typical integration time (on a desktop system AMD Ryzen Threadripper 3960X 24 core with ten parallel threads) takes approximately 21 min.
To be more physically motivated, we performed our integration of GCs’ evolution in time-varying MW-like potentials. We used the fitted data from the IllustrisTNG-100 cosmological modelling database (Nelson et al. 2019) for the external potentials.
IllustrisTNG-100 is characterised by a simulation box ∼100 Mpc3. In a box of such a size, each simulation can provide us with a sufficient number of MW-mass-sized disk galaxies with the mass resolution of 7.5 × 10⁶ M⊙ for dark matter and 1.4 × 10⁶ M⊙ for the baryonic particles, respectively. For our analysis, we identified the MW-like galaxy candidates from the Illustris simulations, with at least 105 dark matter particles and at least 103 baryonic particles (stars and gas) at redshift zero.
Based on IllustrisTNG-100 for each snapshot time, we constructed a five parameters’ fitting of particle distribution with the Navarro-Frenk-White (NFW) halo and Miyamoto-Nagai (MN) disk profiles. To obtain the spatial scales of the disks and dark matter haloes, we decomposed the mass distribution using the MN Φd(R, z) (Miyamoto & Nagai 1975) and NFW Φh(R, z) (Navarro et al. 1997) potentials:
where  is the planar Galactocentric radius, z is the distance above the plane of the disk, G is the gravitational constant, ad is the disk scale length, bd, h are the disk and halo scale heights, respectively, and Md and
  (ρ0 is the central mass density of the halo) are masses of the disk and halo, respectively.
For our investigation we used four of the pre-selected IllustrisTNG TVPs (TNG-TVPs) that have maximally similar parameters to our Galaxy at present: #411321, #441327, #451323, and #462077. For more details, readers can refer to Table 1 (Ishchenko et al. 2023a,b; Mardini et al. 2020), as well as the TNG-TVP potential online2.
Parameters of the time-varying potentials selected from the IllustrisTNG-100 simulation at redshift zero.
We also used a circular velocity value at the solar distance (≈8 kpc) in the model as an extra parameter to select the best TNG galaxies that represent the MW-type systems. This value indicates the position of the Sun at present. According to the age and chemical compositions of the stars in the solar neighbourhood, we know that over the past few billion years, there were no big changes in the radial motion of masses. This means that the circular velocity at the distance of the Sun in the Galactic disk should remain approximately constant during the last few billion years near V⊙ ≈ 235 km s−1 (Mardini et al. 2020).
The TNG-TVPs are obtained from large-scale cosmological simulations involving millions of galaxies3 (Nelson et al. 2019). The morphology of individual galaxies’ central region cannot be accurately resolved since these simulations are focussed on large-scale structure. Taking into account these numerical limitations of our external potentials, we specially added the extra SMBH into simulations. A SMBH was added as one special particle with a fixed position and mass equal to 4.1 × 10⁶ M⊙ (Ghez et al. 2008). The SMBH mass was fixed throughout the entire time of the integration. So, in total, we got four TNG-TVPs plus one modified potential #411321 (hereafter #411321-m).
Based on our earlier study of dynamical friction in the GalC (see Sect. 6.1, Just et al. 2011), we can conclude that in the case of MW GCs that are fast (250−500 km s−1) near central passages, these forces are not dominant. We can also mention that the average orbital distance of GCs from the GalC are well beyond few kiloparsecs, so the densities at these distances are significantly lower compared to the GalC near central densities (< 100 pc).
2.3. Influence of the measurement errors on GC orbits
For most of the selected GCs, the measurement uncertainties in velocities are of the order of several percent. To check the possible influence of these uncertainties on orbital integration, we performed ten test simulations. The positions were fixed and PMRA, PMDEC, and RA were varied within the range of the observational errors obtained from the Vasiliev & Baumgardt (2021) catalogue. Figure 1 illustrates the orbital evolution of two randomly selected clusters (Pal 6 and NGC 6981) with their orbits affected by the errors. The influence of the measurement errors’ radial velocity (eRV), proper motions in right ascension (ePMRA), and in declination (ePMDEC) leads to moderate variations in orbits. As can be seen, the orbits are qualitatively similar, and therefore we can conclude that the velocity errors do not significantly affect orbital properties of the selected GCs.
 |
Fig. 1. Orbital evolution of two selected clusters: Pal 6 and NGC 6981. On the plot we show only the first 3 Gyr evolution in #411321 TNG-TVP external potential. The colour-coded line presents the orbit based on catalogue initial positions and velocities. The grey colour represents the orbits for ten different random realisations of initial data. |
Thus, we selected the GCs from the Vasiliev & Baumgardt (2021) catalogues with relative errors in velocities of less than 30% and used the provided positions and velocities as the initial conditions for our N-body simulations. In order to obtain statistically significant results, we performed 1000 simulations varying initial velocities of the GCs within ±1σ of the measurement errors taken from the normal distribution.
So, in the end we carried out 5000 simulations: 4000 for the four TNG-TVPs and 1000 for the #411321-m potential. The wall-clock time calculation for the set of 1000 runs in one external potential takes more than 20 days of continuous calculations.
3. GCs’ interaction with the GalC
3.1. Global GCs’ interactions rate with the GalC
We adopted the following simple criterion to define the close passages of the GCs with the GalC, namely, if the minimum orbital distance between the GalC and the GC become less then 100 pc. We chose this value because it corresponds well with the outer influence radius of the SMBH and the outer size of the MW NSC. We simply define the actual distance between the GalC and GC as follows:  , and the minimum separation between the GC and GalC over the time (pericentre distance) as Dm.
This approach allows us to analyse all possible statistically significant close interactions between the GCs and GalC. The GCs’ interactions with the GalC during their orbital evolution were analysed for all 1000 sets of randomisations and for all the TNG-TVP external potentials.
We estimated the global interaction rate of GCs with the GalC (total number of close passages for all GCs per 1 Gyr) as a function of the minimum relative distance from the centre Dm (see Fig. 2). This relation can be fitted by a simple power-law function:
 |
Fig. 2. Interaction rate of the GCs with GalC as a function of the relative distance from the centre for the five TNG-TVP external potentials and 1000 random realisations (thin solid coloured lines). Thick dashed lines are a power-law fit in TNG potentials. The solid black line is a mean fitting line (see Table 2). The pale violet dotted line is a power-law fit for potential #411321-m for which the SMBH mass has been taken into account. |
where the best-fit slope parameters a and b for all the TNG-TVP external potentials are compiled in the Table 2.
Fitting parameters for the interaction rate GC with GalC as a function of the relative distance from the centre for four TNG-TVP external potentials.
From general physical assumptions (the probability is proportional to GalC volume), we can estimate the GCs’ average interaction rate with the GalC as a simple power relation dNGalC/dt ∼ (Dm)3. As we can see from Fig. 2 and from Table 2, the GCs’ interaction rate with the GalC that averaged out for the four TNG-TVPs’ (excluding the model with the central SMBH) a and b slope parameters of the simple power-law function (Eq. (2)) have a rather small variance:  and
and  . For example, analysing Fig. 2, we can conclude that at the relative distance from the GalC of less than 50 pc, we can expect on average about three to four GCs’ close passages during each 1 Gyr and at the relative distance of less than 80 pc we can expect approximately five to six GCs’ close passages near the GalC.
We also estimated the interaction rate between the GCs and GalC as a function of the relative distance from the centre at different time intervals (1 Gyr) for each of the four TNG-TVP: #411321, #441327, #451323, and #462077 (see Fig. 3 and Appendix C). In general, we can see that the collision rates are lower in the early stages of the evolution (8−10 Gyr ago). But the individual behaviour of the collision rates depends on the specific TNG-TVPs. For comparison, the solid black line in the upper left panel of the figure shows the global cumulative interaction rate as a function of the relative distance from the GalC. In the right panels of Fig. 3 and Appendix C, we present the contribution from individual GCs to the interaction rates divided into time bins. As we can see, there are several clusters that dominate as to the global interaction rates. We analyse their properties in detail in Sect. 4.
 |
Fig. 3. Interaction rate of GCs with the GalC as a function of the relative distance from the centre in different time intervals (colour dashed lines) for #411321 and #411321-m TNG-TVPs (left panels). Each time interval have a length of 1 Gyr. The solid black line is a global close passages rate for a whole time interval of 10 Gyr. The grey solid lines are results for 1000 simulations with different random realisations. Contribution of individual GCs into global collision rate at different time ranges for #411321 and #411321-m TNG-TVPs (right panels). |
The lower panels in Fig. 3 show interaction rates in time bins for the potential including the SMBH #411321-m (left) and the contribution from individual GCs (right). Comparing the upper and lower panels of the figure, we can conclude that the effects of the SMBH on the global interaction rates are marginal.
We also present the orbital evolution with and without the SMBH mass influence in #411321 TNG-TVP external potential for the GC NGC 362 (Fig. A.1), PH 1 (Fig. A.4), and for the NGC 6401 (Fig. A.5). As we can see, significant changes in the orbits start only after 8 Gyr of lookback time. We can understand this as a result of the significant halo and disk mass loss of the model galaxy after 8 Gyr. However, as we can see in Fig. 3, the influence of the central SMBH mass is generally not significant on the GC versus the GalC interaction rates.
For example, on #411321 and #451323 TNG-TVPs, we see a similar initial behaviour for the interaction rates as a function of time. At the beginning of our integration (from 0 to 2 Gyr), there are growing interaction rates, in total around ∼10−15 events per billion years. Around 4−6 Gyr, there is a maximum of interaction rates, roughly 12−20 events per billion years. In the case of #441327 TNG-TVP, there is a completely different shape – almost constant interaction rates in time (eight events per billion years). In this gravitational potential #462077 there is an interesting feature; for more details, readers can refer to Appendix C. Here the local minimum happens in between 2 and 3 Gyr. So, there is first a drop to eight events per billion years and only after that does it start to grow up to 15 events per billion years. As we can see from Fig. 3 and Appendix C in the right panels, the most ‘active’ (in an interaction sense) GCs are as follows: NGC 6642 (cyan), NGC 6401 (red), and HP 1 (blue) independently from the TNG-TVP external potentials.
3.2. Statistical analysis of the GCs’ interaction rates
Our analysis of the GCs’ interaction rates presented in the previous subsection (Fig. 3) shows that there are several GCs that play a major contributing role to the interaction rates with the GalC (such as NGC 6401, Pal 6, NGC 6681, NGC 6712, NGC 6287, NGC 4462, NGC 6981, HP 1, NGC 1904, and NGC 362). While others (e.g. NGC 6638, NGC 5946, UKS-1, Pal 14, Pal 15, NGC 6229, ESO-452, IC-1257, and Pal 2) have far fewer potential encounters. In this subsection we investigate each of the individual GCs and quantify their probability of their close encounters.
To calculate the probability that each individual GC experienced a close encounter with the GalC at least once during its lifetime, we searched for close passages in all random realisations for each of the four TNG potentials. Thus, the probability is PGC = (Mrand/1000)⋅100%, where Mrand is the number of models in which the GC approaches the GalC (Dm < 100 pc) at least once from the 1000 random realisations in a particular potential.
In total, in our four TNG-TVP potentials, there are 36 657 cases, while there is at least one individual interaction between GalC and 98 GCs (from all 147 GCs) from all (4×1000 = 4000) random realisations (see the end of Sect. 2.1). We selected the top ten GCs with the highest chance of interaction and summarised their probabilities PGC in Table 3.
Percent of probability of the GCs’ interaction with the GalC in all 1000 sets of randomisation for four TNG TVPs.
As we can see from Table 3, the six GCs, NGC 6401, Pal 6, NGC 6681, NGC 6712, NGC 6287, and NGC 6642, have very reliable close passages near the GalC in all four TNG external potentials with the probability of almost 100%. This fact can already be stated as a strong conclusion about the dynamical evolution of these GCs. The other four GCs, NGC 6981, HP 1, NGC 1904, and NGC 362, have interactions’ probability values in the range from 90% to 27%.
We additionally estimated the impact of the random sample sizes on the probability results for the selected GCs in Table 3. For this investigation from all 1000 random realisations for selected #411321 TNG-TVP potential, we randomly constructed sub-samples with sizes of 200, 400, 600, and 800 and compared the probability of interaction PGC with the full 1000 randomisation results. Starting from a few hundred realisations, the interaction numbers are saturated. As an example, we can show GC HP 1 interaction probabilities in different sub-samples: 99% (200), 98% (400), 98% (600), 98% (800), and 99% (1000). For the GC NGC 6401, we get 100% probability for all sample sizes. As we expected, the interaction probability results PGC practically do not depend on the sample size starting from a sub-sample size of 200.
4. Physical characteristics of the selected GCs
For all our selected GCs, we determined the regions of the Galaxy where they are generally located. For selection, we applied the criteria according to Bland-Hawthorn & Gerhard (2016). In Fig. 4, we present the distribution of the GCs that have at least one individual interaction with the GalC according to the location in different Galactic regions for the four TNG-TVP potentials.
 |
Fig. 4. Distribution of the GCs by their origin: bulge (BL), thin disk (TN), thick disk (TH), and halo (HL) in four Galactic components. |
As a main conclusion from Fig. 4, we can argue that the majority of the GCs in our sample that interact with the GalC come from the halo (HL) and thick disk (TH) regions. As an interesting fact, we can note that for the TNG-TVP #462077, there are not any objects from the bulge (BL) region that could potentially come into close vicinity of the GalC.
We calculated the changes in the relative energy ΔE/E of our selected sample of ten GCs during the full time evolution up to 10 Gyr. As an example, the energy changes of individual GCs in the TNG-TVP #411321 are presented in Fig. 5. The maximum changes in energy reaches ∼40%, but only at the end of the integration. From Fig. 5, we can conclude that our selected ten GCs are not strongly affected by the time evolution of the external gravitational potential up to ∼7 Gyr. We see some significant changes only for the last 2 Gyr.
 |
Fig. 5. Relative energy ΔE/E changes of the selected GCs in percent during orbital evolution for the #411321 TNG-TVP external potential. |
In Fig. 6, we present the orbital trajectories of the two selected GCs (NGC 6401 and NGC 6981) as an example. The figure shows all the different realisations (grey lines) that reflect the assumed velocity measurement errors (eRV, ePMRA, and eMDEC). The colour line (coded by the lookback time) represents the trajectory based on the data from the catalogues, without taking the measurements errors into account. The trajectories are presented in three planes (X, Y), (X, Z), and (R, Z, where R is the planar Galactocentric radius) inside the box 100×100 pc. The plots for the other eight GCs – Pal 6, NGC 6712, NGC 6287, NGC 6642, HP 1, NGC 6681, and NGC 1904 – are presented in Appendix B.
 |
Fig. 6. Detailed trajectories that have interactions with the GalC in the three planes (X, Y), (X, Z), and (R, Z) (where R is the planar Galactocentric radius) inside the box 100×100 pc. The GCs (from top to bottom): NGC 6401 and NGC 6981 in #411321 TNG-TVP potential. The colour line presents the trajectory based on the data from the catalogues. The grey lines take the measurement errors into account. |
As an additional item in Table 3, in Col. 3, we present the interaction probability of the GCs with the GalC, taking the presence of the MW SMBH into account. As we can see from Cols. 2 and 3, the differences are minimal for the #411321 TNG-TVP – not more than a few percent. We also see similar behaviour in Table 4. The statistics of the GCs’ interactions with the GalC are almost identical in the potentials #411321 and #411321-m.
Statistics of the characteristics of the GCs’ interaction with the GalC in all four TNG-TVP external potentials.
We also checked, in detail, the parameters of close GalC encounters for the selected ten GCs for all 1000 random sample realisations. The minimum distance in parsec between the GC and GalC in our sample realisations is denoted as ⟨Dm⟩, the corresponding value of the relative velocity is denoted as ⟨dV⟩, and the average number of individual interactions for each randomisation for each TNG-TVPs is denoted as ⟨Nint⟩. We present all of these values in Table 4. The (±) values in each column represent the standard deviation from these average values based on our 1000 random realisations.
From Table 4, one can conclude that close encounters between the GCs and GalC statistically, on average, occur with the minimum relative distance of around ∼60 pc and with the relative velocity ∼400 km s−1. We can see that for individual GCs these numbers are highly similar even for different TNG-TVPs’ potentials.
Analysing the first six GCs that have the highest statistical probability of interaction with the GalC, we found that NGCs 6642 and 6401 have more passes than the others. The average values of interaction over all four TNG-TVP potentials are estimated to be ∼36 and ∼27, respectively. In addition, the NGC 6642 also has the lowest relative velocity at the moment of close passage to the GalC from the entire sample. The next GC with high interaction numbers among the four potentials is Pal 6, which has ∼15 passes. However, Pal 6 has much higher uncertainties.
In Table 5, we present the orbits’ main characteristics of the selected ten clusters, such as the values of pericentre ‘per’, orbital eccentricity ‘ecc’, and the maximum height above the Galactic plane zmax. Also we present here the belonging of each cluster to our Galaxy, as well as the possible progenitors according to the classification of Malhan et al. (2022). Here the main bulge (M-B) of our Galaxy, Gaia-Enceladus (G-E), remains a dwarf galaxy and Pontus remains an ancient satellite galaxy. Also here we present some other physical characteristics of the GCs: age, current masses, half-mass radii, and Galactocentric distance. In Appendix A we present the orbital evolution up to 10 Gyr for these GCs in four TNG-TVP external potentials, #411321, #441327, #451323, and #462077.
Main kinematic characteristics of the selected GCs and their orbits in #411321 TNG-TVP external potential.
In Fig. 7 we present the Galactocentric distances for the selected GCs (Table 4) for all four TNG-TVP external potentials (with a selected time resolution of 1 Myr). As we can see, for these ten objects, the close approaches to the GalC happen over almost all the integration time. From Fig. 7, we can conclude that the main changes in the orbital evolution of the selected GCs mainly happen after an ∼8 Gyr lookback time (reddish colour). This behaviour (that is the constant increasing of the GCs’ orbits’ apocentre) can be easily understood as a consequence of the global mass change of our TNG-TVPs; for more details, readers can refer to our online figures4.
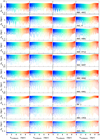 |
Fig. 7. 3D distance from the GalC for the ten selected GCs for all four TNG-TVPs (from left to right): #411321, #441327, #451323, and #462077. |
We analysed the phase-space distribution of ten selected GCs in three combinations of coordinates: total specific angular momentum (Ltot/m) versus total specific energy (E/m); the perpendicular component of the specific angular momentum (Lperp/m) versus E/m; and the z component of the specific angular momentum (Lz/m) versus E/m. In Fig. 8, we present the three typical cases for NGC 6642, NGC 1904, and NGC 6681 in the #411321 TNG-TVP.
 |
Fig. 8. Energy versus angular momentum for a few GCs in #411321 TNG-TVP. From left to right: total angular momentum (Ltot/m) versus total specific energy (E/m), the perpendicular component of the angular momentum (Lperp/m) versus total specific energy, and the zth component of the angular momentum (Lz/m) versus total specific energy. |
In Fig. 8, we can see the rather predictable phase space behaviour of our selected GCs. As expected, based on the generally axisymmetric nature of our TNG-TVP, the z-component of the total angular momentum Lz/m should conserve over the integration time. The E/m generally changes according to the mass growth or loss of the model Galactic potential. Both Ltot/m and Lperp/m are non-conserving quantities, as we can see in the figures. The small relative changes of the Lz/m values of our objects over time can be explained by the small deviation from axial symmetry due to the mass component changes of the TNG-TVP over the orbital period of the individual GCs.
5. Conclusions
In this study, we have investigated the orbits of 147 MW GCs on a cosmological timescale using data from Gaia Data Release 3, after excluding GCs with large errors in their proper motions and radial velocities. We employed time-varying external potentials from IllustrisTNG-100 simulations, selecting four potentials that best match the MW, and we generated 1000 realisations for each of them. The GCs were backwards integrated using the high-order parallel dynamical N-body code φ-GPU. Our main objective was to identify GCs with close passages near the GalC and gain insights into the evolution of the MW’s GC subsystem. The main results of our study are summarised below.
-
We found 98 GCs with close passages near the GalC in all four TNG-TVPs.
-
The number of interactions of GCs with the GalC per billion years varies from three to four at distances of less than 50 pc to five and six at 80 pc for each of the TNG-TVP external potentials.
-
Analysing the same interaction rates with time binning of 1 Gyr, we found almost constant interaction rates in the 1−8 Gyr lookback time interval, which decrease after 8 Gyr due to changes in the masses of the disk and halo components and their scale parameters.
-
We identified ten GCs, including NGC 6401, Pal 6, NGC 6681, NGC 6712, NGC 6287, NGC 6642, NGC 6981, HP 1, NGC 1904, and NGC 362, with a high probability of close passages near the GalC in all four TNG-TVPs, particularly the first six with a probability of around 100%.
Our main results indicate that the maximum interaction frequency of GCs with the GalC in the Milky Way is a few dozen passages per billion years within the 100 pc central zone. However, this low interaction frequency cannot fully explain the relatively high mass (of the order of 107 M⊙) of the MW’s NSC, if we only consider periodic capturing of stars from close-passing GCs. Therefore, we need to consider other scenarios as well, such as the full tidal destruction of some of the early GCs during interaction with the forming NSC and GalC. Our study provides valuable insights into the evolution of the MW’s GC subsystem by identifying a dozen GCs that are the most likely candidates to approach the GalC.
Error values for PMRA, PMDEC, and RV can be found at https://people.smp.uq.edu.au/HolgerBaumgardt/globular/orbits_table.txt
Milky Way-like TNG-TVP potentials: https://sites.google.com/view/mw-type-sub-halos-from-illustr/TNG-MWl
IllustrisTNG-100: https://www.tng-project.org/data/
Milky Way-like TNG-TVP potentials https://sites.google.com/view/mw-type-sub-halos-from-illustr/TNG-MWl
Acknowledgments
The authors thank the anonymous referee for a very constructive report and suggestions that helped significantly to improve the quality of the manuscript. The work of M.I., D.K., T.P. and P.B. was funded by the Science Committee of the Ministry of Education and Science of the Republic of Kazakhstan (Grant No. AP14870501). M.I. acknowledges the Europlanet 2024 RI project funded by the European Union’s Horizon 2020 Research and Innovation Programme (Grant agreement No. 871149). The work of M.I., M.S. and P.B. was also supported by the Volkswagen Foundation under the Trilateral Partnerships grant No. 97778 and special stipend No. 9B870 (for PB). M.I., M.S. and P.B. acknowledge the support from the ACIISI, Consejería de Economía, Conocimiento y Empleo del Gobierno de Canarias and the European Regional Development Fund (ERDF) under grant with reference PROID2021010044. M.I. and P.B. acknowledge the support by Ministry of Education and Science of Ukraine under the collaborative grant M/32-23.05.2022. This work has made use of data from the European Space Agency (ESA) mission Gaia (https://www.cosmos.esa.int/gaia), processed by the Gaia Data Processing and Analysis Consortium (DPAC, https://www.cosmos.esa.int/web/gaia/dpac/consortium). Funding for the DPAC has been provided by national institutions, in particular the institutions participating in the Gaia Multilateral Agreement. T.P. acknowledges the support by the Science and Technology Facilities Council (STFC) Grant Number ST/W000903/1.
References
- Arca Sedda, M., Berczik, P., Capuzzo-Dolcetta, R., et al. 2019, MNRAS, 484, 520 [Google Scholar]
- Arca Sedda, M., Gualandris, A., Do, T., et al. 2020, ApJ, 901, L29 [Google Scholar]
- Ashman, K. M., & Zepf, S. E. 1992, ApJ, 384, 50 [Google Scholar]
- Bajkova, A. T., & Bobylev, V. V. 2021, RAA, 21, 173 [NASA ADS] [Google Scholar]
- Bajkova, A. T., Carraro, G., Korchagin, V. I., Budanova, N. O., & Bobylev, V. V. 2020, ApJ, 895, 69 [NASA ADS] [CrossRef] [Google Scholar]
- Balbinot, E., Santiago, B. X., Bica, E., & Bonatto, C. 2009, MNRAS, 396, 1596 [NASA ADS] [CrossRef] [Google Scholar]
- Barmby, P., & Huchra, J. P. 2001, AJ, 122, 2458 [CrossRef] [Google Scholar]
- Baumgardt, H., & Vasiliev, E. 2021, MNRAS, 505, 5957 [NASA ADS] [CrossRef] [Google Scholar]
- Baumgardt, H., Hilker, M., Sollima, A., & Bellini, A. 2019, MNRAS, 482, 5138 [Google Scholar]
- Bennett, M., Bovy, J., & Hunt, J. A. S. 2022, ApJ, 927, 131 [NASA ADS] [CrossRef] [Google Scholar]
- Berczik, P., Nitadori, K., Zhong, S., et al. 2011, International Conference on High Performance Computing, HPC-UA 2011, 8 [Google Scholar]
- Berczik, P., Spurzem, R., & Wang, L. 2013, Third International Conference on High Performance Computing, HPC-UA 2013, 52 [Google Scholar]
- Bland-Hawthorn, J., & Gerhard, O. 2016, ARA&A, 54, 529 [Google Scholar]
- Burkert, A., & Tremaine, S. 2010, ApJ, 720, 516 [NASA ADS] [CrossRef] [Google Scholar]
- Chen, Z., Do, T., Ghez, A. M., et al. 2023, ApJ, 944, 79 [NASA ADS] [CrossRef] [Google Scholar]
- Cohen, R. E., Bellini, A., Casagrande, L., et al. 2021, AJ, 162, 228 [NASA ADS] [CrossRef] [Google Scholar]
- Do, T., David Martinez, G., Kerzendorf, W., et al. 2020, ApJ, 901, L28 [NASA ADS] [CrossRef] [Google Scholar]
- Event Horizon Telescope Collaboration (Akiyama, K., et al.) 2022, ApJ, 930, L12 [NASA ADS] [CrossRef] [Google Scholar]
- Forbes, D. A., & Bridges, T. 2010, MNRAS, 404, 1203 [NASA ADS] [Google Scholar]
- Gaia Collaboration (Helmi, A., et al.) 2018, A&A, 616, A12 [NASA ADS] [CrossRef] [EDP Sciences] [Google Scholar]
- Gaia Collaboration (Brown, A. G. A., et al.) 2021, A&A, 650, C3 [EDP Sciences] [Google Scholar]
- Genzel, R., Eisenhauer, F., & Gillessen, S. 2010, Rev. Mod. Phys., 82, 3121 [Google Scholar]
- Ghez, A. M., Salim, S., Hornstein, S. D., et al. 2005, ApJ, 620, 744 [NASA ADS] [CrossRef] [Google Scholar]
- Ghez, A. M., Salim, S., Weinberg, N. N., et al. 2008, ApJ, 689, 1044 [Google Scholar]
- Gillessen, S., Plewa, P. M., Eisenhauer, F., et al. 2017, ApJ, 837, 30 [Google Scholar]
- González-Lópezlira, R. A., Lomelí-Núñez, L., Álamo-Martínez, K., et al. 2017, ApJ, 835, 184 [CrossRef] [Google Scholar]
- Harris, G. L. H., & Harris, W. E. 2011, MNRAS, 410, 2347 [NASA ADS] [CrossRef] [Google Scholar]
- Harris, G. L. H., Poole, G. B., & Harris, W. E. 2014, MNRAS, 438, 2117 [NASA ADS] [CrossRef] [Google Scholar]
- Ibata, R., Malhan, K., Martin, N., et al. 2021, ApJ, 914, 123 [NASA ADS] [CrossRef] [Google Scholar]
- Ishchenko, M. V., Sobolenko, M. O., Kalambay, M. T., Shukirgaliyev, B. T., & Berczik, P. P. 2021, Rep. Natl. Acad. Sci. Repub. Kazakhstan, 6, 94 [Google Scholar]
- Ishchenko, M., Sobolenko, M., Berczik, P., & Panamarev, T. 2023a, Kinemat. Phys. Celest. Bodies, 39, 33 [NASA ADS] [CrossRef] [Google Scholar]
- Ishchenko, M., Sobolenko, M., Berczik, P., et al. 2023b, A&A, 673, A152 (Paper I) [NASA ADS] [CrossRef] [EDP Sciences] [Google Scholar]
- Just, A., Khan, F. M., Berczik, P., Ernst, A., & Spurzem, R. 2011, MNRAS, 411, 653 [Google Scholar]
- Just, A., Yurin, D., Makukov, M., et al. 2012, ApJ, 758, 51 [NASA ADS] [CrossRef] [Google Scholar]
- Lotz, J. M., Miller, B. W., & Ferguson, H. C. 2004, ApJ, 613, 262 [NASA ADS] [CrossRef] [Google Scholar]
- Makino, J., & Aarseth, S. J. 1992, PASJ, 44, 141 [NASA ADS] [Google Scholar]
- Malhan, K., Ibata, R. A., Sharma, S., et al. 2022, ApJ, 926, 107 [NASA ADS] [CrossRef] [Google Scholar]
- Mardini, M. K., Placco, V. M., Meiron, Y., et al. 2020, ApJ, 903, 88 [NASA ADS] [CrossRef] [Google Scholar]
- Marinacci, F., Vogelsberger, M., Pakmor, R., et al. 2018, MNRAS, 480, 5113 [NASA ADS] [Google Scholar]
- McConnachie, A. W. 2012, AJ, 144, 4 [Google Scholar]
- McConnachie, A. W., Higgs, C. R., Thomas, G. F., et al. 2021, MNRAS, 501, 2363 [NASA ADS] [CrossRef] [Google Scholar]
- McLaughlin, D. E., Harris, W. E., & Hanes, D. A. 1994, ApJ, 422, 486 [NASA ADS] [CrossRef] [Google Scholar]
- Miyamoto, M., & Nagai, R. 1975, PASJ, 27, 533 [NASA ADS] [Google Scholar]
- Naiman, J. P., Pillepich, A., Springel, V., et al. 2018, MNRAS, 477, 1206 [Google Scholar]
- Navarro, J. F., Frenk, C. S., & White, S. D. M. 1997, ApJ, 490, 493 [Google Scholar]
- Nelson, D., Pillepich, A., Springel, V., et al. 2018, MNRAS, 475, 624 [Google Scholar]
- Nelson, D., Springel, V., Pillepich, A., et al. 2019, Comput. Astrophys. Cosmol., 6, 2 [Google Scholar]
- Neumayer, N., Seth, A., & Böker, T. 2020, A&ARv, 28, 4 [Google Scholar]
- Ortolani, S., Barbuy, B., Momany, Y., et al. 2011, ApJ, 737, 31 [NASA ADS] [CrossRef] [Google Scholar]
- Pillepich, A., Springel, V., Nelson, D., et al. 2018, MNRAS, 473, 4077 [Google Scholar]
- Souza, S. O., Valentini, M., Barbuy, B., et al. 2021, A&A, 656, A78 [NASA ADS] [CrossRef] [EDP Sciences] [Google Scholar]
- Springel, V., Pakmor, R., Pillepich, A., et al. 2018, MNRAS, 475, 676 [Google Scholar]
- Valcin, D., Bernal, J. L., Jimenez, R., Verde, L., & Wandelt, B. D. 2020, JCAP, 2020, 002 [Google Scholar]
- VandenBerg, D. A., Brogaard, K., Leaman, R., & Casagrande, L. 2013, ApJ, 775, 134 [Google Scholar]
- Vasiliev, E., & Baumgardt, H. 2021, MNRAS, 505, 5978 [NASA ADS] [CrossRef] [Google Scholar]
- Wang, L., & Lin, D. N. C. 2023, ApJ, 944, 140 [NASA ADS] [CrossRef] [Google Scholar]
Appendix A: Visualisation of the GCs’ orbits that have a close interaction with the GalC
We present orbital evolution for the selected ten GCs from Table 3. Each GC is represented in four TNG-TVP external potentials, #411321, #441327, #451323, and #462077. For the #411321-m TNG-TVP where we added the SMBH influence, we see only very insignificant changes in the GCs’ global orbits. We present here the three GCs with the most visible orbital changes, namely: NGC 362, HP 1, and NGC 6401. The orbital evolution is presented in three planes, (X, Y), (X, Z), and (R, Z) (where R is the planar Galactocentric radius). The total time of integration is a 10 Gyr lookback time and is shown by the coloured line.
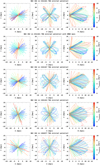 |
Fig. A.1. NGC 362 orbital changes in four TNG-TVP external potentials and one with SMBH mass. We show the following from top to bottom: #411321, #411321-m, #441327, #451323, and #462077. The orbital evolution is present in three planes, (X, Y), (X, Z), and (R, Z) (where R is the planar Galactocentric radius). The total time of integration is a 10 Gyr lookback time which is represented by the coloured line. |
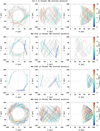 |
Fig. A.10. Same as in Fig. A.1, but for NGC 6981 though without #411321-m TNG-TVP. |
Appendix B: Detailed trajectories of GCs near the GalC
We present detailed orbital trajectories for GCs that have close passages near the GalC inside the box 100×100 pc in #411321 TNG-TVP external potential. The orbital evolution is presented in three planes, (X, Y), (X, Z), and (R, Z) (where R is the planar Galactocentric radius). The total time of integration is a 10 Gyr lookback time and is represented by a coloured line. The grey lines take the measurement errors in the orbital shapes into account.
 |
Fig. B.1. Detailed type of orbits that have interactions with the GalC in three planes, (X, Y), (X, Z), and (R, Z), where R is the planar Galactocentric radius in box 100×100 pc. The GCs from top to bottom: Pal 6, NGC 6712, NGC 6287, and NGC 6642 in #411321 TNG TVP. The colour line presents the trajectory based on the data from the catalogues. The grey lines take the measurement errors into account. |
Appendix C: Evolution of the GCs’ interaction rates
We present the interaction rate of the GCs with the GalC as a function of the relative distance from the centre in different time intervals (colour dashed lines) for TNG-TVPs: #441327, #451323, and #462077. Each time interval has a bin of 1 Gyr. The solid black line is a global close passages rate for a whole time interval of 10 Gyr. The grey solid lines are a result of 1000 simulations with different initial data random realisations. Also, we demonstrate the contribution of individual GCs to the global collision rate at different time ranges for the TNG-TVPs listed above.
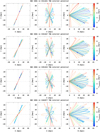 |
Fig. C.1. Left: Interaction rate of the GCs with the GalC as a function of the relative distance in different time intervals (colour dashed lines) for TNG-TVPs from top to bottom: #441327, #451323, and #462077. Each time interval has a length of 1 Gyr. The solid black line is a global close passages rate for a whole time interval of 10 Gyr. The grey solid lines are the results for 1000 simulations with different random realisations. Right: Contribution of individual GCs to the global collision rate at different time ranges for the TNG-TVPs listed above. |
All Tables
Parameters of the time-varying potentials selected from the IllustrisTNG-100 simulation at redshift zero.
Fitting parameters for the interaction rate GC with GalC as a function of the relative distance from the centre for four TNG-TVP external potentials.
Percent of probability of the GCs’ interaction with the GalC in all 1000 sets of randomisation for four TNG TVPs.
Statistics of the characteristics of the GCs’ interaction with the GalC in all four TNG-TVP external potentials.
Main kinematic characteristics of the selected GCs and their orbits in #411321 TNG-TVP external potential.
All Figures
 |
Fig. 1. Orbital evolution of two selected clusters: Pal 6 and NGC 6981. On the plot we show only the first 3 Gyr evolution in #411321 TNG-TVP external potential. The colour-coded line presents the orbit based on catalogue initial positions and velocities. The grey colour represents the orbits for ten different random realisations of initial data. |
| In the text | |
 |
Fig. 2. Interaction rate of the GCs with GalC as a function of the relative distance from the centre for the five TNG-TVP external potentials and 1000 random realisations (thin solid coloured lines). Thick dashed lines are a power-law fit in TNG potentials. The solid black line is a mean fitting line (see Table 2). The pale violet dotted line is a power-law fit for potential #411321-m for which the SMBH mass has been taken into account. |
| In the text | |
 |
Fig. 3. Interaction rate of GCs with the GalC as a function of the relative distance from the centre in different time intervals (colour dashed lines) for #411321 and #411321-m TNG-TVPs (left panels). Each time interval have a length of 1 Gyr. The solid black line is a global close passages rate for a whole time interval of 10 Gyr. The grey solid lines are results for 1000 simulations with different random realisations. Contribution of individual GCs into global collision rate at different time ranges for #411321 and #411321-m TNG-TVPs (right panels). |
| In the text | |
 |
Fig. 4. Distribution of the GCs by their origin: bulge (BL), thin disk (TN), thick disk (TH), and halo (HL) in four Galactic components. |
| In the text | |
 |
Fig. 5. Relative energy ΔE/E changes of the selected GCs in percent during orbital evolution for the #411321 TNG-TVP external potential. |
| In the text | |
 |
Fig. 6. Detailed trajectories that have interactions with the GalC in the three planes (X, Y), (X, Z), and (R, Z) (where R is the planar Galactocentric radius) inside the box 100×100 pc. The GCs (from top to bottom): NGC 6401 and NGC 6981 in #411321 TNG-TVP potential. The colour line presents the trajectory based on the data from the catalogues. The grey lines take the measurement errors into account. |
| In the text | |
 |
Fig. 7. 3D distance from the GalC for the ten selected GCs for all four TNG-TVPs (from left to right): #411321, #441327, #451323, and #462077. |
| In the text | |
 |
Fig. 8. Energy versus angular momentum for a few GCs in #411321 TNG-TVP. From left to right: total angular momentum (Ltot/m) versus total specific energy (E/m), the perpendicular component of the angular momentum (Lperp/m) versus total specific energy, and the zth component of the angular momentum (Lz/m) versus total specific energy. |
| In the text | |
 |
Fig. A.1. NGC 362 orbital changes in four TNG-TVP external potentials and one with SMBH mass. We show the following from top to bottom: #411321, #411321-m, #441327, #451323, and #462077. The orbital evolution is present in three planes, (X, Y), (X, Z), and (R, Z) (where R is the planar Galactocentric radius). The total time of integration is a 10 Gyr lookback time which is represented by the coloured line. |
| In the text | |
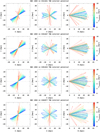 |
Fig. A.2. Same as in Fig. A.1, but for NGC 1904 though without #411321-m TNG-TVP. |
| In the text | |
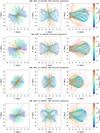 |
Fig. A.3. Same as in Fig. A.1, but for NGC 6287 though without #411321-m TNG-TVP. |
| In the text | |
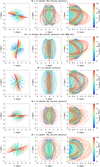 |
Fig. A.4. Same as in Fig. A.1, but for HP 1. |
| In the text | |
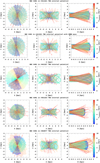 |
Fig. A.5. Same as in Fig. A.1, but for NGC 6401. |
| In the text | |
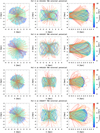 |
Fig. A.6. Same as in Fig. A.1, but for Pal 6 though without #411321-m TNG-TVP. |
| In the text | |
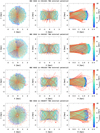 |
Fig. A.7. Same as in Fig. A.1, but for NGC 6642 though without #411321-m TNG-TVP. |
| In the text | |
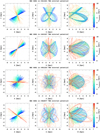 |
Fig. A.8. Same as in Fig. A.1, but for NGC 6681 though without #411321-m TNG-TVP. |
| In the text | |
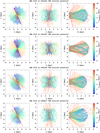 |
Fig. A.9. Same as in Fig. A.1, but for NGC 6712 though without #411321-m TNG-TVP. |
| In the text | |
 |
Fig. A.10. Same as in Fig. A.1, but for NGC 6981 though without #411321-m TNG-TVP. |
| In the text | |
 |
Fig. B.1. Detailed type of orbits that have interactions with the GalC in three planes, (X, Y), (X, Z), and (R, Z), where R is the planar Galactocentric radius in box 100×100 pc. The GCs from top to bottom: Pal 6, NGC 6712, NGC 6287, and NGC 6642 in #411321 TNG TVP. The colour line presents the trajectory based on the data from the catalogues. The grey lines take the measurement errors into account. |
| In the text | |
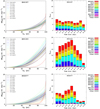 |
Fig. B.2. Same as in Fig. B.1, but for HP 1, NGC 6681, and NGC 1904 (from top to bottom). |
| In the text | |
 |
Fig. C.1. Left: Interaction rate of the GCs with the GalC as a function of the relative distance in different time intervals (colour dashed lines) for TNG-TVPs from top to bottom: #441327, #451323, and #462077. Each time interval has a length of 1 Gyr. The solid black line is a global close passages rate for a whole time interval of 10 Gyr. The grey solid lines are the results for 1000 simulations with different random realisations. Right: Contribution of individual GCs to the global collision rate at different time ranges for the TNG-TVPs listed above. |
| In the text | |
Current usage metrics show cumulative count of Article Views (full-text article views including HTML views, PDF and ePub downloads, according to the available data) and Abstracts Views on Vision4Press platform.
Data correspond to usage on the plateform after 2015. The current usage metrics is available 48-96 hours after online publication and is updated daily on week days.
Initial download of the metrics may take a while.


