Fig. 3.
Download original image
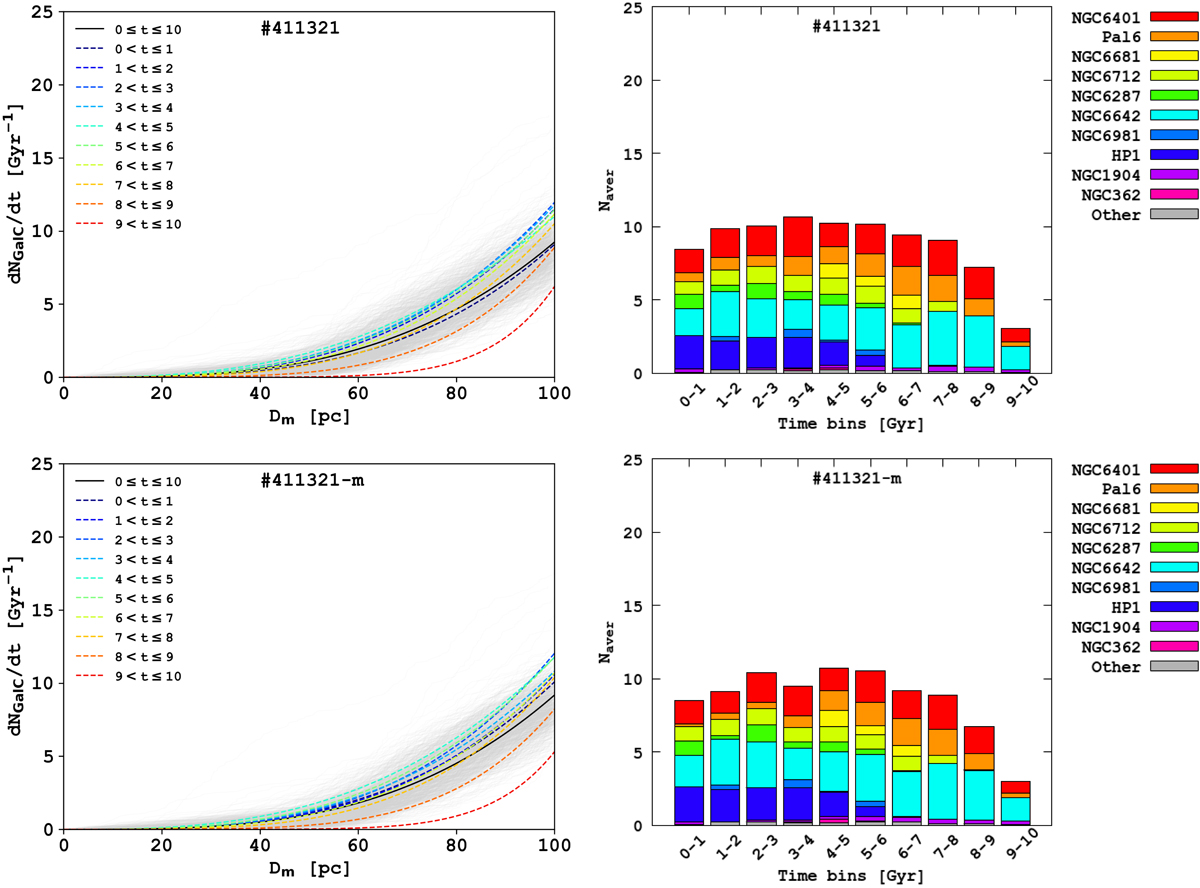
Interaction rate of GCs with the GalC as a function of the relative distance from the centre in different time intervals (colour dashed lines) for #411321 and #411321-m TNG-TVPs (left panels). Each time interval have a length of 1 Gyr. The solid black line is a global close passages rate for a whole time interval of 10 Gyr. The grey solid lines are results for 1000 simulations with different random realisations. Contribution of individual GCs into global collision rate at different time ranges for #411321 and #411321-m TNG-TVPs (right panels).
Current usage metrics show cumulative count of Article Views (full-text article views including HTML views, PDF and ePub downloads, according to the available data) and Abstracts Views on Vision4Press platform.
Data correspond to usage on the plateform after 2015. The current usage metrics is available 48-96 hours after online publication and is updated daily on week days.
Initial download of the metrics may take a while.