Open Access
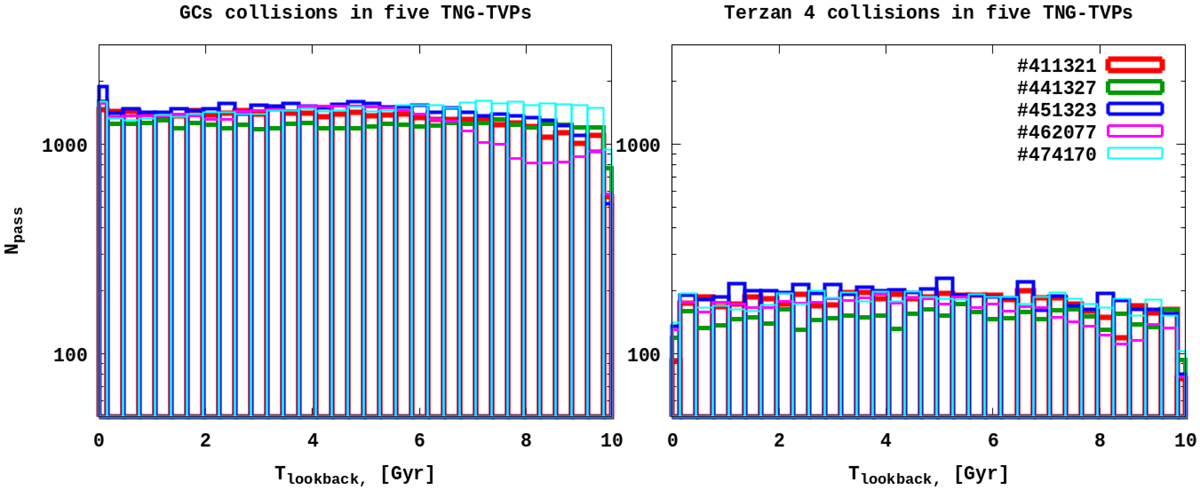
Fig. 4.
Download original image
Distribution of all possible GC collisions taking the selection criteria (ii) and (iii) during the whole 10 Gyr time interval into account (left panel). Same as in the left panel, but encounters only with the GC Terzan 4 (left panel). The time bin is 0.3 Gyr.
Current usage metrics show cumulative count of Article Views (full-text article views including HTML views, PDF and ePub downloads, according to the available data) and Abstracts Views on Vision4Press platform.
Data correspond to usage on the plateform after 2015. The current usage metrics is available 48-96 hours after online publication and is updated daily on week days.
Initial download of the metrics may take a while.