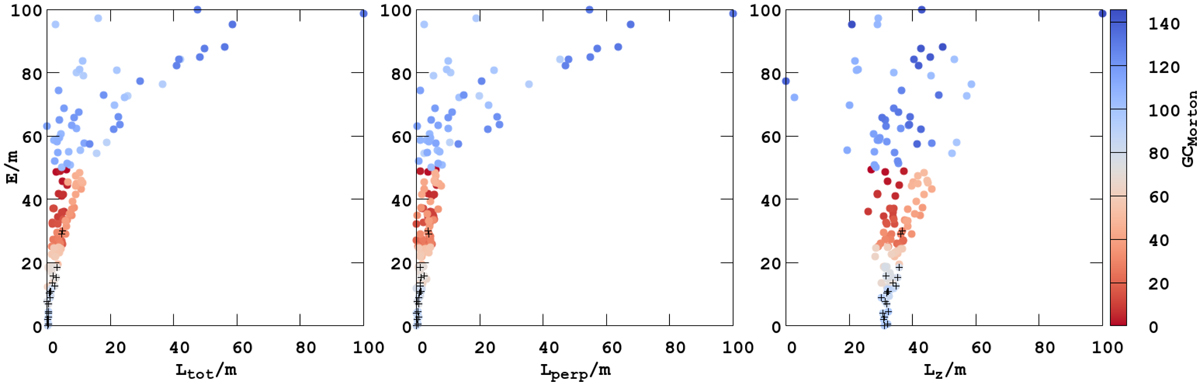
Fig. 6.
Download original image
Projections of the individual GCs positions from the 3D phase space of the normalised specific values of (E, Ltot, Lperp, and Lz) to (Ltot and E) plane in the left and center panel (Lperp, E), and in the (Lz, E) plane in the right panel. The data are represented for the 411321 TNG-TVP potential after sorting by the Morton space-filling curve, where the colour indicates the order of the GCs after the Morton analysis. The black crosses indicate the selected GCs from Fig. 5.
Current usage metrics show cumulative count of Article Views (full-text article views including HTML views, PDF and ePub downloads, according to the available data) and Abstracts Views on Vision4Press platform.
Data correspond to usage on the plateform after 2015. The current usage metrics is available 48-96 hours after online publication and is updated daily on week days.
Initial download of the metrics may take a while.