Open Access
Fig. 7
Download original image
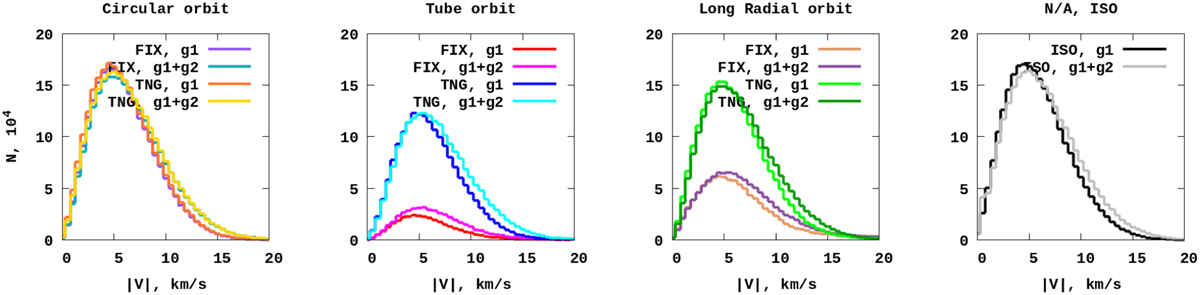
3D velocity distributions of the particles in the GCs for ɡ1 and ɡ1+ɡ2 simulations at T = −5 Gyr (i.e. after approximately one two-body relation time) after inserting the ɡ2 component. The distributions are similar in all cases as the ɡ2 component represents a small fraction of the stars.
Current usage metrics show cumulative count of Article Views (full-text article views including HTML views, PDF and ePub downloads, according to the available data) and Abstracts Views on Vision4Press platform.
Data correspond to usage on the plateform after 2015. The current usage metrics is available 48-96 hours after online publication and is updated daily on week days.
Initial download of the metrics may take a while.