Fig. 2
Download original image
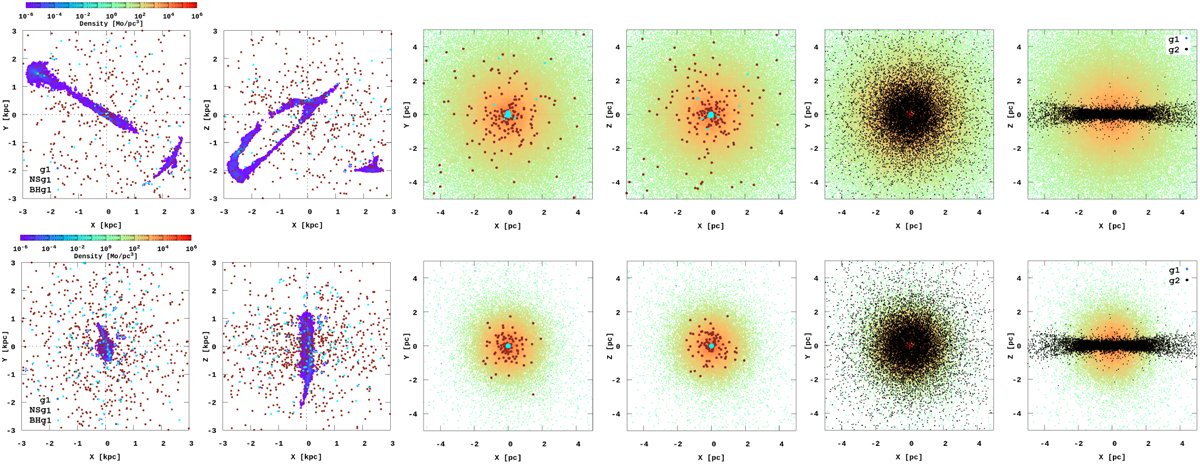
GC density distribution at −6.0 Gyr for the tube orbit at the moment when the second-generation stars (ɡ2) are added to the GC. The two left panels show the GC in global galactocentric coordinates. The cyan and brown dots show BHs and NSs in the GC. The two middle panels show the density of the central GC core (5 × 5 pc). The two right panels show the initial spatial distributions of the ɡ2 stars in the GC (black dots) that form a disk. The upper and lower panels show the density distribution inside the GC in the 411321 and the FIX potentials, respectively.
Current usage metrics show cumulative count of Article Views (full-text article views including HTML views, PDF and ePub downloads, according to the available data) and Abstracts Views on Vision4Press platform.
Data correspond to usage on the plateform after 2015. The current usage metrics is available 48-96 hours after online publication and is updated daily on week days.
Initial download of the metrics may take a while.