Fig. 9
Download original image
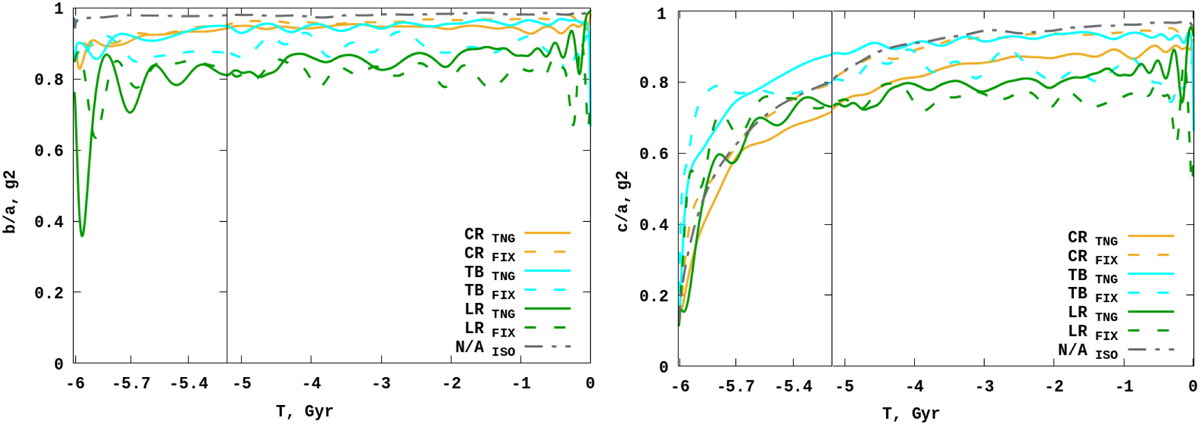
Ratio of the moment of inertia matrix principal axes b/a and c/a for the second generation of stars ɡ2. The vertical line at −5.1Gyr shows the two-body relaxation time (900 Myr). A rapid change is visible much earlier on: a few times the 100 Myr VRR timescale (Eq. (4)). The solid lines represent TNG, the dashed lines are the FIX potentials, and the dot-dashed lines are the isolated cases.
Current usage metrics show cumulative count of Article Views (full-text article views including HTML views, PDF and ePub downloads, according to the available data) and Abstracts Views on Vision4Press platform.
Data correspond to usage on the plateform after 2015. The current usage metrics is available 48-96 hours after online publication and is updated daily on week days.
Initial download of the metrics may take a while.