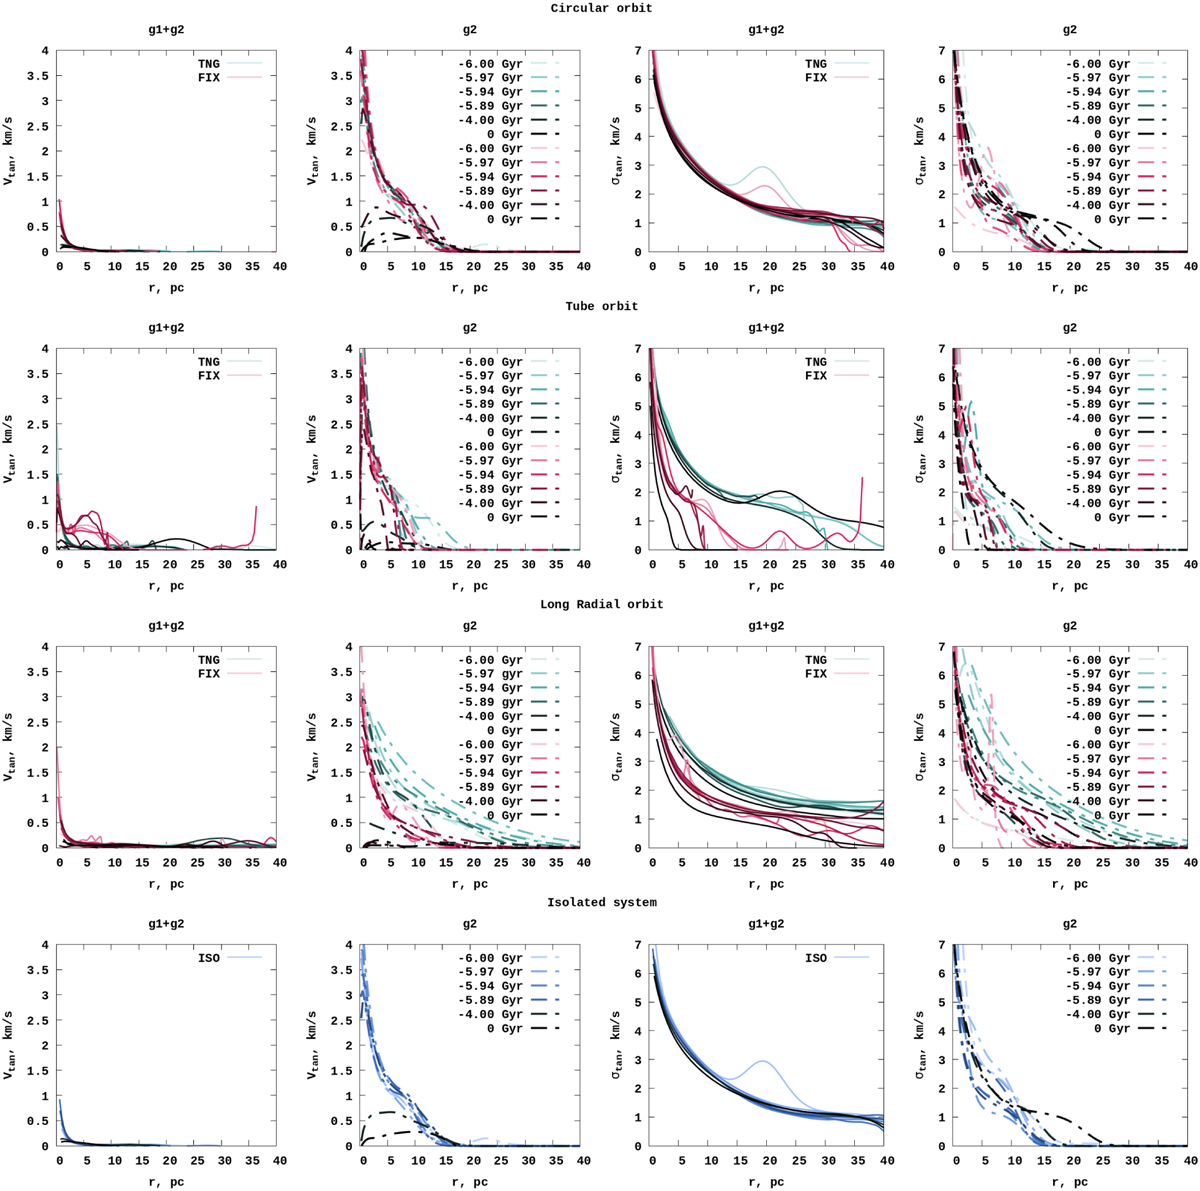
Fig. 8
Download original image
Evolution of the mean tangential velocity (left two panels) and the tangential velocity dispersions (right two panels) for g1+ɡ2 stars and for the ɡ2 separately for the different external potentials and lookback times. The different rows of panels show different orbit families, as labelled. The solid green, red, and blue curves show models in time-variable TNG potential, the FIX potential, and the ISO isolated case, respectively. The different curves show different moments of time for each potential, as labelled.
Current usage metrics show cumulative count of Article Views (full-text article views including HTML views, PDF and ePub downloads, according to the available data) and Abstracts Views on Vision4Press platform.
Data correspond to usage on the plateform after 2015. The current usage metrics is available 48-96 hours after online publication and is updated daily on week days.
Initial download of the metrics may take a while.