| Issue |
A&A
Volume 692, December 2024
|
|
|---|---|---|
| Article Number | A114 | |
| Number of page(s) | 20 | |
| Section | Interstellar and circumstellar matter | |
| DOI | https://doi.org/10.1051/0004-6361/202450089 | |
| Published online | 06 December 2024 | |
High-resolution observations of 12CO and 13CO J = 3 → 2 towards the NGC 6334 extended filament
I. Emission morphology and velocity structure
1
Max-Planck-Institut für Radioastronomie,
Auf dem Hügel 69,
53121
Bonn,
Germany
2
Centre for Astrophysics and Planetary Science, University of Kent,
Canterbury,
CT2 7NH,
UK
3
Argelander-Institut für Astronomie,
Auf dem Hügel 71,
53121
Bonn,
Germany
4
Departamento de Astronomia, Universidad de Chile,
Casilla 36-D,
Santiago,
Chile
★ Corresponding author; This email address is being protected from spambots. You need JavaScript enabled to view it.
Received:
22
March
2024
Accepted:
29
August
2024
Abstract
NGC 6334 is a giant molecular cloud (GMC) complex that exhibits elongated filamentary structure and harbours numerous OB-stars, H II regions, and star-forming clumps. To study the emission morphology and velocity structure of the gas in the extended NGC 6334 region using high-resolution molecular line data, we made observations of the 12CO and 13CO J = 3 → 2 lines with the LAsMA instrument at the APEX telescope. The LAsMA data provided a spatial resolution of 20″ (~0.16 pc) and sensitivity of 0.4 K at a spectral resolution of 0.25 km s−1. Our observations revealed that gas in the extended NGC 6334 region exhibits connected velocity coherent structure over ~80 pc parallel to the Galactic plane. The NGC 6334 complex has its main velocity component at approximately −3.9 km s−1 with two connected velocity structures at velocities approximately −9.2 km s−1 (the ‘bridge’ features) and −20 km s−1 (the northern filament, NGC 6334-NF). We observed local velocity fluctuations at smaller spatial scales along the filament that are likely tracing local density enhancement and infall, while the broader V-shaped velocity fluctuations observed towards the NGC 6334 central ridge and G352.1 region located in the eastern filament EF1 indicate globally collapsing gas onto the filament. We investigated the 13CO emission and velocity structure around 42 WISE H II regions located in the extended NGC 6334 region and found that most H II regions show signs of molecular gas dispersal from the centre (36 of 42) and intensity enhancement at their outer radii (34 of 42). Furthermore most H II regions (26 of 42) are associated with least one ATLASGAL clump within or just outside of their radii, the formation of which may have been triggered by H II bubble expansion. Typically towards larger H II regions we found visually clear signatures of bubble shells emanating from the filamentary structure. Overall the NGC 6334 filamentary complex exhibits sequential star formation from west to east. Located in the west, the GM-24 region exhibits bubbles within bubbles and is at a relatively evolved stage of star formation. The NGC 6334 central ridge is undergoing global gas infall and exhibits two gas bridge features possibly connected to the cloud-cloud collision scenario of the NGC 6334-NF and the NGC 6334 main gas component. The relatively quiescent eastern filament (EF1 - G352.1) is a hub-filament in formation, which shows the kinematic signature of global gas infall onto the filament. Our observations highlight the important role of H II regions in shaping the molecular gas emission and velocity structure as well as the overall evolution of the molecular filaments in the NGC 6334 complex.
Key words: ISM: bubbles / ISM: clouds / evolution / HII regions / ISM: kinematics and dynamics / ISM: structure
© The Authors 2024
 Open Access article, published by EDP Sciences, under the terms of the Creative Commons Attribution License (https://creativecommons.org/licenses/by/4.0), which permits unrestricted use, distribution, and reproduction in any medium, provided the original work is properly cited.
This article is published in open access under the Subscribe to Open model.
Open Access funding provided by Max Planck Society.
1 Introduction
NGC 6334 is a giant molecular cloud (GMC) complex that harbours a central dense filament and a large number of OB-type stars, H II regions and bubbles, and star-forming clumps in the extended region (e.g. Loughran et al. 1986; Kraemer & Jackson 1999; Muñoz et al. 2007; Persi & Tapia 2008; André et al. 2016; Russeil et al. 2013; Tigé et al. 2017; Arzoumanian et al. 2022). This complex is located at a distance of ~1.7 kpc (e.g. Russeil et al. 2012), and its large-scale molecular appearance is dominated by a ~70 pc long filamentary structure (within 352.6 ≥ l ≥ 350.2 (where I is Galactic longitude). The central dense ridge of NGC 6334, extending along the filament, contains sites of high-mass star formation in a sequence of evolutionary stages (e.g. Tigé et al. 2017) and has been reported to be undergoing longitudinal collapse, possibly triggered by a past high-mass star-forming event (e.g. Zernickel et al. 2013; Russeil et al. 2013). Arzoumanian et al. (2022) studied the extended NGC 6334 region based on their 13CO and C18O J = 2→1 observations obtained with the APEX telescope and highlighted cases of multiple gas compression in the region. In addition, they found a large number of velocity coherent filaments (VCFs) and interpreted their formation as resulting from large-scale compression by propagating shock fronts. Presenting a broader picture, Fukui et al. (2018b) proposed a cloud-cloud collision scenario in which a collision is happening from lower to higher longitudes of the extended NGC 6334 region, giving rise to the evolutionary sequence of star formation. A similar evolutionary sequence from lower longitude (GUM 1-24) to higher (in the NGC 6334 extended filament) is also reported by Russeil et al. (2013).
The formation of the large-scale filaments and their fragmentation processes are not understood well (see the review by Hacar et al. 2023). High angular resolution continuum and molecular line observations are essential to understand the small- to large-scale gas kinematics through which gas flows along or onto the filament. Regarding the formation of molecular clouds in the filaments, Elmegreen (1998) have highlighted the important role of gas compression due to H II regions (see also Inutsuka et al. 2015). HII regions are signposts of (high-mass) star formation within molecular clouds (e.g. Churchwell 2002). New H II regions are formed inside proto-stellar cores forming high-mass stars (OB-type) and their influence is evident on the evolution of the cloud as they emerge. At evolved stages, H II regions can shape the parental cloud material into structures with bubble- or shell-like morphology, in which triggered cases of star formation can proceed (cf. Elmegreen 1998). The young and evolved H II regions, either in isolation or in groups, shape the gas emission and velocity structure around them, and therefore their role in natal cloud dispersal and in creating a new generation of star formation requires detailed observational study of the gas kinematics around them.
The extended NGC 6334 region (including GM-24; see Fig. 1) contains 42 infrared H II regions (bubbles) reported in the catalogue1 of Anderson et al. (2014), of which 14 are classified as ‘known’ (K), 9 as ‘group’ (G), 6 as ‘candidate’ (C), and 13 as ‘radio quiet’ (Q) H II regions. The identification of these regions was primarily based on the mid-infrared characteristics of the WISE all-sky survey data (see Anderson et al. 2014 for more details), and their sizes range between 0.2 and 12 pc (see Table 1).
For this work we studied the gas emission morphology and velocity structure of the NGC 6334 extended region using high-resolution observations of 12CO and13 CO J = 3 → 2 molecular lines obtained with the LAsMA instrument on the APEX Telescope. Our goal is to disentangle, with this new large-scale, sensitive and high-resolution spectral line data, the different origins of the velocity structure in NGC 6334. This is done by investigating the impact of a large number of H II regions already formed in the giant molecular complex as well as the large-scale inflow of gas onto and through the filaments.
The paper is organized as follows. In Sect. 2 we describe the APEX LAsMA observations towards the region and provide an overview of the data reduction process and resulting sensitivities. In Sect. 3 we present the results. In Sect. 3.2 we present the velocity structure of the extended filament. In Sect. 3.3 the gas emission properties around the H II sources are presented. Sections 4 and 5 include the analysis and discussion of the results. Finally, Sect. 6 summarizes the highlights of this work.
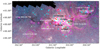 |
Fig. 1 Spitzer three-colour image (red: 8 µm, green: 4.5 µm, blue: 3.6 µm) of the NGC 6334 extended region. OB stars from Russeil et al. (2020) and Persi & Tapia (2008) are indicated by cyan triangles and red stars, respectively. H II bubbles from Anderson et al. (2014) are shown as dotted magenta circles, some of which are labelled in white or black text. The red plus signs give the positions of radio sources from Russeil et al. (2017). |
2 Observations and data reduction
2.1 LAsMA observations of 12CO and 13CO J=3→2
We mapped the NGC 6334 star-forming complex in the 12CO J = 3 → 2 and13 CO J = 3 → 2 lines, using the Large APEX sub-Millimetre Array (LAsMA), a 7 pixel heterodyne array receiver installed on the Atacama Pathfinder Experiment (APEX) 12m sub-millimetre telescope located on the Llano de Chajnantor (elevation of ~5100 m) in the Atacama desert, Chile. The LAsMA receiver operates in the 870 µm (345 GHz) atmospheric window and its seven pixels are arranged in a hexagonal shape with one central pixel and 40″ spacing between pixels, which corresponds to ~2 FWHM beam wdiths. The map was centred at Galactic coordinates l = 351.415° and b = +0.66°. The area of the extended NGC 6334 region mapped in this project covers ~2.5° × 1.2°.
The observations were made from June to September 2021 under good atmospheric conditions of ≤1.5 mm precipitable water vapour (PWV) content. The mapped region was divided into sub-maps (called tiles) 10′ × 10′ in size that were observed in on-the-fly (OTF) mode in both l and b directions. The 12CO J = 3 → 2 and13 CO J = 3 → 2 lines were observed simultaneously using a local oscillator frequency of 338.3 GHz. The 13CO (νrest = 330.587 GHz) line is observed in the lower side band and 12CO (νrest = 345.796 GHz) line in the upper side band. An advanced version of the APEX Fast Fourier Transform Spectrometer (FFTS, Klein et al. 2012) was used as a backend, resulting in a spectral resolution of 0.1 km s−1. At this observing frequency, the full width at half maximum (FWHM) beam width of the telescope is ~19″. The OTF observing time for each tile coverage was ~35 minutes and the total time spent to complete this project, including overheads, was ~62 hours.
Molecular line emission characteristics of WISE H II regions in NGC 6334.
2.2 Data reduction process
Data reduction was performed using the GILDAS2 software package. The following steps were taken to obtain the final spectral cubes of the full mapped region. First, we extracted the spectra in the −100 to +100 km s−1 LSR velocity range and re-sampled them to a common velocity resolution of 0.25 km s−1. The baseline subtracted data sets from different days and sub-regions were then combined to produce spectral cubes for the full mapped region. We use the table and xy_map packages in CLASS-GILDAS to regrid and smooth the data to the desired pixel size and resolution. The pixel size of the final cubes was set to 6″ × 6″, chosen to provide better than Nyquist sampling and to match that of other complementary data sets. In this data reduction procedure, we carefully flagged and removed spectra with bad baselines and those that contain ripples and artefacts. The final spatial resolution for the cubes is 20″, 0.16 pc at the distance of 1.7 kpc.
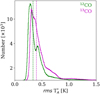 |
Fig. 2 Histogram of the rms T*A [K] in the 13CO and 12CO lines. The dotted vertical lines in colour indicate the median rms values. |
2.3 Sensitivity of rms
Figure 2 presents the histogram of the root mean square noise (rms in corrected antenna temperature  K)3 for the13 CO and 12CO spectra estimated from the first-order baseline fit to the spectra. The average rms in
  (computed per channel per pixel at the velocity resolution of 0.25 km s−1) for 12CO and 13CO is 0.39 and 0.46 K, respectively. The rms distribution of the 13CO emission is presented in Fig. A.1. The median rms in
  for 12CO and 13CO is 0.34 and 0.40 K, respectively. A 3σ detection in 13CO roughly correspond to a column density of
  , estimated with RADEX4 assuming a kinetic temperature of 20 K, density
  of 104 cm−3, and abundance ratios of 12CO/13CO=77 (Wilson & Rood 1994) and 12CO/H2 ~ 8.5 × 10⁻⁵ (Frerking et al. 1982).
Previous studies of NGC 6334 in the 12CO J = 2 → 1 line using the NANTEN2 Telescope had a spectral resolution of ~0.1 km s−1 and rms noise level of ~1.1 K per channel at an angular resolution of ~90″ (Fukui et al. 2018b). Furthermore, previous 13CO and C18O J = 2 → 1 observations with APEX had a spectral resolution of 0.3 km s−1 and a sensitivity of about ~0.5 K at an angular resolution of ~30″ covering a 2.2° × 0.7° region (see Arzoumanian et al. 2022). In comparison to both of these previous studies, we have at least 1.5 times higher spatial resolution, have better sensitivity, and map twice as large an area to cover the extended emission region. In addition, since we observe the higher excitation 13CO J = 3 → 2 lines, we also probe higher density gas (e.g. ncrit ~ 1 × 104 cm−3 at 10 K) directly participating in the star-forming activity.
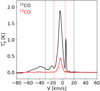 |
Fig. 3 Average of the 13CO (in red) and 12CO (in black) spectra towards the NGC 6334 extended filament. The vertical dotted lines indicate velocity ranges of [−30,+20] and [−15,+5] km s−1 in black and red, respectively. |
3 Results
3.1 CO emission morphology
Figure 3 presents the 13CO and 12CO J = 3→ 2 spectra in red and black, respectively, averaged over the extended NGC 6334 filament. Most of the 13CO emission is confined within the velocity range of −15 to +5 km s−1, while the 12CO emission is also observed at significantly blue-shifted velocities. In both lines the emission peaks around −4 km s−1, the systemic velocity of the gas in the main filament. In 13CO a less prominent peak is seen at around −9 km s−1 blended with the main component. Another emission peak is seen at a redder velocity of +7 km s−1 in both lines, which is associated with local molecular clouds (e.g. Russeil et al. 2017). Blue-shifted 12CO emission is found down to −60 km s−1 and has two peaks around −20 km s−1 and −40 km s−1 that do not have clear 13CO counterparts. The −15 to +5 km s−1 range, corresponding to the bulk of the emission in the 13CO line, is indicated by the dotted red lines; the −30 to +20 km s−1 range, corresponding to the bulk of the12CO emission, is indicated by the dotted black lines in Fig. 3. We used these velocity ranges to compute the moment 0 maps.
Figure 4 presents the 13CO (top panel) and 12CO (bottom panel) velocity integrated moment 0 maps of the extended NGC 6334 filament. The prominent features discussed in the text are also labelled in the top panel image. Also indicated in the figure are the OB stars from Persi & Tapia (2008) (red circles) and ATLASGAL clumps from Urquhart et al. (2018b) (green plus signs).
The morphology of the CO line emission shows that the NGC 6334 central filament has a spatially concentrated dense gas reservoir. In both CO lines the central filament is generally very bright and exhibits multiple bright emission spots. In areas that connect the central filament to the GM-24 region, the 13CO emission shows elongated and finger-like filamentary structures originating from the filament WF and spreading towards the south-west and north-west5. These features merge and reveal widespread emission in 12CO (see bottom panel). Some elongated finger-like (pillar-like) emission structures going northward and south-ward from the central filament are prominently seen in both lines. In the eastern region, however, the 13CO emission is tracing only the trunk of the extended filament, while 12CO exhibits a more extended emission morphology that connects NGC 6334 with the star-forming region NGC 6357 (l = 353.166°, b = 0.89°; see Fig. 1 in Russeil etal. 2017).
Most of the bright emission spots in the central filament correspond to the far-infrared (FIR) sources shown by the yellow markers in Fig. 4 (top panel). Numerous ATLASGAL 870 µm dust emission clumps are located in this region. One interesting feature of the emission north of the central filament is that the gas emission seems to exhibit a pinched morphology. We overplotted the position of the OB-type stars from Persi & Tapia (2008) on the moment 0 map of 12CO. A circle of radius 8 pc (0.25 deg at 1.7 kpc) centred on the dominant O6.5 star is drawn on the map to match the arc-like emission morphology observed towards the NGC 6334 central filament. It seems to perfectly match the morphological shape of the emission towards the north, indicating that the high-mass star is likely interacting with the gas in the central ridge. However, we also note that there are other OB stars, radio sources, and H II bubbles located around the ridge (see Fig. 1) that could have contributed to shaping the emission morphology of the central ridge.
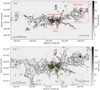 |
Fig. 4 Emission morphologies (moment 0 maps) towards the extended NGC 6334 filament. Top:13CO; bottom: 12CO. Contours are drawn at 7, 30, and 70 K km s−1 for 13CO and at 15, 50, 100, 150, and 200 K km s−1 for 12CO. Velocity ranges used for integrating the intensities are given in the bottom right corner of the maps. The dashed red boxes in the top image outline the central filament and the GM24 region. The various regions discussed in the text are labelled in red. The FIR sources I[N], I to V (corresponding to radio sources F to A; see Kraemer & Jackson 1999) are marked with yellow plus signs on the images. In the 12CO moment 0 map the OB star positions from Persi & Tapia (2008) are shown as red open dots. A circle is drawn centred at l = 351.317, b = 0.918, the position of the dominant O6.5 star, to match the arc-like emission morphology observed towards the NGC 6334 central filament. The green plus signs indicate the position of ATLASGAL sources in the NGC 6334 extended region (Urquhart et al. 2018b). |
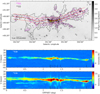 |
Fig. 5 Position-velocity maps toward the NGC 6334 extended region. Top:13CO (red) and 12CO (black) emission contours overlaid on the 870µm ATLASGAL dust emission (greyscale). The contour levels are the same as in Fig. 4. Middle and Bottom: position-velocity maps of 13CO and 12CO, respectively. The dotted red lines in the top image show the path along which the PV maps are constructed. The offsets are the projected path length along the galactic longitude from east to west along the strip. On the PV maps, the projected offset positions of the FIR sources (I[N], I to V from right to left) in the central filament and GM-24 region are indicated by the dotted black markers at the bottom. |
3.2 Gas velocity structure
3.2.1 Position-Velocity map
The middle and lower panels of Fig. 5 presents the position-velocity (PV) maps constructed for the emission within the stripe defined by the three red lines in the intensity map (top panel). The longitudinal extent of the PV maps is ~2.32 degrees. We find a filament ~80 pc in length with a well-connected and coherent velocity structure that has an average velocity of approximately −4.0 km s−1.
Since the 13CO line is mostly optically thin, it is tracing the higher column density gas regions along the NGC 6334 extended filament. High-velocity emission is not observed in 13CO. In the 12CO lines, since it is optically thicker, more diffuse extended emission features at intermediate to high velocities are visible that are not detected in 13CO. Most of the high-velocity emission is observed mainly from the FIR source along the central filament and GM-24 (indicated by the dashed black markers in Fig. 5). This high-velocity emission is most likely tracing outflows since it shows a clear correspondence with high-mass star-forming FIR clumps and/or cores embedded in the central ridge.
Gas emission at velocities of ~[−25, −15] km s−1 is observed at offsets from 0.3 to 1.3 deg. This emission is diffuse and exhibits no clear peaks in the PV map. The origin of this component is at present unknown. In lower excitation lines of CO, this velocity component is seen connected with the main filament (CO J = 2 → 1, 1 → 0 in Fukui et al. 2018b, and J = 2 → 1 in Arzoumanian et al. 2022).
Figure B.1 presents PV maps towards two selected slices averaged along the perpendicular direction to the central filament. Slices L1 and L2 indicate the same regions as MFS-cold and MFS-warm presented in Arzoumanian et al. 2022 (see Fig. 12 in that paper). We observe a V-shaped (or inverted) velocity structure along the L1 and L2 slices in higher J transitions of 13CO. In addition, we also present PV maps (Fig. B.1) towards six FIR sources in the central NGC 6334 ridge. Towards all the sources we observe similar V-shapes in the PV maps along the y-axis. While in FIR source I and II, the V-shape appears in both velocity directions, FIR sources III and IV exhibit inverted V-shapes. Arzoumanian et al. (2022) interpreted these V-shaped emission features in PV maps as matter flowing within a sheetlike structure compressed by a propagating shock front. We further investigate the velocity structure around H II regions in Sect. 4.1.2 to determine whether the shock compressions due to H II regions show similar velocity features in the molecular shells or rings around them.
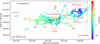 |
Fig. 6 Intensity-weighted velocity map (moment 1) of the 13CO emission towards the NGC 6334 extended filament. The labels are the same as in Fig. 4 |
3.2.2 Intensity weighted velocity map
Figure 6 presents the moment 1 map of the 13CO emission. We used a 7σ cutoff in integrated intensity to make the map. The velocity of the gas in the NGC 6334 extended filament shows primarily two components, one at −3.9 km s−1 and another at −9.2 km s−1. Figure 7 clearly illustrates the double-peaked distribution at these velocities. The −3.9 km s−1 velocity component reveals the coherent velocity structure of the extended filament, while the −9.2 km s−1 velocity component is mainly tracing gas around the GM-24 region. However, it also appears to be tracing ‘bridge’ structures. We see these features extending south from the FIR source I[N] and I and north-south from the central filament (from FIR sources IV and V; see Fig. 4). The widespread morphological existence of these two velocity components indicates that the molecular gas in NGC 6334 has at least two origins.
We also observe signs of velocity gradients in different regions. In the central filament, two bridge features are at bluer velocities compared to the trunk of the central ridge. In the central ridge itself, we observe a west to east velocity gradient with velocities becoming redder towards the east. Regions EF1 and EF2, and the SWF filament also show signs of velocity gradients along the filament. A velocity gradient towards the central FIR sources III from both east and west of the central filamentary ridge is seen, which has also been reported by Zernickel et al. (2013) HCO+ J = 3 → 2 line data and interpreted as a sign of global collapse.
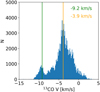 |
Fig. 7 Histogram of the 13CO velocities obtained from the moment 1 map. |
3.2.3 Multi-Gaussian fitting to the 13CO line cube
Given the complex velocity structure of the region, we also fit the 13CO line cube using the Gausspyplus package (Riener et al. 2019). Gausspyplus is an automated fitting routine developed and tested to fit complex spectral profiles with a high degree of accuracy that was used in the analysis of the Galactic Ring Survey (GRS) (Jackson et al. 2006) (see Riener et al. 2019 for more details). In this routine the spatial coherence is taken into account while fitting multiple Gaussian components. We applied a signal-to-noise ratio (S/N) of 3.0 to constrain the minimum value of 13CO peak intensity. Figure A.2 presents the number of Gaussian components fitted to the13 CO spectra within the NGC 6334 extended region. We find that to fit profiles of the brighter CO emission lines arising from the denser regions along the filaments require multiple Gaussian components to fit the line profiles.
Figure 8 (top panel) presents the resulting projected line-of-sight velocity components along the filament going from east to west in the longitudinal direction (hereafter called lv plots). The velocities within the PV-sliced region shown in Fig. 5 is presented in the bottom panel. The median velocities for each longitude bin are shown as dashed white contours. In general, the projected velocities decrease from the east of the mapped region to the western direction. Gas velocities in the east of the extended NGC 6334 region are redder (0–4 km s−1), while in the western region (near GM24) gas at bluer velocities (−3 to −12 km s−1) are found. The velocity gradient over the full filament length (~80 pc) is much smaller than 1 km s−1 pc−1, which also illustrates the velocity coherence of the filament.
Various features can be identified in the lv plots, for example smaller V-shapes, arch-like and semi-arch-like shapes, and semicircular shapes highlighting the complex gas velocity structure in the region. Many of these features are possibly related to the feedback from the large number of H II regions located in the region. Complex velocity features around the H II regions are seen in the lv and bv plots, which are discussed further in Sect. 4.1.2. We emphasize here that the amount of details of the velocity information one can see in the lv plot, where velocities are obtained from multi-Gaussian fit to the spectra, is superior to the commonly used pv-diagram (see Fig. 9).
The intensity and velocity along the dense ridge of the NGC 6334 extended filament show fluctuations, or ‘wiggles’, at smaller spatial scales and also some broader V-shaped features (see Fig. 8, bottom panel). Similar oscillatory velocity fluctuations are also observed towards other Galactic filaments, for example in 13CO(1→0) observations towards the California nebula molecular filament (Guo et al. 2021).
Three broad V-shapes (or inverted V-shapes) in the lv plot are indicated by the vertical dotted green lines in the figure at longitudes 352.1, 351.3, and 350.5 degrees. The base lengths of these V-shapes are broader than 3 pc. The V-shape around l = 352.1° is located in the eastern filament (EF1). The other two correspond to the central filament (towards FIR source III) and the GM-24 region, respectively. In the GM-24 region, a closer look at the map shows that the velocity structure is rather complex, and the V-shape only appears in the median velocity contour. Towards the eastern filament (EF1) and the central filament, we also observe a similar V-shape in intensity variation, but phase-shifted with respect to the velocity structure. Typically, the V-shapes in the position–velocity diagrams indicate gas compression (due to collision or due to H I or H II bubbles) (e.g. Inoue & Fukui 2013; Arzoumanian et al. 2022) or a global infall or collapse if observed with phase-shifted intensity and velocity gradients (e.g. Hacar & Tafalla 2011; Zhou et al. 2023). We discuss these features in Sect. 5.2 in conjunction with the observed CO emission morphologies in the channel maps.
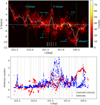 |
Fig. 8 Velocity structure of the NGC 6334 extended region. Top: 2D histogram plot of 13CO velocity components in the full observed region projected along the longitudinal direction from east to west. The bin sizes are 300 × 300. The colour bar shows the counts. The dotted white line follows the median velocities at a given longitude. The longitude of the six FIR sources I[N], I, II, III, IV, and V, and also the GM24 region is indicated by the vertical dotted white markers. Also shown are the positions of the V-shaped velocity gradients (in cyan). Bottom: velocity and intensity variation along the longitude within the PV-sliced region in Fig. 5. The values on the y-axis are arbitrary numbers normalized by the mean values. The vertical black dotted lines indicate the longitudinal positions of the ATLASGAL clumps in the same region. |
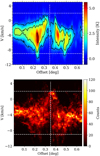 |
Fig. 9 PV map (top panel) and lv map (bottom panel) towards the NGC 6334 central region (path along l = 351.0° to 351.65° at b = 0.67°). The PV map uses intensity weighting for estimating the velocities, while the lv map is made using Gaussian velocity components of13 CO spectra. |
3.3 Channel maps
Figures 10 and 11 present channel maps of 13CO and 12CO, respectively, in the velocity range −15 to +5 km s−1, with steps of 2 km s−1. The dotted circles in magenta indicate the H II regions and corresponding bubbles from Anderson et al. (2014). In addition, we have drawn three vertical dotted lines in black at longitudes 352.1°, 351.3°, and 350.5° in different sub-plots. These are the positions of the V-shaped features observed in the longitude–velocity plot of Fig. 8. The text labels for various emission features (as in Fig. 4) are also indicated in the channel maps. Also presented in Figs. C.1 to C.3 are the zoomed velocity channel maps towards the central filament, the GM-24 region and the G352 region.
The channel maps allow a more detailed velocity-resolved view of the gas emission morphology. For example, at velocities −10 to −5 km s−1 in both CO lines, the eastern (near I(N) and I) and western (near IV and V) parts of the NGC 6334 central filament show bright emission with no connecting ridge structure indicating that from −10 to −5 km s−1, the two sides are disconnected. We note that these velocities are blue-shifted with respect to the average filament velocity of −3.9 km s−1. From −5, +3 km s−1, we start seeing emission features connecting the two sides of the central filament. Only at velocities between −3 and +1 km s−1 is the connecting ridge bright in both CO lines. One notable feature is that at these velocities and beyond on the redder side of the emission, the bright emission feature from FIR source V located in the western part of the central filament is no longer visible.
Two parallel emission features, that we named the bridges in the moment 0 map in Fig. 6, extend south from the central ridge at velocities from −15 to −3 km s−1 in 13CO. Both features are clearly visible and appear more extended in 12CO. Towards these bridge features, we observe CO emission in both the −3.9 and −9.2 km s−1 velocity components (see Fig. 7). The spatial coexistence of the two gas components gives hints to a possible collision or a merger of the clouds in the central filament. The eastern bridge extends south from FIR sources I[N] and I, and is more apparent at velocities from −9 to −3 km s−1. The western bridge extends south from FIR sources IV and V and is also visible at redder velocities up to −1 km s−1 in 12CO. The latter emission feature also extends northward from source V up to latitude of ~1 deg towards the north-west.
The GM24 region presents a clear example of bubbles within bubbles (see Fig. 1). In the channel maps this region is mostly bright in the −13 to −7 km s−1 velocity range. The connecting filaments (WF, SWF, SF1, SF2) located to the west of the central filament however are visible at velocities from −7 to −1 km s−1.
Regions located east of the central filament (EF1, EF2, EF3, and G352.5) are seen at velocities higher than −5 km s−1. The 13CO emission at this side of the filament is noticeably weaker. A bright elongated filamentary feature at around l = 352.0 deg, b =0.7 deg is observed both in 13CO and 12CO at the velocities from −1 to +5 km s−1. Emission at these velocities is also bright further east close to the NGC 6357 region at l = 352.5 deg and b = 0.8 deg. Finally, to the south of the central filament (<0.25 deg), there is little or no emission at velocities between −15 and +5 km s−1.
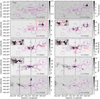 |
Fig. 10 Channel maps of 13CO emission in the velocity range −15 to +5 km s−1 with steps of 2 km s−1. The magenta dashed circles indicate H II bubbles from Anderson et al. (2014). the vertical black lines indicate the positions of the broad V-shapes observed in the lv plot in Fig. 8. The labels indicating the various emission features in the maps are the same as in Fig. 4. Some optical H II regions (as in Fig. 1) discussed in the text are also labelled in the top left channel map for reference. For a clearer view of the channel maps, zoomed-in maps towards the central filaments, GM-24 and G352, are presented in Figs. C.1 to C.3. |
4 Analysis
4.1 Impact of H II regions in shaping the molecular gas structure
To study the impact of H II regions on the surrounding molecular gas and its velocity structure, we first visually inspected the gas emission morphology towards the H II regions located in the extended NGC 6334 region (see Fig. 1). For most of the H II regions a molecular emission counterpart was detected. Average13 CO velocities of the molecular gas towards the H II regions are presented in Table 1. The velocities were obtained using aperture extraction from the Gaussian fit velocities of 13CO using radii of the H II regions. We observed a variety of emission morphologies around the H II regions, such as bubbles exhibiting ring-like and arc-like shapes and/or central holes in the channel maps. Figures D.1 and D.2 show maps of 13CO emission towards the H II regions.
In the NGC 6334 central filament, eight H II regions are located along the ridge, most of which are associated with FIR sources (see Figs. 10 and 11). Channel maps only towards the central region are also presented in Fig. C.1. H II region G351.348+0.593 is found in the south of the main ridge and G351.383+0.737 (GUM63/64) north to the ridge above sources I[N] and I. The central part of the ridge is disconnected up to bluer velocities of −5 km s−1 and exhibits a connected filament only at redder velocities of −5 km s−1 (see Fig. 10). We note that our identification of a broad V-shape in the lv plot is associated with this region (see Fig. 9). We also find pillar-like structures above FIR source II (associated with GUM63/64C) and towards IV, observable both in 13CO and 12CO (see Fig. C.1). Such pillars are identified in many PDR and H II regions, and thought to originate from the expansion of H II regions into a turbulent, non-homogeneous medium (e.g. Tremblin et al. 2013).
To the west of the central filament, two optical H II regions, G350.995+0.654 (GUM61) and G351.130+0.449 (GUM62), are located south of the FIR sources IV and V. These regions are indicated and labelled in some panels in Fig. 10. In both CO channel maps in Figs. 10 and 11, we observe gas emission mostly at their edges, but no emission is seen in the centre, which indicates that these H II bubbles have already cleared out the gas around them and are at evolved stages. At velocities −1 to +3 km s−1, the emission at the southern edge of H II region G350.710+00.641 is bright in both 13CO and 12CO. In the velocity integrated intensity maps (Fig. 4), this emission clearly appears filamentary, extending from source V to the southwest as a structure we named the south-west filament (SWF). These observations illustrate that H II shells could indeed play an important role in forming and shaping the morphology of filamentary cloud structures.
At the intersection of the H II regions G350.710+0.641 and G350.995+0.654 (GUM61), two smaller H II regions (G350.871+0.763 and G350.889+0.728) are seen. This is the region in which GM-24 southern filament 1 (GM24 SF1) departs westward from the west filament (WF). The filamentary emissions are clearly seen at velocities −5 to −1 km s−1 in the channel maps (Figs. 10 and 11).
The GM24 region is a clear case of bubbles within bubbles towards which we observe evidence of bubbles and shells interacting with the gas around them and shaping the emission structure in the region. One example of such an interaction is seen where we observe two arc-like gas layers, one facing south and the other to the north at velocities −13 to −11 km s−1 surrounding the central bright emission spot in GUM1-24 (Figs. 10 and 11; see zoomed-in maps of this region in Fig. C.2). These arch-like features correspond closely to the shells of the H II regions G350.710+00.641 and G350.675+00.832 in the south and G350.401+01.037 in the north. At velocities between −9 and −7 km s−1, we observe gas emission in a shell structure centred slightly east to GUM1-24. This shell structure corresponds to the H II region G351.130+0.449, located east of the compact radio source G350.50+0.95 (Russeil et al. 2016). In addition, we also find this shell-like gas emission structure confined within the radius drawn for H II bubble G350.594+1.149. Two HII regions G350.710+0.641 and G350.240+0.654 also appear to act on the gas from the south in GM-24 region.
We see spiral and arch-like filamentary gas emission at velocities from −7 to −3 km s−1 that is associated with the GM24-SF1 and GM24-SF2 filaments (see also zoomed-in maps in Fig. C.2), connecting to the western filament (WF) and extending from south of the GM-24. At velocities from −5 to −3 km s−1, these filaments are more clearly visible in the channel maps (Figs. 10 and 11), more so in 12CO than in 13CO emission. These emission features seem to intersect at the far west at (l, b) = (350.4 deg, 0.8 deg). We note here that these velocity ranges are slightly bluer than, but similar to, the velocity of the main filamentary structure in the NGC 6334 region. Based on the observed gas distribution of these filaments in the channel maps we suggest that the gas structure is shaped by the group H II regions (G350.594+01.149, G350.617+00.984, G350.710+00.641, G350.995+00.654) (see Figs. 10, 11, and the zoomed-in maps in Fig. C.2).
East of the central filament, at around l = 351.5 deg, and at a similar latitude of the central filament, we find multiple H II regions. In particular four H II regions (G351.651+0.510, G351.676+0.610, G351.693+0.671, G351.766+0.492) appear to be connected to the gas at velocities from −9 to +1 km s−1 (Figs. 10 and 11). The emission of 13CO at this side of the filament is noticeably weaker. A bright elongated filamentary feature at around l = 352.0 deg, b = 0.7 deg is observed both in 13CO and 12CO at velocities of −1 to +5 km s−1. This is the same region (EF1) towards which we also observe the inverted V-shape in the lv plot (see Fig. 8), whose peak is at a longitude of ~352.1 deg. The zoomed-in channel maps towards this region are presented in Fig. C.3.
4.1.1 Radial profile and contrast parameter
To perform an unbiased search for shell-like and ring-like molecular structures around the H II regions, we plotted the azimuthally averaged radial13 CO intensity profile of the H II regions (using a velocity range of −15 to +5 km s−1). For this we adopted the position and radius of the H II regions from Anderson et al. (2014) (Cols. 3–5 in Table 1) and plotted the13 CO intensity profile up to twice these radii. The positions and radii were obtained by encircling the WISE mid-infrared emission of the H II regions (see Anderson et al. 2014 for more details). In Fig. 12 we present, as an example, the radial intensity profile towards H II region G350.482+0.951 associated with GUM1-24. This region exhibits a clear signature of a shell- or ring-like structure. In Figs. E.1–E.3, we present profiles of the 13CO emission towards all the H II regions located in NGC 6334 extended region. We individually inspect the emission morphology towards the regions (Figs. D.1 and D.2) to interpret the radial profiles. We find two general categories of the intensity profiles plotted for the full velocity range of −15 to +5 km s−1.
The first category includes H II regions (22 of 42) that exhibit little emission or a flat emission profile towards their central regions and an increasing intensity profile outwards with respect to the H II radii. Some of these sources clearly exhibit a bumpy emission feature at corresponding H II radii (e.g. G350.482+0.951). In Figs. E.1 and E.2 the radial profiles of these H II regions are presented. The second category of the H II regions (15 of 42) exhibits centrally peaked emission within the adopted H II radii and a decreasing intensity profile outwards. A few H II regions (5 of 42) do not fall into either of these categories; they exhibit flat profiles up to twice the adopted radii and only exhibit diffuse 13CO emission. The intensity profiles of these H II regions are presented in Fig. E.3.
H II regions with little or flat profile emission towards the centre and an increasing intensity profile outwards are thought to be at later evolutionary stages since they appear to have cleared out the molecular gas from the centre. More than half of the H II regions (14/22) with an increasing intensity profile exhibit a bumpy feature or an intensity maximum at or near their radii (Figs. E.1. and E.2), indicating a molecular shell or ring structure.
On the other hand, centrally peaked 13CO emission towards the H II regions likely reflects an early evolutionary stage. However, it is also possible that these sources have line-of-sight contamination that caused their profiles to appear centrally peaked. To investigate this we explored the 13CO line profiles for emission averaged over different velocity ranges within −15 and +5 km s−1 with steps of 5 km s−1. Among the 20 H II regions that show either centrally peaked and decreasing or flat profiles for emission averaged over the full −15 to +5 km s−1 range, we find that the profiles of 14 of them either increase outwards or show a bumpy feature when plotted for different velocity ranges. These profiles are also shown in Fig. E.3. In total, we find 36 of 42 H II regions (86%) that show the signature of molecular gas having been cleared from their centre and that exhibit an increasing intensity profile outwards or a shell- or ring-like molecular structure around them.
These characteristics of molecular line emission features are noted in Col. 8 of Table 1. Centrally peaked and decreasing intensity profiles are denoted ‘CP’, increasing profiles are denoted ‘I’, shell-like or ring-like structures are dentoed ‘S’, and sources with flat profiles are denoted ‘F’. The four 5 km s−1 wide velocity ranges within −15 to +5 km s−1 for which these structures are found are also labelled V1 to V4.
We also estimated the sizes of the 13CO emission associated with the H II regions from the13CO line profiles. For H II regions with clearly decreasing or increasing radial profiles, we obtained the sizes at which the intensity is 50% of the peak emission (indicated by the vertical green lines in Figs. E.1–E.3). For H II regions exhibiting a shell- or ring-like morphology, we adopted the radii where these bumpy or shell-like features are observed. In Col. 6 of Table 1, the sizes estimated from the molecular line emission associated with the H II regions are presented. In general there is a tentative agreement between the sizes that we estimated from the13 CO emission profile and the sizes reported by Anderson et al. (2014). The mean and standard deviation of the difference in radius are ~15 and ~40% with respect to the radius from Anderson et al. (2014). The intensity profiles of H II regions with a shell- or ring-like structure begins to increase at a certain inner radius, which varies from source to source (see Fig. E.1). We find that the inner radii can have values as small as ~40% of the shell radii.
We employ a contrast measurement method that quantifies the enhancement of the molecular line intensities at the H II region-bubble radii. To do so, we define a contrast parameter C as

where WR1 and WR2 give the sum of the integrated molecular line intensities within the radii of sizes R1 and R2, respectively. R1 represents the size of the inner ring and R2 represents the size of the outer ring. The significance of the parameter for a homogeneous medium is straightforward and proportional to the ratio of the area of the ring to the area of the outer radius considered.
Column 9 of Table 1 presents the13 CO contrast parameter values for H II regions computed from the velocity range −15 to +5 km s−1 for radius ranges of 0.6-1.2 times the radius. For H II regions with shell-like intensity profiles, we find that the inner radii at which the intensity starts increasing is up to 40% of the shell radii. In addition, since H II regions and bubbles are known to be eccentric (Churchwell et al. 2007), the choices of radii between 0.6 R–1.2 R to measure the contrast parameter incorporate the eccentric nature of the bubbles with eccentricity values of 0.86–1. Contrast parameter values larger than the expected value of 0.75 for the radii considered here are presented in Col. 9 of Table 1. At these velocity ranges and radii, 21 H II regions show a contrast parameter higher than 0.75. However, at segmented velocity ranges from −15 to +5 km s−1 with steps of 5 km s−1, we already found that the majority of the H II regions show centrally clear or flat profiles that either increase outward or show a bumpy feature at or near the corresponding radii. Therefore, we measured the contrast parameter for velocity ranges from −15 to +5 km s−1 with steps of 5 km s−1. The maximum value of the contrast parameter (Cmax) in these velocity ranges are given in Col. 10 of Table 1. In total, using the contrast measurement method we identify 34 of 42 H II regions (81%) that exhibit intensity enhancement of the molecular emission at the H II radii.
We performed a two-sample ks-test between contrast parameters (Cmax) measured for the H II regions and contrast parameters measured towards 1000 randomly created shells and rings in the mapped region. The sizes of these randomly created rings range from 20″ to 700″, similar to the sizes of the H II regions. The ks-test statistics (0.25) and p-value (0.015) suggest that the sample of H II regions is indeed distinct from that representing the randomly created ring structures. Figure 13 presents the empirical cumulative distribution function (eCDF), which clearly shows that H II regions have a higher probability of getting higher contrast values. Even though most of the H II regions in our sample show a contrast parameter above the expected value, it is wise to explore the significance of that parameter. To do so, we exploited the contrast values derived for the randomly sampled shells and rings and fit a Gaussian distribution with mean and standard deviation of 0.78 and 0.09, respectively (Fig. E.4). Then we defined a contrast threshold above 1σ from the mean, which is 0.87. Fourteen H II regions show contrast values above the 1σ threshold in at least one velocity range (−15 to +5 with steps of 5 km s−1) for shell-ring radii of 0.6–1.2 times the H II radius. We repeated the analysis considering smaller shell-ring sizes (0.6R–1.0R and 0.8R–1.2R). In total, we find that 22 H II regions (52%) show a contrast parameter above the 1σ threshold in at least one radius and velocity range.
There are caveats of using the contrast method. This method may not provide meaningful results for H II regions that are too young to have created a shell- or ring-like structure and are still embedded in their dense natal gas, or for regions that exhibit a complex morphology (e.g. shaped by a champagne flow). In addition, both the radial profile and the contrast method applied in this study cannot distinguish the true morphological features if a shell has a full-ring, half-ring, or has a clumpy edge. To study the morphology in detail, 2D or 3D emission maps (channel maps) have to be examined. For larger shell–ring sizes, the radii at which the contrast is being measured should be carefully selected. Despite the caveats, the contrast method in conjunction with radial profiles can be a useful tool to study H II bubbles and regions, in particular to search for shell-like structures, using large-scale Galactic molecular line and continuum surveys.
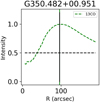 |
Fig. 12 Azimuthally averaged 13CO radial intensity profile for the H II region G350.482+0.951 for the velocity range [−15, +5] km s−1. The intensities are normalized by the peak value. The vertical black line indicate the radius of the H II region from Anderson et al. (2014). |
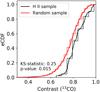 |
Fig. 13 Empirical cumulative distribution function (eCDF) of the contrast values measured for the H II regions (black) and 1000 randomly created rings (red) in the mapped region. The two sample ks-test results are also shown. |
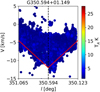 |
Fig. 14 lv plot towards the H II region G350.594+1.149. The observed V-shaped emission structure is indicated by the red lines. |
4.1.2 Longitude-velocity and latitude-velocity plots towards H II regions
In Figs. F.1–F.5 we present longitude-velocity (lv) and latitude-velocity (bv) plots for the H II sources. For the plots, we used the Gaussian fitted 13CO velocities instead of the commonly used intensity averaged pv-plot. We again used the radius range of ±1.2R in both longitudinal and latitudinal direction, where R is the H II region radius. To investigate whether we observe higher intensities around the H II regions, we made the plots with intensity colour wedges. Towards some H II regions (12/42) we find that the velocity structure has to follow a (partial) elliptical shape either in the lv or bv plots. For these we also present the approximate expansion velocities inferred from visually fitted ellipses in Table F.1. We also observe broader V-shaped velocity features, with open cavities or with filled emission. An example of the lv plot towards H II region G350.594+1.149 is shown in Fig. 14 in which the observed V-shaped emission structure is also indicated by the red lines. Towards 15 H II regions (in lv or bv plots), we observed such features (Figs. F.1–F.5). In particular these features were observed towards the sources located in and around the filaments (see Fig. F.6). We interpret these velocity structures as representing shock-compressed gas layers driven by H II regions in the filament or located nearby. To further investigate the features around these H II regions, we made pv maps along different slices (L3–L12) shown in F.6. These pv maps are constructed along the perpendicular direction of the filament axis or the clumpy regions located at the edges of the H II regions. In all slices (except for L7 and L12) we observe a V-shaped emission velocity feature. In slices L7 and L12, we only observe a velocity gradient. Overall the lv and bv plots highlight the complex velocity structure around the H II regions and in particular their role in shaping the gas velocity structure around them. These results further illustrate multiple sites of gas compression due to H II regions in the extended NGC 6334 region.
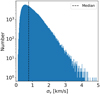 |
Fig. 15 Histogram of velocity dispersion (σv) values determined from the Gaussian fit to the 13CO line profiles. |
4.2 Velocity dispersion in NGC 6334 extended region
Figure 15 presents a histogram of the velocity dispersion (σv) determined from the Gaussian fit to the 13CO line profiles towards the mapped region. The mean and median values of the distribution are 0.9 and 0.8 km s−1, respectively. We then made maps for different velocity dispersion ranges σv ≥ 2, 2.0 > σv ≥ 0.9 and 0.9 ≤ σv km s−1 (from top to bottom in Fig. 16). The gas with velocity dispersions lower than 0.9 km s−1 (mean value) represents the extended regions. At an increased dispersion level from 0.9 to 2 km s−1, the emission mostly corresponds to the dense ridges along the filament, while three regions (EF1, central ridge, and GM24-SF2) exhibit velocity dispersions higher than 2 km s−1. Except towards a few H II regions, we do not observe significantly higher velocity dispersions associated with the H II shells. This could mean that H II regions play a minor role in injecting turbulence to the large-scale gas distribution. In the NGC 6334 extended region we found that the velocity dispersion is well correlated with the dense gas structure along the filament. This indicates that the origin of the velocity dispersion is likely related to the formation of the filaments themselves. The large values of dispersion towards the NGC 6334 central ridge and filament EF1, σv ≥ 2, may reflect the global collapse of gas onto the filaments. Both of these regions have a broad V-shaped velocity structure in the lv plot, which is discussed in Sect. 5.2.
5 Discussion
5.1 Velocity coherence and fluctuations
The NGC 6334 filamentary structure was studied in the lower excitation lines of CO by Arzoumanian et al. (2022). Based on their position-velocity map, these authors reported a ~50 pc velocity coherent structure between l = 350.4° and 352.6°. In this study, with the higher resolution data and improved method for creating position-velocity maps by following the dense gas ridge along the filament, we investigated the velocity structure in the NGC 6334 extended region (l = 350.15° to 352.65°; see Sect. 3.2). We found that the extent of the filament in which we observed the velocity coherent structure is ~80 pc in length, and thus longer than previously thought. The velocity gradient along the entire filament (~80 pc) is much smaller than 1 km s−1 pc−1, which quantitatively illustrates its velocity coherency. Such coherency in large-scale structures is also found in the simulations of galactic filaments (e.g. Duarte-Cabral & Dobbs 2016; Smith et al. 2020). In a recent review of the filamentary ISM, Hacar et al. (2023) suggest that velocity coherency could simply be a necessary feature of survival of the large filaments since larger gradients would otherwise lead to their rapid destruction.
We also observed smaller scale velocity and intensity fluctuations (wiggles) along the filament (see Sect. 3.2 and Fig. 8). These fluctuations or oscillatory features in the velocity centroid and intensity (with phase-shift) are thought to trace core-forming flows or local density enhancement in the filament (e.g. Hacar & Tafalla 2011; Guo et al. 2021; Henshaw et al. 2020).
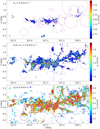 |
Fig. 16 Velocity dispersion measured from 13CO Gaussian fit. Dispersion velocity ranges are presented in the top left corner of each plot. Also shown are the H II sources from the catalogue of Anderson et al. (2014). |
5.2 Multiple gas compression, global collapse, and infall
We studied the localized and the large-scale velocity structure of the NGC 6334 filament using position velocity diagrams (see Sect. 3.2). In addition to the commonly used position-velocity plots, which are intensity weighted, we used longitude or latitude velocity (lv or bv) plots using the Gaussian fitted velocities from 13CO line profiles. We investigated the velocity structure towards the FIR sources in the central filament and also towards the H II sources located in the extended region. Towards all the FIR sources we observed V-shaped (or inverted V-shaped) velocity structures latitude-velocity plots (see Fig. B.1). Towards the H II regions the lv and bv plots exhibited a variety of complex velocity features (see Figs. F.1–F.5). A more common feature is again the V-shaped (inverted V-shaped) velocity structure particularly towards sources that are located in or adjacent to the filament. The V-shaped velocity features are thought to trace gas compression due to propagating shock fronts or colliding flows (e.g. Inoue & Fukui 2013; Fukui et al. 2018b; Arzoumanian et al. 2022). The formation of molecular clouds after multiple compressions in interacting shells or bubbles has been proposed in theoretical studies (e.g. Inutsuka et al. 2015). Our observations of multiple gas compression features observed towards H II shells or radii, and towards FIR sources in the central ridge support this scenario.
On a larger scale, we identified broader V-shaped velocity structures towards the NGC 6334 central filament, the GM-24 region, and EF 1 (the G352 region) in the median velocity contours projected along the longitude direction (see Fig. 8 in Sect. 3.2). We discuss these three regions individually here.
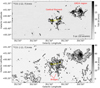 |
Fig. 17 Maps of 13CO (top) and 12CO (bottom) integrated over the velocity range from −12 to −7 km s−1. The labels and markers are the same as in Fig. 4. |
5.2.1 NGC 6334 central filament
The NGC 6334 central filament is approximately 10 pc long and runs almost parallel to the Galactic plane (see Fig. 4). Three distinct properties of the gas velocity structure are observed towards this region.
First, the east and west side of the central ridge exhibit bright emission at blue-shifted velocities with respect to the average velocity of the NGC 6334 central filament −3.9 km s−1. This is evident from the channel maps presented in Figs. 10 and 11. The case for a global collapse scenario has already been made by Zernickel et al. (2013) for this filament. Our observations provide further evidence of the globally collapsing gas in the NGC 6334 central ridge.
Second, we observed a broad inverted V-shaped structure in the lv plot (see Fig. 8). The base length of the V-shape is ~6 pc (0.2 deg at 1.7 kpc) and it is located between FIR sources II and IV. Additionally, we also observe the intensity fluctuation phase-shifted with respect to the observed velocity structure (Fig. 8, bottom panel). Such V-shapes indicate gas compression (due to collision or due to H I of H II bubbles) (e.g. Inoue & Fukui 2013; Arzoumanian et al. 2022) or a global infall or collapse if observed with phase-shifted intensity and velocity gradients (e.g. Hacar & Tafalla 2011; Zhou et al. 2023). The velocity gradient inferred from the arms of the V-shape is 1.3 km s−1 pc−1. Assuming the observed velocity gradient is due to free fall and using the extension of the V-shape (R~3 pc), we estimate a kinetic mass (M ≈ 2R3 ∇V2/G; see Eq. (1) in Zhou et al. 2023) of the central filament of ~2 × 10⁴ M⊙. The mass estimate from the free fall assumption is consistent with the reports of line mass per unit length of 1000 M⊙ pc−1 towards the central NGC 6334 filament by André et al. (2016).
Third, towards the two longitudinal ends of the central filament, we observe two bridge structures (see Fig. 17). The gas emission in the bridges correspond to the bluer velocity component (−9.2 km s−1) shown in Fig. 7. From 12CO and13 CO emission properties, it is clear that these are prominent dense gas structures, filamentary in nature, and running almost perpendicular to the central ridge of the main filament. The same gas velocity component is also associated with the GM-24 region. From the central ridge, the eastern bridge feature in 12CO (3−2) emission extends approximately 7 pc to the south, while the western bridge is about 15 pc long extending towards the south and north passing from FIR source V. The south extension of the west bridge from source V is ~8 pc. Along the central ridge the −3.9 km s−1 and the −9.2 km s−1 velocity components coexist spatially. This hints at mixing of the gas either due to collision or a merger of the clouds.
Fukui et al. (2018b) presented a cloud-cloud collision scenario in which the −20 km s−1 filamentary cloud is in collision with the NGC 6334 filament. We also observe at velocities [−25, −15] km s−1 a feature in 12CO emission, but not in 13CO. The emission morphology presented in Fig. 18 at this velocity range runs north-east to the central filament (with reference to the source I[N]). This emission region extends from (351.5 deg, 0.8 deg) to (352.2 deg, 0.5 deg). We refer to this as the northern filament and have labelled it ‘NGC 6334-NF’ in the figure.
This emission feature is also detected in CO (2−1) and CO (1−0) and is connected in the position velocity map with the central NGC 6334 filament (see Fukui et al. 2018b; Arzoumanian et al. 2022). The detection of higher excitation J = 3−2 lines of CO in this work indeed indicates that it also contains denser gas, but likely at quiescent phase since no ATLASGAL clumps are detected towards this region. According to Fukui et al. (2018b), cloud-cloud collision scenario explains the observations of the bridge features. In addition they also postulate that the cloud collision is happening at different locations at different timescales, and therefore is giving rise to the different evolutionary phases of the NGC 6334 extended filament from west to east. The GM-24 region located in the west is in an evolved phase, the central ridge is in an active phase of star formation, and the filament to the east (G352 region) is in a quiescent phase. We suggest that the spatial and kinematic connection of the NGC 6334-NF filament and the bridge features with the main gas velocity structure should be considered in explaining star formation in the NGC 6334 filamentary complex.
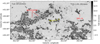 |
Fig. 18 Map of 12CO integrated emission integrated over the velocity range from −25 to −15 km s−1 the contour line represening the 5σ level. The emission north to the NGC 6334 central region is the northern filament (NF). The yellow plus signs denote the FIR-sources (I[N], I to V from east to west) in the central filament. |
5.2.2 GM-24 region
A broad inverted V-shape is observed towards the GM-24 region in the median velocity contour in the lv plot (see Fig. 8). However, the GM-24 region contains gas emission at both −3.9 and −9.2 km s−1. Therefore, the broad V-shape in the median velocity contours shown in Fig. 8 does not exactly illustrate the velocity structure. Fukui et al. (2018a) suggested a cloud-cloud collision scenario towards this region based on the complementary distribution of gas emission at two velocities (−10 and −6 km s−1) and the V-shape observed in the position-velocity map of 12CO 2-1 at a spatial resolution of 90″. Our LAsMA observations with 20″ spatial resolution do not confirm the complementary distribution of the gas. We find that the observed gas emission morphology and velocity structure towards the GM-24 region can be explained by the multiple H II bubbles and shelllike structures. In addition, we observe that the larger bubbles located south to the GM-24 region are shaping the filamentary gas emission structure.
5.2.3 Eastern filament (EF1): a hub-filament in formation
Filament EF1 is located at around l = 352 deg and b = 0.7 deg (see Figs. 6 and C.3). The filament corresponds to the dark lane observed in the infrared three-colour map in Fig. 1 caused by dust absorption. In addition, Arzoumanian et al. (2022) have reported velocity coherent filamentary structure (VCF47) towards this filament.
In the longitude velocity plots, we observe a broad V-shape towards this filament. These velocity fluctuations are accompanied by the intensity fluctuations with phase-shift (Fig. 8, bottom panel). The velocity gradient is also visible in the moment 1 map of 13CO (Fig. F.7). We suggest that this is consistent with the global collapse scenario where gas is infalling towards the filament EF1. This filament harbours a few ATLASGAL clumps (see Fig. C.3). The velocity gradient inferred from the arms of the V-shape is 1.3 km s−1 pc−1. Assuming a free fall velocity corresponding to the observed velocity gradient and extension of V-shape (R~2 pc), we estimate that the kinetic mass (≈2R3∇V2/G) of the filament ~5 × 10³ M⊙. The channel maps in the [+1, +5] km s−1 also show multiple gas streams that are more clearly visible in 12CO (Fig. C.3). The global infall and filamentary gas streams in EF1 indicate that this region is a hub-filament system in formation.
5.3 Supersonic velocity dispersion
We observed supersonic dispersion velocities along the dense gas ridge in NGC 6334 filament. At the spatial resolution of our observations (beam size of 20″) the Mach number, corresponding to a value of σv from 0.9 to 3.0 km s−1, ranges from 3 to 11, values inferred from the sound speed at an average temperature of 20 K. Supersonic velocity dispersions are commonly observed towards giant filaments (see review by Hacar et al. 2023). Theories on the origin of the velocity dispersion in molecular clouds and filaments are under intense discussion both in theoretical and observational studies if it reflects the gravitational or turbulent origin (e.g. Ballesteros-Paredes et al. 2011; Heitsch 2013; Arzoumanian et al. 2013; Smith et al. 2016; Clarke et al. 2017; Mattern et al. 2018; Xu et al. 2019; Vázquez-Semadeni et al. 2019; Hacar et al. 2023).
Observationally, it is clear that determinations of velocity dispersions depend on the spatial resolution. Resolved clouds and filaments seem to exhibit dispersions close to the sonic speed (e.g. Hacar & Tafalla 2011; Arzoumanian et al. 2013). In NGC 6334 itself, high-resolution observations with ALMA have revealed sub-sonic and transonic velocity dispersions in filaments and cores (NGC 6334S: Li et al. 2020, NGC 6334 I[N] and I: Sadaghiani et al. 2020). Hacar et al. (2023) investigated relations between velocity dispersion, filament length, and line mass, and showed that these scaling relations are followed by various types of filaments, which indicates that at larger scales non-thermal motions govern the gas dynamics. Determining whether the non-thermal motions originate from a turbulence cascade, core forming flows in the filament, global gravitational collapse, or cloud collisions requires further investigation.
5.4 Role of H II regions in the star formation processes in the NGC 6334 extended region
Various feedback processes act upon molecular clouds, providing mechanical and radiative energy input. Supernova explosions of dying high-mass stars (>8M⊙), stellar winds, stellar jets, and outflows provide mechanical feedback, while ionizing and non-ionizing radiation provide radiative energy inputs (Klessen & Glover 2016). Towards the NGC 6334 region, only one supernova remnant (G351.7+0.8) has been detected (Green 2019), which is located north-east of the central filament. However, based on optical extinction data, the distance of this supernova remnant was found to be 3.4 kpc (Wang et al. 2020), twice the accepted distance to NGC 6334 (~1.7 kpc; Russeil et al. 2012). A large number of OB stars and the H II regions and bubbles created by them drive the feedback in the NGC 6334 extended region.
As shown in Fig. 1, OB stars are clustered in the GM-24 region, while they are found in association in the NGC 6334 central region (see Russeil et al. 2020). A total of 42 H II regions and bubbles are found in the extended region that are visually identified in the mid-infrared with varying sizes from 0.2 to 12 pc (Anderson et al. 2014). At least eight H II regions, associated with present star formation, are found in and around the NGC 6334 central ridge (see Persi & Tapia 2008). The GM-24 region has bubbles within bubbles (see Fig. 1). Only a few H II regions, mostly of smaller size, are found towards the eastern filaments (near EF1, EF2, and G352.5; see Figs. 1 and 10). Almost all of the 42 H II regions from Anderson et al. (2014) (40 of 42) show gas velocities derived from13 CO that are consistent with the velocity of the bulk gas emission (see Table 1). This confirms that they are indeed part of the NGC 6334 region. From a visual inspection of the channel maps of the CO emission structure around the H II regions also using quantitative methods, we find that a significant fraction (>80%) of H II regions have an impact on the surrounding gas; ‘impact’ here either means clear shell-like or arc-like structures in emission morphology and/or high-contrast values in the CO intensities at bubble edges. Visually, clear signatures of H II bubbles interacting with the filamentary structure are seen towards GM-24 region in which filaments extending west from the central ridge pass through the edges of the bubbles (see Figs. 1 and 10). We suggest that these bubbles, typically larger in size, have induced an accumulation of gas in the filament and reached pressure equilibrium conditions with the environment. Barnes et al. (2020) have reported that the maximum size of an H II region is set by pressure equilibrium with the ambient ISM, consistent with our interpretation. Similar to our findings, the role of H II bubbles in the formation of a molecular filament has also been suggested for the case of RCW 120 (Zavagno et al. 2020).
A total of 167 ATLASGAL clumps are found in the extended NGC 6334 region, most of which are embedded in the filamentary structure. We searched for their locations to investigate possible associations with the H II bubbles. We found that 56 of these clumps are located on the edges of the H II bubbles (0.8–1.2 × RH II). We also found that 26 of the 42 H II regions have at least one ATLASGAL clump located at the bubble radii. This result suggests that H II regions may play an important role in the formation of the filaments in which the ATLASGAL clumps are embedded. Elmegreen (1998) highlighted the important role of the H II region in the formation of stars at their edges or shells (see also Inutsuka et al. 2015). Cases of positive feedback from H II bubbles are reported towards multiple star-forming regions, for example towards the G305 complex a ‘collect and collapse’ model of triggered star formation is reported by Mazumdar et al. (2021).
6 Summary
We conducted observations of the 13CO and 12CO 3 → 2 molecular lines towards the extended NGC 6334 filament using the LAsMA instrument on the APEX telescope, with a spectral resolution of 0.25 km s−1 and a spatial resolution of ~20 arcsec (0.16 pc at 1.7 kpc). In this paper we focused on studying the emission morphology and velocity structure of the gas in the filament traced by carbon monoxide. The results are summarized here:
The CO traced gas in the NGC 6334 extended region is filamentary, and extends over 80 pc parallel to the Galactic plane. The central NGC 6334 filament exhibits bright CO emission tracing the dense gas reservoir that extends over a 10 pc scale. While 13CO traces denser regions, 12CO exhibits a more extended emission morphology.
We fitted the 13CO line profiles using an automated Gaussian fit algorithm Gausspyplus. Multiple velocity components were required to fit the observed line profiles towards the denser regions indicating the complex gas velocity structure of the filament. Overall, NGC 6334 exhibits two distinct gas components at velocities −3.9 and −9.2 km s−1. A third component at approximately −20 km s−1 is kinematically connected to the extended region.
We observed velocity and intensity fluctuations (called wiggles) along the dense ridge of the filament. We suggest that such fluctuations are likely associated with the local density enhancements and gravitational infall onto the filament.
We find that the dense gas along the filament shows velocity dispersions of 2 > σv > 0.9 km s−1. Higher velocity dispersions (>2 km s−1 were observed towards NGC 6334 central filament and an eastern filament (EF1). The velocity dispersion in the NGC 6334 filament is supersonic at the spatial resolution of our observations.
We investigated the molecular gas structure around the infrared H II regions identified by Anderson et al. (2014) using azimuthally averaged radial 13CO intensity profiles and measured the line intensity enhancement using the contrast method. Towards most H II regions, we detected molecular line emission and reported the systemic velocities. We found that 36 of 42 H II regions show the signature of molecular gas clearance from the centre. These sources exhibit little emission or a flat emission profile towards the central region with an intensity increasing outward or a bumpy feature at or near the H II radii. Using a contrast measurement method, we found intensity enhancements towards 34 of 42 H II regions. In addition, we found that many H II regions (26 of 42) have at least one ATLASGAL clump located at their shell radii.
A visually clear signature of H II bubble shells emanating from the filamentary structure is observed in particular towards the GM-24 region, in which filaments extending west from the central ridge are located at the edges of the bubbles. We suggest that these bubbles, typically evolved and larger in size, have assisted the formation of gas filament by accumulating gas at their edges and have reached pressure equilibrium with the environment.
We investigated the gas velocity structure around six FIR sources (I[N], I to V) in the central NGC 6334 filament using position velocity diagrams, and found evidence of gas compression towards all of them. In addition, we studied the gas velocity structure around H II regions using lv and bv plots in which velocities were obtained from Gaussian fitting of the 13CO line profiles. Towards one-third of the H II regions we observed a V-shaped emission indicating multiple gas compression in the NGC 6334 extended filament.
In the longitude-velocity (lv) plot for the entire mapped region (Fig. 8), we observed broad V-shaped (or inverted V-shaped) velocity structures towards the NGC 6334 central filament and the eastern filament (l ~ 352.1 deg). Towards the NGC 6334 central filament and eastern filament EF1 (l ~ 352.1 deg), the velocity gradient inferred from the arms of the V-shapes were consistent with a global infall scenario. We conclude that the eastern filament EF1 (l ~ 352.1 deg) is a hub-filament system in formation.
Finally, we studied the kinematic connection of bridge features and the northern filament (NGC 6334-NF) to the main gas component in NGC 6334. We found NGC 6334-NF contains relatively quiescent gas and does not harbour any star-forming clumps traced by sub-millimetre emission from dust. We suggest that the bridge features are possibly linked to cloud-cloud collisions in NGC 6334-NF and the NGC 6334 main filament.
In summary, our observations revealed a complex gas velocity structure in the NGC 6334 filament that extends over ~80 pc. Located in the west, the GM24 region exhibits bubbles within bubbles, and is at a relatively evolved stage of star formation. The NGC 6334 central ridge is undergoing global gas infall and exhibits two gas bridge features, possibly indicating cloud-cloud collisions in the NGC 6334-NF and the NGC 6334 main gas component. The relatively quiescent eastern filament (EF1 – G352.1) also shows the kinematic signature of global gas infall onto the filament. We detected molecular emission around most of the infrared H II regions, and found that most H II regions have already cleared out the molecular gas from the centre and that many have a shell- or ring-like molecular structure around them. We also observed multiple gas compression signatures around the H II regions and highlighted their important role in shaping the gas emission and velocity structure in the NGC 6334 extended region and in the overall evolution of this star-forming complex.
Data availability
The supplementary materials (Figures A.1–F.7 and Table F.1 of the appendix) are available online at https://doi.org/10.5281/zenodo.13642114.
The reduced datacubes are available at the CDS via anonymous ftp to cdsarc.cds.unistra.fr (130.79.128.5) or via https://cdsarc.cds.unistra.fr/viz-bin/cat/J/A+A/692/A114.
Acknowledgements
We thank anonymous referee for the constructive feedback that helped to improve the manuscript. This publication is based on data acquired with the Atacama Pathfinder Experiment (APEX) under program ID M-0107.F-9518A-2021. APEX has been a collaboration between the Max-Planck-Institut für Radioastronomie, the European Southern Observatory, and the Onsala Space Observatory. This work was supported by the Collaborative Research Council (CRC) 956, sub-project A6, and CRC 1601, sub-project B1, funded by the Deutsche Forschungsge-meinschaft (DFG). G.G acknowledges support by the ANID BASAL project FB210003.
References
- Anderson, L. D., Bania, T. M., Balser, D. S., et al. 2014, ApJS, 212, 1 [Google Scholar]
- André, P., Revéret, V., Könyves, V., et al. 2016, A&A, 592, A54 [NASA ADS] [CrossRef] [EDP Sciences] [Google Scholar]
- Arzoumanian, D., André, P., Peretto, N., & Könyves, V. 2013, A&A, 553, A119 [NASA ADS] [CrossRef] [EDP Sciences] [Google Scholar]
- Arzoumanian, D., Russeil, D., Zavagno, A., et al. 2022, A&A, 660, A56 [NASA ADS] [CrossRef] [EDP Sciences] [Google Scholar]
- Ballesteros-Paredes, J., Hartmann, L. W., Vázquez-Semadeni, E., Heitsch, F., & Zamora-Avilés, M. A. 2011, MNRAS, 411, 65 [NASA ADS] [CrossRef] [Google Scholar]
- Barnes, A. T., Longmore, S. N., Dale, J. E., et al. 2020, MNRAS, 498, 4906 [NASA ADS] [CrossRef] [Google Scholar]
- Churchwell, E. 2002, ARA&A, 40, 27 [Google Scholar]
- Churchwell, E., Watson, D. F., Povich, M. S., et al. 2007, ApJ, 670, 428 [NASA ADS] [CrossRef] [Google Scholar]
- Clarke, S. D., Whitworth, A. P., Duarte-Cabral, A., & Hubber, D. A. 2017, MNRAS, 468, 2489 [Google Scholar]
- Duarte-Cabral, A., & Dobbs, C. L. 2016, MNRAS, 458, 3667 [NASA ADS] [CrossRef] [Google Scholar]
- Elmegreen, B. G. 1998, ASP Conf. Ser., 148, 150 [Google Scholar]
- Frerking, M. A., Langer, W. D., & Wilson, R. W. 1982, ApJ, 262, 590 [Google Scholar]
- Fukui, Y., Kohno, M., Yokoyama, K., et al. 2018a, PASJ, 70, S44 [NASA ADS] [Google Scholar]
- Fukui, Y., Kohno, M., Yokoyama, K., et al. 2018b, PASJ, 70, S41 [NASA ADS] [Google Scholar]
- Green, D. A. 2019, J. Astrophys. Astron., 40, 36 [Google Scholar]
- Guo, W., Chen, X., Feng, J., et al. 2021, ApJ, 921, 23 [NASA ADS] [CrossRef] [Google Scholar]
- Hacar, A., & Tafalla, M. 2011, A&A, 533, A34 [NASA ADS] [CrossRef] [EDP Sciences] [Google Scholar]
- Hacar, A., Clark, S. E., Heitsch, F., et al. 2023, ASP Conf. Ser., 534, 153 [NASA ADS] [Google Scholar]
- Heitsch, F. 2013, ApJ, 769, 115 [Google Scholar]
- Henshaw, J. D., Kruijssen, J. M. D., Longmore, S. N., et al. 2020, Nat. Astron., 4, 1064 [CrossRef] [Google Scholar]
- Inoue, T., & Fukui, Y. 2013, ApJ, 774, L31 [Google Scholar]
- Inutsuka, S.-i., Inoue, T., Iwasaki, K., & Hosokawa, T. 2015, A&A, 580, A49 [NASA ADS] [CrossRef] [EDP Sciences] [Google Scholar]
- Jackson, J. M., Rathborne, J. M., Shah, R. Y., et al. 2006, ApJS, 163, 145 [NASA ADS] [CrossRef] [Google Scholar]
- Klein, B., Hochgürtel, S., Krämer, I., et al. 2012, A&A, 542, L3 [NASA ADS] [CrossRef] [EDP Sciences] [Google Scholar]
- Klessen, R. S., & Glover, S. C. O. 2016, in Saas-Fee Advanced Course, eds. Y. Revaz, P. Jablonka, R. Teyssier, & L. Mayer (Berlin: Springer), 43, 85 [NASA ADS] [CrossRef] [Google Scholar]
- Kraemer, K. E., & Jackson, J. M. 1999, ApJS, 124, 439 [Google Scholar]
- Li, S., Zhang, Q., Liu, H. B., et al. 2020, ApJ, 896, 110 [Google Scholar]
- Loughran, L., McBreen, B., Fazio, G. G., et al. 1986, ApJ, 303, 629 [NASA ADS] [CrossRef] [Google Scholar]
- Mattern, M., Kauffmann, J., Csengeri, T., et al. 2018, A&A, 619, A166 [NASA ADS] [CrossRef] [EDP Sciences] [Google Scholar]
- Mazumdar, P., Wyrowski, F., Urquhart, J. S., et al. 2021, A&A, 656, A101 [NASA ADS] [CrossRef] [EDP Sciences] [Google Scholar]
- Muñoz, D. J., Mardones, D., Garay, G., et al. 2007, ApJ, 668, 906 [Google Scholar]
- Persi, P., & Tapia, M. 2008, in Handbook of Star Forming Regions, ed. B. Reipurth (USA: ASP BOOks), 5, 456 [NASA ADS] [Google Scholar]
- Riener, M., Kainulainen, J., Henshaw, J. D., et al. 2019, A&A, 628, A78 [NASA ADS] [CrossRef] [EDP Sciences] [Google Scholar]
- Russeil, D., Zavagno, A., Adami, C., et al. 2012, A&A, 538, A142 [NASA ADS] [CrossRef] [EDP Sciences] [Google Scholar]
- Russeil, D., Schneider, N., Anderson, L. D., et al. 2013, A&A, 554, A42 [NASA ADS] [CrossRef] [EDP Sciences] [Google Scholar]
- Russeil, D., Tigé, J., Adami, C., et al. 2016, A&A, 587, A135 [NASA ADS] [CrossRef] [EDP Sciences] [Google Scholar]
- Russeil, D., Adami, C., Bouret, J. C., et al. 2017, A&A, 607, A86 [NASA ADS] [CrossRef] [EDP Sciences] [Google Scholar]
- Russeil, D., Zavagno, A., Nguyen, A., et al. 2020, A&A, 642, A21 [NASA ADS] [CrossRef] [EDP Sciences] [Google Scholar]
- Sadaghiani, M., Sánchez-Monge, Á., Schilke, P., et al. 2020, A&A, 635, A2 [NASA ADS] [CrossRef] [EDP Sciences] [Google Scholar]
- Smith, R. J., Glover, S. C. O., Klessen, R. S., & Fuller, G. A. 2016, MNRAS, 455, 3640 [Google Scholar]
- Smith, R. J., Treß, R. G., Sormani, M. C., et al. 2020, MNRAS, 492, 1594 [NASA ADS] [CrossRef] [Google Scholar]
- Tigé, J., Motte, F., Russeil, D., et al. 2017, A&A, 602, A77 [Google Scholar]
- Tremblin, P., Minier, V., Schneider, N., et al. 2013, A&A, 560, A19 [NASA ADS] [CrossRef] [EDP Sciences] [Google Scholar]
- Urquhart, J. S., Koenig, C., Giannetti, A., et al. 2018a, VizieR Online Data Catalog: J/MNRAS/473/1059 [Google Scholar]
- Urquhart, J. S., König, C., Giannetti, A., et al. 2018b, MNRAS, 473, 1059 [Google Scholar]
- van der Tak, F. F. S., Black, J. H., Schöier, F. L., Jansen, D. J., & van Dishoeck, E. F. 2007, A&A, 468, 627 [NASA ADS] [CrossRef] [EDP Sciences] [Google Scholar]
- Vázquez-Semadeni, E., Palau, A., Ballesteros-Paredes, J., Gómez, G. C., & Zamora-Avilés, M. 2019, MNRAS, 490, 3061 [Google Scholar]
- Wang, S., Zhang, C., Jiang, B., et al. 2020, A&A, 639, A72 [NASA ADS] [CrossRef] [EDP Sciences] [Google Scholar]
- Wilson, T. L., & Rood, R. 1994, ARA&A, 32, 191 [Google Scholar]
- Xu, S., Ji, S., & Lazarian, A. 2019, ApJ, 878, 157 [CrossRef] [Google Scholar]
- Zavagno, A., André, P., Schuller, F., et al. 2020, A&A, 638, A7 [NASA ADS] [CrossRef] [EDP Sciences] [Google Scholar]
- Zernickel, A., Schilke, P., & Smith, R. J. 2013, A&A, 554, L2 [NASA ADS] [CrossRef] [EDP Sciences] [Google Scholar]
- Zhou, J. W., Wyrowski, F., Neupane, S., et al. 2023, A&A, 676, A69 [NASA ADS] [CrossRef] [EDP Sciences] [Google Scholar]
WISE catalogue V2.2: http://astro.phys.wvu.edu/wise/
We use antenna temperature units T*A throughout this work unless otherwise stated in the text.
RADEX: Non-LTE molecular radiative transfer in an isothermal homogeneous medium by van der Tak et al. (2007), also available online at https://personal.sron.nl/~vdtak/radex/index.shtml
This study employs the Galactic coordinate system. We use east (west) to mean directions of higher (lower) Galactic longitude, while north (south) mean higher (lower) latitude.
All Tables
All Figures
|
Fig. 1 Spitzer three-colour image (red: 8 µm, green: 4.5 µm, blue: 3.6 µm) of the NGC 6334 extended region. OB stars from Russeil et al. (2020) and Persi & Tapia (2008) are indicated by cyan triangles and red stars, respectively. H II bubbles from Anderson et al. (2014) are shown as dotted magenta circles, some of which are labelled in white or black text. The red plus signs give the positions of radio sources from Russeil et al. (2017). |
| In the text | |
|
Fig. 2 Histogram of the rms T*A [K] in the 13CO and 12CO lines. The dotted vertical lines in colour indicate the median rms values. |
| In the text | |
|
Fig. 3 Average of the 13CO (in red) and 12CO (in black) spectra towards the NGC 6334 extended filament. The vertical dotted lines indicate velocity ranges of [−30,+20] and [−15,+5] km s−1 in black and red, respectively. |
| In the text | |
|
Fig. 4 Emission morphologies (moment 0 maps) towards the extended NGC 6334 filament. Top:13CO; bottom: 12CO. Contours are drawn at 7, 30, and 70 K km s−1 for 13CO and at 15, 50, 100, 150, and 200 K km s−1 for 12CO. Velocity ranges used for integrating the intensities are given in the bottom right corner of the maps. The dashed red boxes in the top image outline the central filament and the GM24 region. The various regions discussed in the text are labelled in red. The FIR sources I[N], I to V (corresponding to radio sources F to A; see Kraemer & Jackson 1999) are marked with yellow plus signs on the images. In the 12CO moment 0 map the OB star positions from Persi & Tapia (2008) are shown as red open dots. A circle is drawn centred at l = 351.317, b = 0.918, the position of the dominant O6.5 star, to match the arc-like emission morphology observed towards the NGC 6334 central filament. The green plus signs indicate the position of ATLASGAL sources in the NGC 6334 extended region (Urquhart et al. 2018b). |
| In the text | |
|
Fig. 5 Position-velocity maps toward the NGC 6334 extended region. Top:13CO (red) and 12CO (black) emission contours overlaid on the 870µm ATLASGAL dust emission (greyscale). The contour levels are the same as in Fig. 4. Middle and Bottom: position-velocity maps of 13CO and 12CO, respectively. The dotted red lines in the top image show the path along which the PV maps are constructed. The offsets are the projected path length along the galactic longitude from east to west along the strip. On the PV maps, the projected offset positions of the FIR sources (I[N], I to V from right to left) in the central filament and GM-24 region are indicated by the dotted black markers at the bottom. |
| In the text | |
|
Fig. 6 Intensity-weighted velocity map (moment 1) of the 13CO emission towards the NGC 6334 extended filament. The labels are the same as in Fig. 4 |
| In the text | |
|
Fig. 7 Histogram of the 13CO velocities obtained from the moment 1 map. |
| In the text | |
|
Fig. 8 Velocity structure of the NGC 6334 extended region. Top: 2D histogram plot of 13CO velocity components in the full observed region projected along the longitudinal direction from east to west. The bin sizes are 300 × 300. The colour bar shows the counts. The dotted white line follows the median velocities at a given longitude. The longitude of the six FIR sources I[N], I, II, III, IV, and V, and also the GM24 region is indicated by the vertical dotted white markers. Also shown are the positions of the V-shaped velocity gradients (in cyan). Bottom: velocity and intensity variation along the longitude within the PV-sliced region in Fig. 5. The values on the y-axis are arbitrary numbers normalized by the mean values. The vertical black dotted lines indicate the longitudinal positions of the ATLASGAL clumps in the same region. |
| In the text | |
|
Fig. 9 PV map (top panel) and lv map (bottom panel) towards the NGC 6334 central region (path along l = 351.0° to 351.65° at b = 0.67°). The PV map uses intensity weighting for estimating the velocities, while the lv map is made using Gaussian velocity components of13 CO spectra. |
| In the text | |
|
Fig. 10 Channel maps of 13CO emission in the velocity range −15 to +5 km s−1 with steps of 2 km s−1. The magenta dashed circles indicate H II bubbles from Anderson et al. (2014). the vertical black lines indicate the positions of the broad V-shapes observed in the lv plot in Fig. 8. The labels indicating the various emission features in the maps are the same as in Fig. 4. Some optical H II regions (as in Fig. 1) discussed in the text are also labelled in the top left channel map for reference. For a clearer view of the channel maps, zoomed-in maps towards the central filaments, GM-24 and G352, are presented in Figs. C.1 to C.3. |
| In the text | |
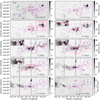 |
Fig. 11 Same as Fig. 10, but for 12CO emission. |
| In the text | |
|
Fig. 12 Azimuthally averaged 13CO radial intensity profile for the H II region G350.482+0.951 for the velocity range [−15, +5] km s−1. The intensities are normalized by the peak value. The vertical black line indicate the radius of the H II region from Anderson et al. (2014). |
| In the text | |
|
Fig. 13 Empirical cumulative distribution function (eCDF) of the contrast values measured for the H II regions (black) and 1000 randomly created rings (red) in the mapped region. The two sample ks-test results are also shown. |
| In the text | |
|
Fig. 14 lv plot towards the H II region G350.594+1.149. The observed V-shaped emission structure is indicated by the red lines. |
| In the text | |
|
Fig. 15 Histogram of velocity dispersion (σv) values determined from the Gaussian fit to the 13CO line profiles. |
| In the text | |
|
Fig. 16 Velocity dispersion measured from 13CO Gaussian fit. Dispersion velocity ranges are presented in the top left corner of each plot. Also shown are the H II sources from the catalogue of Anderson et al. (2014). |
| In the text | |
|
Fig. 17 Maps of 13CO (top) and 12CO (bottom) integrated over the velocity range from −12 to −7 km s−1. The labels and markers are the same as in Fig. 4. |
| In the text | |
|
Fig. 18 Map of 12CO integrated emission integrated over the velocity range from −25 to −15 km s−1 the contour line represening the 5σ level. The emission north to the NGC 6334 central region is the northern filament (NF). The yellow plus signs denote the FIR-sources (I[N], I to V from east to west) in the central filament. |
| In the text | |
Current usage metrics show cumulative count of Article Views (full-text article views including HTML views, PDF and ePub downloads, according to the available data) and Abstracts Views on Vision4Press platform.
Data correspond to usage on the plateform after 2015. The current usage metrics is available 48-96 hours after online publication and is updated daily on week days.
Initial download of the metrics may take a while.