Fig. 10
Download original image
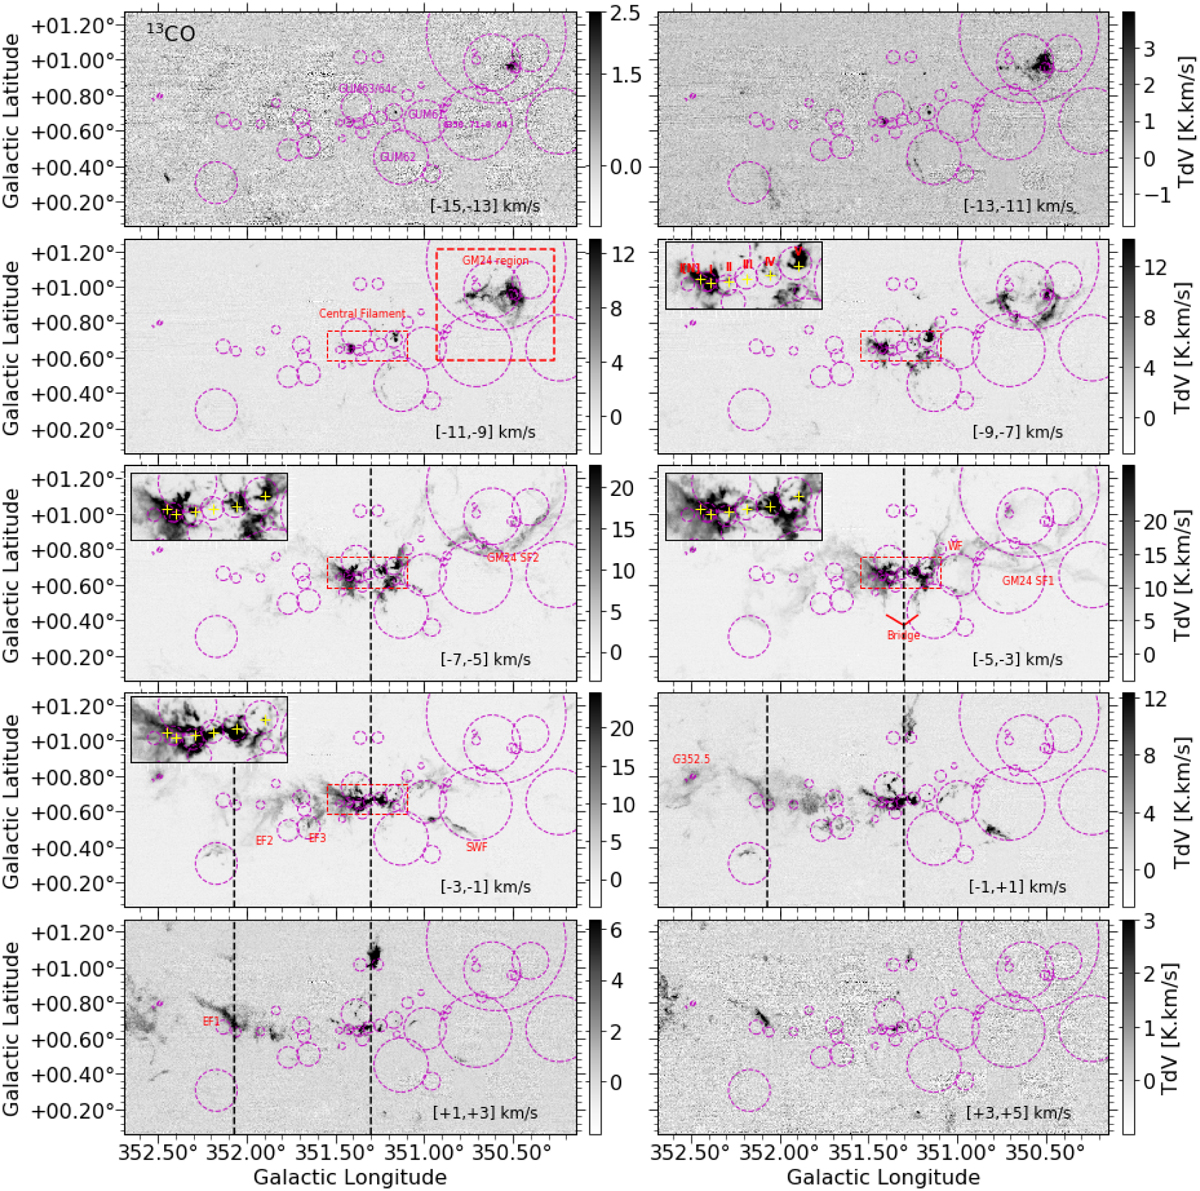
Channel maps of 13CO emission in the velocity range −15 to +5 km s−1 with steps of 2 km s−1. The magenta dashed circles indicate H II bubbles from Anderson et al. (2014). the vertical black lines indicate the positions of the broad V-shapes observed in the lv plot in Fig. 8. The labels indicating the various emission features in the maps are the same as in Fig. 4. Some optical H II regions (as in Fig. 1) discussed in the text are also labelled in the top left channel map for reference. For a clearer view of the channel maps, zoomed-in maps towards the central filaments, GM-24 and G352, are presented in Figs. C.1 to C.3.
Current usage metrics show cumulative count of Article Views (full-text article views including HTML views, PDF and ePub downloads, according to the available data) and Abstracts Views on Vision4Press platform.
Data correspond to usage on the plateform after 2015. The current usage metrics is available 48-96 hours after online publication and is updated daily on week days.
Initial download of the metrics may take a while.