Fig. 5
Download original image
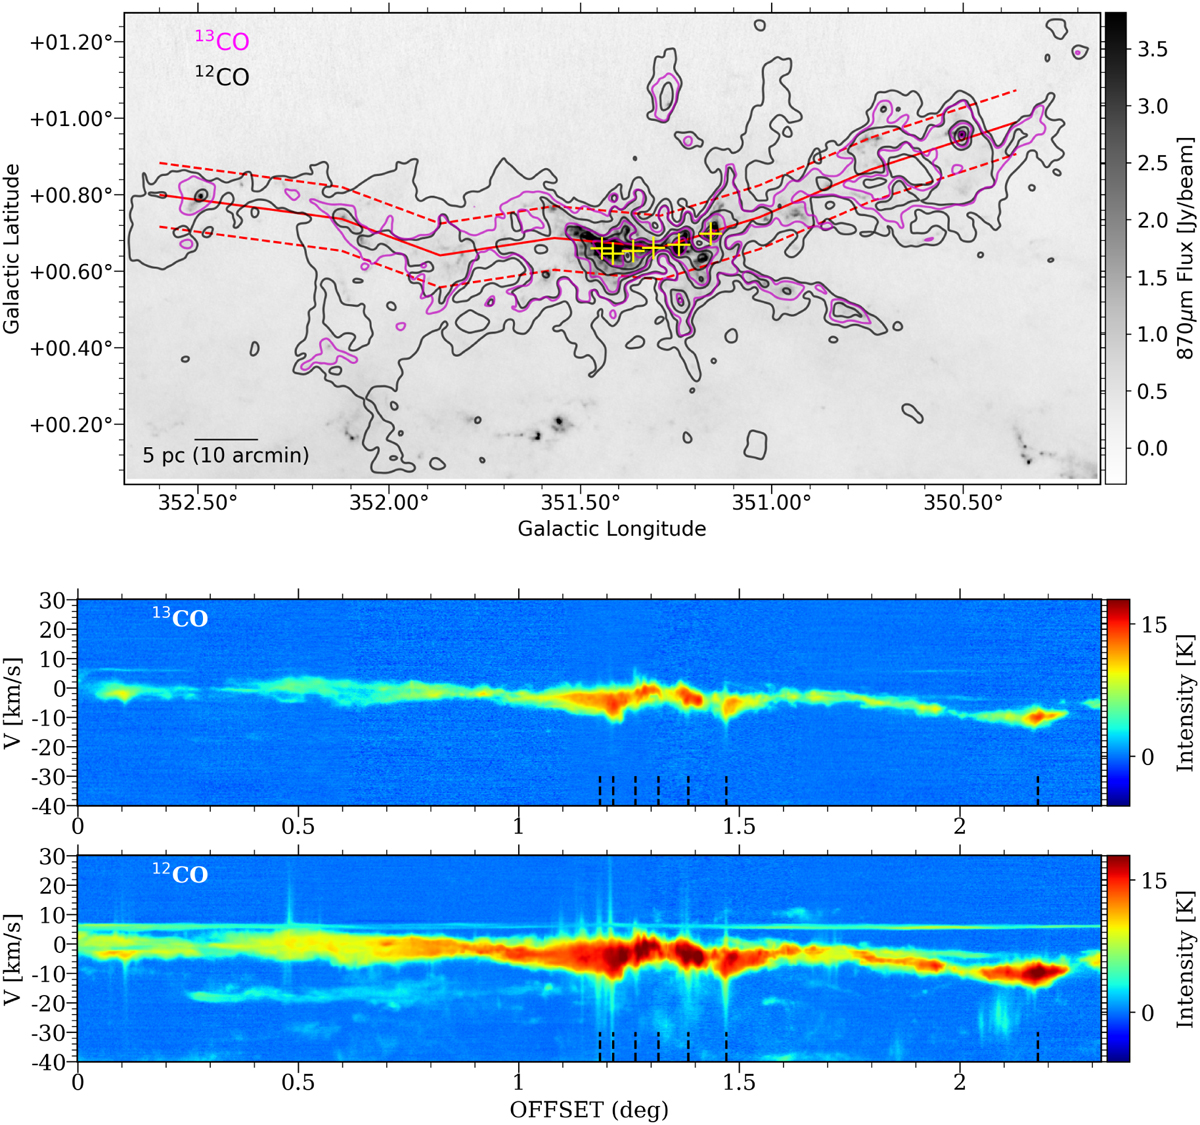
Position-velocity maps toward the NGC 6334 extended region. Top:13CO (red) and 12CO (black) emission contours overlaid on the 870µm ATLASGAL dust emission (greyscale). The contour levels are the same as in Fig. 4. Middle and Bottom: position-velocity maps of 13CO and 12CO, respectively. The dotted red lines in the top image show the path along which the PV maps are constructed. The offsets are the projected path length along the galactic longitude from east to west along the strip. On the PV maps, the projected offset positions of the FIR sources (I[N], I to V from right to left) in the central filament and GM-24 region are indicated by the dotted black markers at the bottom.
Current usage metrics show cumulative count of Article Views (full-text article views including HTML views, PDF and ePub downloads, according to the available data) and Abstracts Views on Vision4Press platform.
Data correspond to usage on the plateform after 2015. The current usage metrics is available 48-96 hours after online publication and is updated daily on week days.
Initial download of the metrics may take a while.