Fig. 8

Download original image
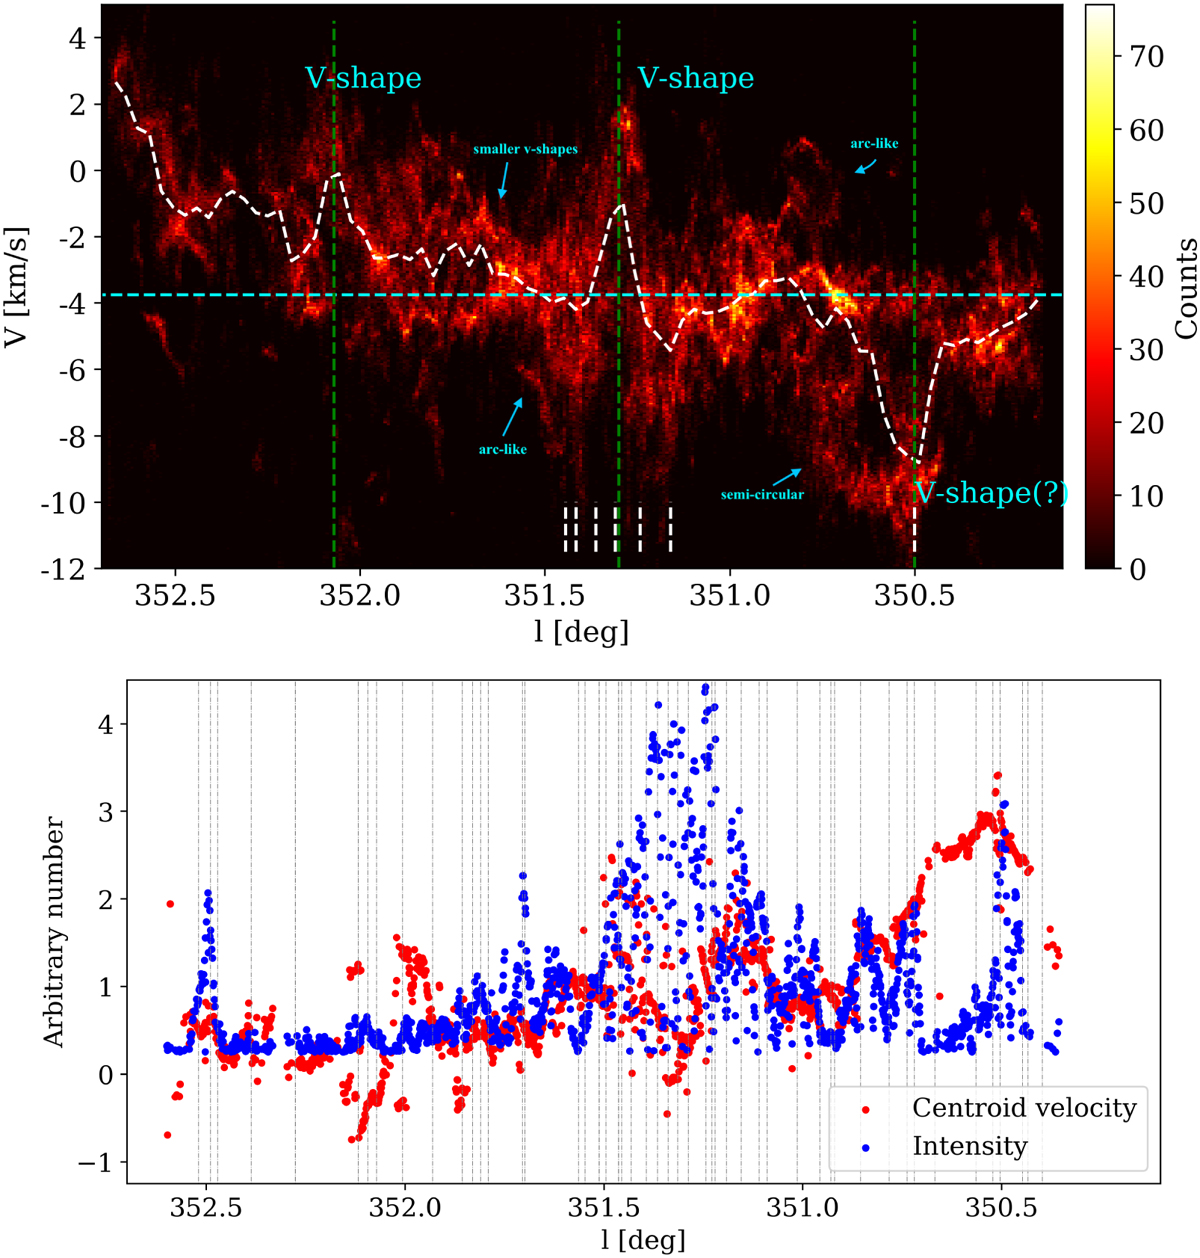
Velocity structure of the NGC 6334 extended region. Top: 2D histogram plot of 13CO velocity components in the full observed region projected along the longitudinal direction from east to west. The bin sizes are 300 × 300. The colour bar shows the counts. The dotted white line follows the median velocities at a given longitude. The longitude of the six FIR sources I[N], I, II, III, IV, and V, and also the GM24 region is indicated by the vertical dotted white markers. Also shown are the positions of the V-shaped velocity gradients (in cyan). Bottom: velocity and intensity variation along the longitude within the PV-sliced region in Fig. 5. The values on the y-axis are arbitrary numbers normalized by the mean values. The vertical black dotted lines indicate the longitudinal positions of the ATLASGAL clumps in the same region.
Current usage metrics show cumulative count of Article Views (full-text article views including HTML views, PDF and ePub downloads, according to the available data) and Abstracts Views on Vision4Press platform.
Data correspond to usage on the plateform after 2015. The current usage metrics is available 48-96 hours after online publication and is updated daily on week days.
Initial download of the metrics may take a while.


