Fig. 4
Download original image
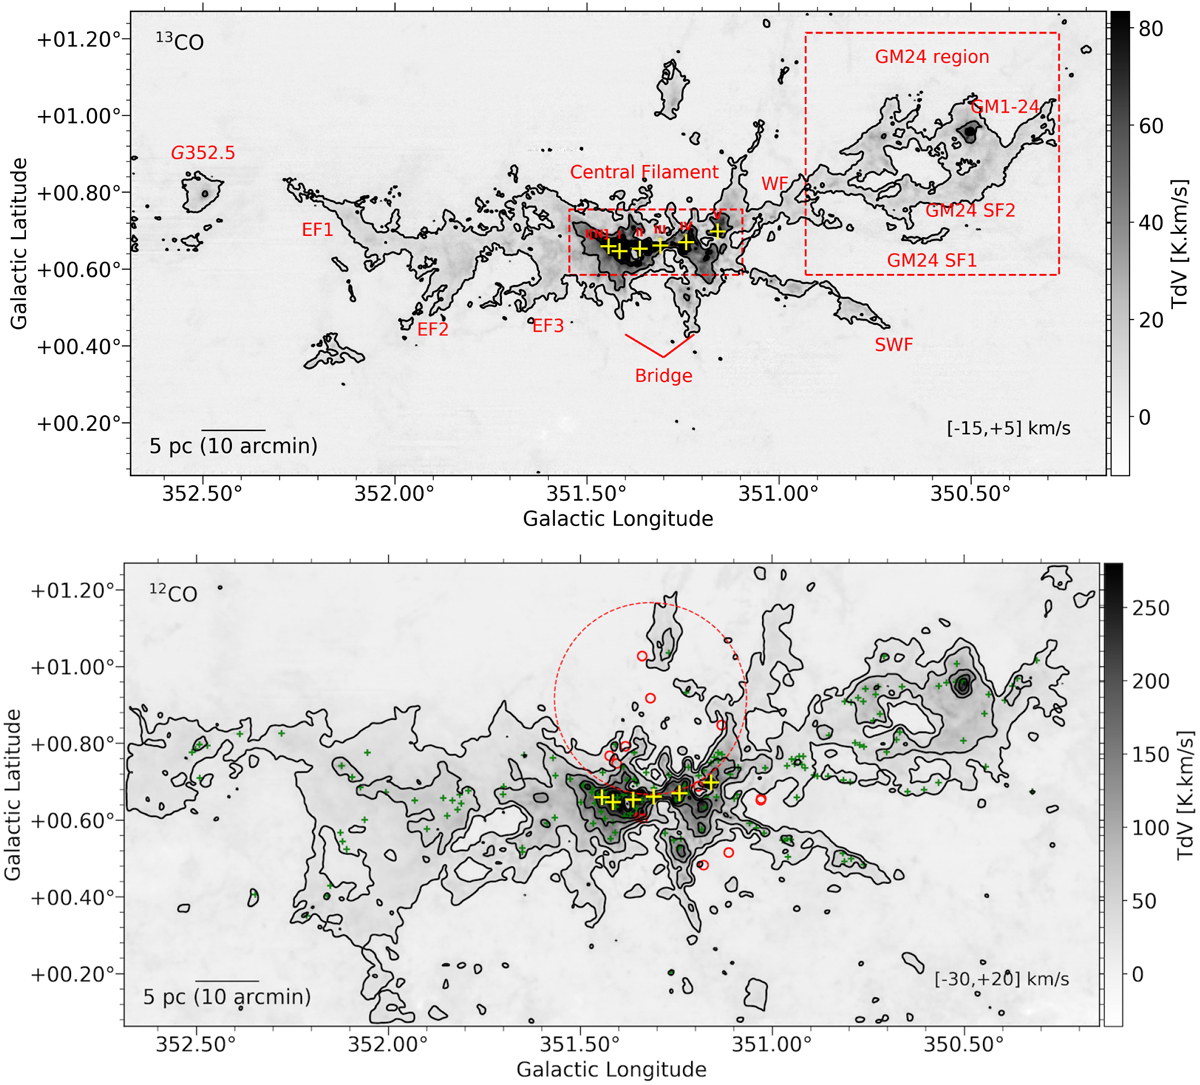
Emission morphologies (moment 0 maps) towards the extended NGC 6334 filament. Top:13CO; bottom: 12CO. Contours are drawn at 7, 30, and 70 K km s−1 for 13CO and at 15, 50, 100, 150, and 200 K km s−1 for 12CO. Velocity ranges used for integrating the intensities are given in the bottom right corner of the maps. The dashed red boxes in the top image outline the central filament and the GM24 region. The various regions discussed in the text are labelled in red. The FIR sources I[N], I to V (corresponding to radio sources F to A; see Kraemer & Jackson 1999) are marked with yellow plus signs on the images. In the 12CO moment 0 map the OB star positions from Persi & Tapia (2008) are shown as red open dots. A circle is drawn centred at l = 351.317, b = 0.918, the position of the dominant O6.5 star, to match the arc-like emission morphology observed towards the NGC 6334 central filament. The green plus signs indicate the position of ATLASGAL sources in the NGC 6334 extended region (Urquhart et al. 2018b).
Current usage metrics show cumulative count of Article Views (full-text article views including HTML views, PDF and ePub downloads, according to the available data) and Abstracts Views on Vision4Press platform.
Data correspond to usage on the plateform after 2015. The current usage metrics is available 48-96 hours after online publication and is updated daily on week days.
Initial download of the metrics may take a while.