| Issue |
A&A
Volume 691, November 2024
|
|
|---|---|---|
| Article Number | A186 | |
| Number of page(s) | 34 | |
| Section | Stellar structure and evolution | |
| DOI | https://doi.org/10.1051/0004-6361/202451437 | |
| Published online | 13 November 2024 | |
Super-slowly rotating Ap (ssrAp) stars: Spectroscopic study
1
European Southern Observatory, Alonso de Cordova 3107, Vitacura, Santiago, Chile
2
Jeremiah Horrocks Institute, University of Central Lancashire, Preston PR1 2HE, UK
3
South African Astronomical Observatory, PO Box 9 Observatory 7935 Cape Town, South Africa
4
INAF–Osservatorio Astrofisico di Catania, Via S. Sofia 78, 95123 Catania, Italy
5
Centre for Space Research, North-West University, Mahikeng 2745, South Africa
6
Dipartimento di Fisica e Astronomia, Sezione Astrofisica, Università di Catania, Via S. Sofia 78, I-95123 Catania, Italy
⋆ Corresponding author; This email address is being protected from spambots. You need JavaScript enabled to view it.
Received:
9
July
2024
Accepted:
6
September
2024
Abstract
Context. The fact that the rotation periods of Ap stars span five to six orders of magnitude and that the longest ones reach several hundred years represents one of the main unsolved challenges of stellar physics.
Aims. Our goal is to gain better understanding of the occurrence and properties of the longest period Ap stars.
Methods. We obtained high resolution spectra of a sample of super-slowly rotating Ap (ssrAp) star candidates identified by a TESS photometric survey to confirm that they are indeed Ap stars, to check that their projected equatorial velocities are compatible with super-slow rotation, and to obtain a first estimate of their magnetic field strengths. For the confirmed Ap stars, we determined whenever possible their mean magnetic field modulus, their mean quadratic magnetic field, and an upper limit of their projected equatorial velocities.
Results. Eighteen of the 27 stars studied are typical Ap stars; most of the other nine appear to be misclassified. One of the Ap stars is not a slow rotator; it must be seen nearly pole-on. The properties of the remaining 17 are compatible with moderately to extremely long rotation periods. Eight new stars with resolved magnetically split lines in the visible range were discovered; their mean magnetic field modulus and their mean quadratic magnetic field were measured. The mean quadratic field could also be determined in five more stars. Five spectroscopic binaries containing an Ap star, which were not previously known, were identified. Among the misclassified stars, one double-lined spectroscopic binary with two similar, sharp-lined Am components was also discovered.
Conclusions. The technique that we used to carry out a search for ssrAp star candidates using TESS data is validated. Its main limitation appears to arise from uncertainties in the spectral classification of Ap stars. The new magnetic field measurements obtained as part of this study lend further support to the tentative conclusions of our previous studies: the absence of periods Prot ≳ 150 d in stars with B0 ≳ 7.5 kG, the lower rate of occurrence of super-slow rotation for field strengths B0 ≲ 2 kG than in the range 3 kG ≲ B0 ≲ 7.5 kG, and the deficiency of slowly rotating Ap stars with (phase-averaged) field strengths between ∼2 and ∼3 kG.
Key words: binaries: spectroscopic / stars: chemically peculiar / stars: magnetic field / stars: oscillations / stars: rotation
© The Authors 2024
 Open Access article, published by EDP Sciences, under the terms of the Creative Commons Attribution License (https://creativecommons.org/licenses/by/4.0), which permits unrestricted use, distribution, and reproduction in any medium, provided the original work is properly cited.
This article is published in open access under the Subscribe to Open model. This email address is being protected from spambots. You need JavaScript enabled to view it. to support open access publication.
1. Introduction
The rotation periods of the Ap stars range from about half a day to several centuries, possibly even ∼1000 years or more (Mathys 2017). The loss of angular momentum undergone by these stars during their main sequence lifetime is at most marginal (Kochukhov & Bagnulo 2006; Hubrig et al. 2007). Hence, period differentiation spanning five to six orders of magnitude must have been achieved at the pre-main sequence stage. Understanding how this can be done represents a major challenge for the theories of stellar formation and evolution. For further progress in this area, additional observational constraints are needed to guide the theoretical developments. The project described in this paper represents part of the current effort made to provide this kind of information.
The existence of a considerable population of Ap stars that have very long rotation periods has become increasingly well established in recent years. Mathys (2017) concluded that several percent of all Ap stars must have rotation periods longer than 1 yr. This subsequently led him to define a class of super-slowly rotating Ap (ssrAp) stars (Mathys 2020), consisting of the Ap stars that have rotation periods Prot > 50 d. While arbitrary, this lower limit makes physical sense in a number of respects (Mathys et al. 2024). As highlighted by these authors, for an Ap star observed equator-on, Prot = 50 d is a value for which the rotational broadening of iron spectral lines is comparable to their thermal broadening in Ap stars, and close to, or slighhtly below, the instrumental broadening of most current high-resolution spectrographs. Longer rotation periods cannot be constrained from line broadening alone.
Studying the most extreme representatives of a special class of objects often has the potential to provide insight into the origin of the physical properties shared by all the members of the class. That is why it appears particularly valuable to undertake systematic work to characterise the Ap stars that have the longest rotation periods. The ssrAp stars known until recently, which were mostly the results of serendipitous discoveries, did not lend themselves well to such a systematic effort. Accordingly, we undertook a coordinated effort to carry out an exhaustive search for ssrAp stars in an objective sample.
To this effect, Mathys et al. (2020) (hereafter Paper I) introduced an automated method to identify ssrAp star candidates from the observations performed during Cycle 1 of the TESS (Transiting Exoplanet Survey Satellite) mission. In a second step, they performed similar searches based on TESS Cycle 2 data (Mathys et al. 2022, hereafter Paper II) and Cycles 3 and 4 data (Mathys et al. 2024, hereafter Paper III). Their approach is based on the consideration that Ap stars present brightness inhomogeneities over their surface, which are stable over (very) long timescales and are, to first order, symmetrically distributed about the magnetic axis. The latter makes an angle β with the rotation axis, which is inclined to the line of sight by an angle i. Accordingly, photometric variations are observed with the rotation period of the star (e.g. Preston 1971). This is called α2 CVn variability, from the name of the star in which it was first observed, which represents a prototype of the class. The underlying basic principle of the above-mentioned method is that those Ap stars that do not show α2 CVn photometric variations over the duration of a TESS sector (27 d) are ssrAp star candidates.
In practice, application of this simple principle unsurprisingly involves some complications. For instance, the lack of observable photometric variations may be due to a very low obliquity β of the magnetic axis or a very low inclination i of the rotation axis to the line of sight. These, and other possible complications, have been discussed in detail in the references listed above. Because of them, it is necessary to confirm spectroscopically the slow rotation of the ssrAp star candidates. Here we report on the first part of a follow-up project carried out to this effect.
In Sect. 2, we present the spectroscopic observations that were performed and their outcome. Section 3 describes the way in which the obtained spectra were analysed to determine the magnetic fields of the studied stars and to constrain their projected equatorial velocities, and it gives the results of this analysis. The properties of each star are discussed on an individual basis in Appendix A. As part of this discussion, we also revisit the available TESS data; many stars were reobserved in more TESS sectors since we completed our original search. Section 4 is devoted to a discussion of the chemical peculiarity, rotation, binarity and magnetic field of the stars of our sample, on a statistical basis. Finally, in Sect. 5, we draw the conclusions of the present work and sketch our plans for follow-up studies.
2. Spectroscopic observations
2.1. Observation details
For spectroscopic confirmation of the ssrAp star candidates identified in our TESS photometric survey, we started a dedicated observational project. Our main objectives are (1) to confirm that the ssrAp star candidates are indeed Ap stars; (2) to check that their projected equatorial velocities are compatible with super-slow rotation; and (3) to obtain a first estimate of their magnetic field strengths. The observations were performed with HARPS-N (the High Accuracy Radial velocity Planet Searcher for the Northern hemisphere; Cosentino et al. 2012) at the TNG (Telescopio Nazionale Galileo), SALT-HRS (the Southern African Large Telescope High Resolution échelle Spectrograph; Bramall et al. 2010), and CAOS (the Catania Astrophysical Observatory Spectropolarimeter; Leone et al. 2016) at the 0.9-m telescope of OAC (Catania Astrophysical Observatory). In addition, we analysed two spectra obtained with FEROS (the Fiber-fed Extended Range Optical Spectrograph; Kaufer et al. 1999) fed by the 2.2-m telescope at ESO (European Southern Observatory). Finally, for two stars, we used spectropolarimetric observations from the CFHT (Canada-France-Hawaii Telescope) ESPaDOnS (Echelle SPectropolarimetric Device for the Observation of Stars; Donati et al. 2006) archive.
HARPS-N at the TNG is an echelle spectrograph covering the wavelength range 3830–6930 Å, with a resolving power R = 115 000. According to the magnitudes of the targets, the S/N varies from 150 to 200.
The SALT-HRS is a fibre-fed, dual-beam, echelle spectrograph with wavelength coverage of 3700–5500 Å and 5500–8900 Å in the blue and red arms, respectively (Bramall et al. 2010; Crause et al. 2014). Of the three available observing modes, we used the High Resolution mode that achieves a resolving power of R ∼ 45 000 with the current reduction pipeline. The observations were automatically reduced using this pipeline, which is based on the ESO’s MIDAS pipeline (Kniazev et al. 2017, 2016). The resultant spectra achieved a S/N in the range 200-280 in the spectral range of interest. The pipeline reduced spectra were normalised to unity in the continuum using the SUPPNET package (Różański et al. 2022).
The CAOS spectra cover the spectral range 3900–6800 Å, with a resolving power R = 40 000, as measured from the ThAr lines of the wavelength calibration arc spectrum. The S/N ranges from 50 to 150 according to the magnitudes of the targets.
The collection of FEROS observations from which the spectra analysed here were obtained was described by Freyhammer et al. (2008) and Elkin et al. (2012); we used the data as reduced by these authors. These spectra, which cover the wavelength range 3530–9220 Å, were recorded at a resolving power R ∼ 48 000, with S/N ∼ 150–200.
The ESPaDOnS archive spectra analysed in this study are similar to those described by Khalack et al. (2017). These Stokes IV spectra, which range from 3700 to 10 000 Å, were reduced by the CFHT team using the software package Libre-ESPriT (Donati et al. 1997). The achieved resolving power is R ∼ 65 000, at a S/N ∼ 500.
2.2. Spectra
Figures A.1 to A.5 show a 30 Å-long portion of the spectrum of 25 of the 26 sharpest-lined stars that were observed until now as part of this project. Near its centre is the Fe IIλ 6149 Å line, whose high magnetic sensitivity and doublet Zeeman pattern have made it the most used diagnostic line for determination of the mean magnetic field modulus ⟨B⟩ (the line-intensity weighted average over the visible stellar disk of the modulus of the magnetic field). The surrounding wavelength interval includes lines of various chemical elements, some of them in two different ionisation states. Among them are elements that are often overabundant in Ap stars, such as Si, Cr, Nd, and Pr, as well as elements that are generally observed in normal A stars (O, Ca, Fe, and Ba). Using the Vienna Atomic Line Database (VALD; Kupka et al. 1999), complemented by the National Institute of Standards and Technology (NIST) Atomic Spectra Database1 (Kramida et al. 2023), we identified the main contributors of a number of lines that are present in different stars. These identifications are only provided for illustrative purposes; they are not meant to be exhaustive. In particular, some of the lines in some of the stars are definitely blends resulting from the wavelength coincidence of transitions of different elements. One of the most prominent examples is that of the line located close to 6145 Å: in many Ap stars, it is predominantly due to the Nd III transition that is identified in the figures, but the Si Iλ 6145.015 Å line also contributes to it.
The spectra are presented in Figs. A.1–A.5 in order of increasing effective temperature Teff. The values of the latter are as listed in Paper I and Paper II. One can see in the figures a general trend for many of the lines to become stronger or weaker following this sequence. For instance, the Ca Iλ 6162.2 Å line is prominent in the coolest stars, but vanishes completely above Teff ∼ 9700 K. Overall, the trend is similar for the Fe I and Si I lines. The former remain visible up to Teff ∼ 10 700 K (with the exception of TIC 444094235 – see below), while the latter, which also show more irregular star-to-star differences, are no longer seen at Teff ≳ 8700 K. Conversely, the O I lines start to appear at temperatures Teff ∼ 9700 K and above. The Fe II lines are present throughout the whole temperature range of consideration, a behaviour mostly shared by the Cr II lines, which however are conspicuously absent from the spectra of a number of stars. The Nd IIIλ 6145.1 Å line tends to be prominent in most stars up to Teff ∼ 10, 700 K (again, TIC 444094235 represents an exception), and the Pr IIIλ 6160.2 Å line is also rather strong in some of them.
However, throughout the whole temperature range of interest, there are stars that do not show lines of any of the elements Si, Cr, Nd or Pr: TIC 334505323 (HD 106322, Teff = 7683 K), TIC 207468665 (HD 148330, Teff = 9700 K), TIC 286965228 (HD 127304, Teff = 9950 K), TIC 301918605 (HD 17330, Teff = 10 250 K), TIC 80486647 (HD 67658, Teff = 12 018 K), and TIC 124998213 (HD 44979, Teff = 12 593 K). These stars are definitely not typical Ap stars. Misclassification as Ap cannot be ruled out. In fact, Murphy et al. (2020) assigned the spectral type A4IV to TIC 80486647. The difference between the typical effective temperature of an A4 star and the much higher value reported here is striking. The strength of the Ba IIλ 6141.7 Å line appears much more consistent with the former than with the latter. This lends further support to the suspicion that the classification underlying the inclusion of this star in the present sample was wrong. An additional marginal case is that of TIC 291561579 (HD 171420, Teff = 6793 K). Its spectrum is very different from that of the other stars with effective temperatures below 7000 K. The Fe lines are weak, there are no visible lines of Cr or of rare earths, but the Si I lines are present, and not exceedingly weak, especially when compared with Fe. This may be an Ap star with milder peculiarities than most other cool Ap stars.
On the other hand, the value of the effective temperature of TIC 444094235 (HD 85284), Teff = 13 640 K, appears to be wrong. This is definitely a typical Ap star, and in the sequence shown in the figures, the aspect of its spectrum would rather locate it close to Teff = 10 700 K.
One more star belongs to the group of the sharpest-lined observed stars that is illustrated in Figs. A.1–A.5: TIC 84554659 (HD 97132). The same portion of its spectrum as considered for the stars discussed above is shown in Fig. 1. This is obviously a double-lined spectroscopic binary (SB2). To the best of our knowledge, the binarity is reported here for the first time. The two components have very sharp spectral lines and appear strikingly similar to each other; they probably have nearly the same spectral type, and the same rotational velocity. However, while the lines are very sharp, neither of the two components seems to be a typical Ap star. It seems more likely that they may be Am stars that were mistakenly classified as Ap. As we do not know the radial velocity of the barycentre of the system, we have no meaningful reference to plot the spectrum in the laboratory reference system. Thus, contrary to Figs. A.1–A.5, for Fig. 1, the wavelengths have been left in the heliocentric reference system.
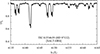 |
Fig. 1. Portion of the spectrum of the SB2 star HD 97132, obtained with SALT-HRS on HJD 2459968.455, covering the same range as in Figs. A.1–A.5. The wavelengths are in the heliocentric reference frame. |
Besides the temperature and chemical composition effects that are revealed by the intensity differences between the lines of different ions, the spectra shown in Figs. A.1–A.5 also differ from each other in terms of line profiles. Not only do they show a range of line widths, but also more complex features, which in particular reflect the presence of more or less strong magnetic fields. Most prominently, there are eight stars in which the magnetically split components of the Fe IIλ 6149 Å line are fully or marginally resolved. For these eight stars, a blown-up portion of the spectrum including the Fe IIλ 6149 Å line is shown in Fig. 2 to allow the magnetic resolution to be visualised better than at the more compressed scale of Figs. A.1–A.5. The spectra are presented in the order of decreasing magnetic field strength (see Table A.1), from top to bottom in the left column, then from top to bottom in the right column. The Zeeman patterns of the main lines present in the displayed wavelengh range are shown in Fig. 3.
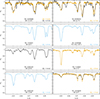 |
Fig. 2. Blown-up portion of the spectra of the eight Ap stars in which the presence of resolved, or marginally resolved, spectral lines is reported for the first time here, including the mean magnetic field modulus diagnostic line Fe IIλ 6149 Å. The CAOS spectra are plotted in black; the SALT-HRS spectra in sky blue; and the HARPS-N spectra in orange. For three stars, spectra were obtained both with HARPS-N and with CAOS. The two spectra of each pair are shown together, to illustrate the value of achieving the highest possible resolution to diagnose the magnetic field. The derived values of ⟨B⟩ appear in the bottom right corner of each panel; the CAOS spectra of BD+46 570 and of HD 96571 have insufficient resolution to determine ⟨B⟩ in these stars. The wavelengths are in the laboratory reference frame. The broad emission-like feature in the CAOS spectrum of BD+46 570 is due to an instrumental glitch. The Zeeman patterns of the lines seen in the considered spectral range are illustrated in Fig. 3. |
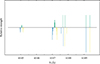 |
Fig. 3. Zeeman patterns of the main lines observed in the spectral range covered in Fig. 2: Nd IIIλ 6145.1 Å, Cr IIλ 6147.1 Å, Fe IIλ 6147.7 Å, and Fe IIλ 6149.2 Å. The amplitude of the splitting corresponds to a magnetic field strength B = 5 kG. The length of each vertical bar is proportional to the relative strength of the corresponding line component. The π components appear above the horizontal line (in green), the σ+ and σ− components below it (in blue and yellow respectively). |
The most magnetically sensitive among them is the Fe IIλ 6149 Å line. In the visible range, it is the most used diagnostic line for determination of the mean magnetic field modulus ⟨B⟩. Its characteristics have been discussed in detail by Mathys (1990). Its Zeeman pattern is a simple doublet, resulting from a transition between an unsplit level and a split level, in which each of the two π components is shifted from the line centre by the same amount as each of the single σ+ and σ− components. Among the stars shown in Fig. 2, the doublet is well resolved in the HARPS-N spectra of BD+39 4435, BD+46 570 and HD 97127, in the SALT-HRS spectrum of HD 90131, and in the CAOS spectrum of BD+39 4435, which however is noisier, hence more difficult to exploit. The resolution is more marginal, but still sufficient to untangle the two components in the SALT-HRS spectra of TYC 8912-1407-1 and of HD 151860, in the CAOS spectrum of HD 203922, and in the HARPS spectrum of HD 96571. The presence of (marginally) resolved magnetically split lines in the eight stars of Fig. 2 is reported here for the first time.
In Figs. A.1–A.5, one can also appreciate star-to-star line width differences. The latter result from a number of factors. The main ones are the spectrograph resolution, the Doppler effect due to stellar rotation, and the stellar magnetic field strength. However, in the 18 stars of Figs. A.1–A.4 that have effective temperatures Teff ≲ 9500 K, one magnetic null line, Fe Iλ 5434.5 Å, is clearly visible and mostly free from blends. This line, which has no magnetic sensitivity, also seems weakly present, albeit with a significant red blend, in the spectrum of TIC 444094235 (HD 85284), whose effective temperature is certainly overestimated (see above).
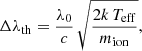
Thus, the width of the Fe Iλ 5434.5 Å line does not depend on the magnetic field. Accordingly, it is well suited to constraining the projected equatorial velocity v sin i in those stars in which it is observable. Its profile in 18 of the 19 stars of the present sample in which this is the case is shown in Fig. 4. (We omitted TIC 206461701, whose lines are visibly the broadest ones among the 19 stars of interest – see Fig. A.2.) An orange horizontal line was drawn in each panel to represent the approximate minimum value of the Full Width at Half Depth (FWHD) that is expected to be observed in the considered spectrum. There are two significant contributions to the latter that can be readily estimated: the instrumental profile and thermal broadening. The contribution of thermal broadening to the FWHD is given by:
 (1)
(1)
where λ0 is the wavelength of the observed line, c is the velocity of light, k is Boltzmann’s constant, and mion is the mass of the ion responsible for the considered transition. The instrumental contribution to the FWHD is Δλinst = λ0/R, where R is the resolving power of the spectrograph with which the observation was performed. The minimum FWHD that can be observed results from the quadratic combination of the instrumental and thermal components:
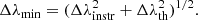 (2)
(2)
Numerically, for the observations of the Fe Iλ 5434.5 Å line with the spectrographs used in the present study, this corresponds to
 (3)
(3)
The value of w depends on the spectrograph: 1.46 10−2 Å2 for SALT-HRS, 9.76 10−3 Å2 for CAOS, and 2.23 10−3 Å2 for HARPS-N.
Not unexpectedly, the width of all line profiles illustrated in Fig. 4 is at least equal to, and often greater than, the length of the orange bar representing the estimated minimum FWHD value. Small differences between the two may partly originate from unaccounted for line broadening factors such as microturbulence (which is unknown), as well as to low enough projected equatorial velocity. They are consistent with the identification of the stars showing them as ssrAp star candidates. The stars TIC 202899762 (BD+46 570), TIC 165446000 (BD+39 4435), TIC 154786038 (HD 96571), TIC73765625 (HD 90131), and TIC 77038207 (HD 96003) show the smallest differences between the FWHD of the Fe Iλ 5443.5 Å line profile and the length of the orange bar representing the minimum line width. They all have typical Ap spectra in Figs. A.1–A.5, and four of them show resolved, or marginally resolved, magnetically split lines: the probability that they are ssrAp stars is very high. The observed profile FWHD seems to exceed slightly more the estimated minimum line width in TIC 170419024 (HD 151860), TIC 77128654 (HD 97127), TIC 352787151 (BD+35 5094), TIC 167695608 (TYC 8912-1407-1), TIC 301946105 (HD 7410), TIC 468507699 (HD 206977), and TIC 444094235 (HD 85284), but the difference between them is still small enough for these stars to be super-slow rotators, or at least to have moderately long rotation periods (20 d ≲ Prot ≲ 50 d). Again, the spectra of all of them are typical of Ap stars, and four of them show (marginally) resolved magnetically split lines. Very likely, most of them are ssrAp stars.
 |
Fig. 4. Profile of the magnetically insensitive Fe Iλ 5434.5 Å line as observed in the 18 stars of the present sample in which it is visible. The spectra are shown in order of increasing effective temperature, from left to right, then from top to bottom. The orange horizontal line at approximate mid-depth of each profile represents the estimated contribution of the instrumental profile and of thermal Doppler broadening to the line full width. An upper limit of v sin i, as given in Table A.1, is indicated at the bottom of each panel; v sin i ∼ 0 km s−1 means that the rotational broadening is below the detection limit at the achieved spectral resolution. The upper limit of v sin i was not determined for HD 174016 since it is a SB2 system for which the lines of the two components cannot be separated. For those stars for which both HARPS-N and CAOS spectra were obtained, the v sin i constraint is the one determined from the higher resolution HARPS-N spectrum. The wavelengths are in the laboratory reference frame. The deep, narrow feature at λ ∼ 5434 Å in the CAOS spectrum of TIC 163801263 is due to an instrumental glitch. |
Of the four remaining stars shown in Fig. 4, two do not have a typical Ap star spectrum: TIC 291561579 (HD 171420) and TIC 334505323 (HD 106322). We suspect that the latter has been mistakenly classified as Ap; the former may either be misclassified or be a mild Ap star (see above and Appendix A.17). By contrast, the spectrum of TIC 461161123 (HD 95811) is similar to that of Ap stars, albeit with weak or absent Cr lines. The rotational broadening of its lines is too large for it to be rotating extremely slowly. It may have a moderately long rotation period, or be an example of a near-alignment of the magnetic and rotation axes.
The case of TIC 233539061 (HD 174016) is different. The Fe Iλ 5443.5 Å line is much wider than the estimated minimum line width, but it also shows definite asymmetry. This asymmetry reflects the presence of this line in the two components of what is actually a double-lined spectroscopic binary, composed of an Ap star and of a G giant. More details are given in Appendix A.15, but at the epoch of observation (HJD 2460214.383), the spectral lines of the Ap component were blueshifted with respect to those of the giant. The Ap component is responsible for the blue dip seen in Fig. 4. This dip may be due to a line narrow enough to belong to a ssrAp star. The very low projected equatorial velocity was also confirmed by Ginestet et al. (1999), who noted that the CORAVEL (CORrelation-RAdial-VELocities) correlation peak for this component is too narrow to derive a significant v sin i estimate. This represents a very strict constraint, taking into account that magnetic broadening must also contribute to the width of this peak.
Unfortunately, for the hotter stars (Teff ≳ 9500 K), we could not identify any suitable magnetic null line. Rotation will be further discussed, on a more quantitative basis, in Appendix A.
3. Magnetic field and equatorial velocity
3.1. Mean magnetic field modulus
For the stars shown in Fig. 2, in which the Fe IIλ 6149 Å line is resolved into its two magnetically split components, the wavelength separation of these two components is proportional to the mean magnetic field modulus:
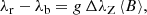 (4)
(4)
where λr and λb are the wavelengths of the red and blue line components, respectively; g = 2.70 is the Landé factor of the split level of the transition; ΔλZ = k λ02, with k = 4.67 10−13 Å−1 G−1; and λ0 = 6149.258 Å is the nominal wavelength of the transition. The wavelengths are expressed in angströms and the magnetic field in gauss.
As explained by Mathys et al. (1997), thanks to the doublet structure of the Fe IIλ 6149 Å line, the relation given in Eq. (4) is almost approximation-free. Therefore, its application allows one to determine a physically meaningful value of the mean magnetic field modulus. We also followed the method described by Mathys et al. (1997) for measurement of the wavelengths λr and λb of the split line components. Since in all stars that we analysed, these components show at least some overlap, we preferred Gaussian fitting to direct integration for these measurements. Each component was fitted with a Gaussian; a third Gaussian was added to the fit for the blending line affecting the blue wing of the Fe IIλ 6149 Å line when its contribution could significantly impact the derived values of λb and λr. Such a three-Gaussian fit was used for the stars HD 151860, TYC 8912-1407-1, and HD 97127, as well as for the HARPS-N spectrum of BD+39 4435. The Gaussian fitting technique is applicable even to observations in which the Fe IIλ 6149 Å line is almost flat-bottomed rather than showing clear splitting, such as the SALT-HRS spectrum of HD 151860 and the HARPS spectrum of HD 96571 (the resolution of the CAOS spectrum of this star is too low to use this approach). In these cases, it proves possible to fit two Gaussians of similar depth and width to the observed Fe IIλ 6149 Å line profile without major ambiguity. The validity of this approach is also demonstrated by past experience, such as the consistency of the lowest ⟨B⟩ values derived for HD 9996 and HD 18078 with the variation curve defined from consideration of the phase range at which the magnetic field of these stars is stronger (Mathys 2017).
The difficulty of determining the uncertainties of the derived ⟨B⟩ values for stars for which we have at most a handful of measurements, and more often only one, has been discussed by Mathys et al. (1997). Like these authors, we estimated the uncertainties by comparing the analysed spectra with those of stars well observed over a full rotation cycle (or at least over a wide enough range of phases), for which the uncertainties are given by the scatter of the individual measurements around a smooth variation curve. The factors taken into account in this comparison include the resolution and S/N of the spectra, the separation of the blue and red components of the Fe IIλ 6149 Å line, and the amount of blending affecting this line. Suitable reference stars abound in studies such as those of Mathys (2017) and of Giarrusso et al. (2022). While this procedure inevitably involves some degree of subjectivity, our experience suggests that the resulting uncertainty estimates should be correct to within ±30%.
The ⟨B⟩ values that we derived for the stars of Fig. 2 and their estimated uncertainties are given in Cols. 8 and 9 of Table A.1. They are further discussed in Appendix A.
3.2. Mean quadratic magnetic field and projected equatorial velocity
3.2.1. Method
For stars that do not show resolved magnetically split lines, the mean quadratic field ⟨Bq⟩ is a magnetic moment that represents a valuable alternative to the mean magnetic field modulus for the characterisation of the intrinsic strength of the stellar magnetic field, especially in the context of statistical studies of its distribution in star samples of interest. The mean quadratic magnetic field is the square root of the sum of the mean square magnetic field modulus and of the mean square longitudinal magnetic field (Mathys 1995). The latter are line-intensity weighted averages over the visible stellar disk of the square of the modulus of the magnetic vector and of the square of its component along the line of sight. In practice, the sensitivity of the mean quadratic magnetic field to the geometry of the observation is moderate, in contrast with that of the mean longitudinal magnetic field ⟨Bz⟩ (the line-intensity weighted average over the visible stellar disk of the component of the magnetic vector along the line of sight). Thus, the value of ⟨Bq⟩ is much more representative of the intrinsic stellar magnetic field strength than the value of ⟨Bz⟩.
The main observable manifestation of the mean quadratic magnetic field is the differential broadening of lines of different magnetic sensitivities. This is illustrated in Fig. 5, in which the profiles of the Fe Iλ 6335.3 Å and Fe Iλ 6336.8 Å lines are compared to each other. These lines are seen in stars with effective temperatures Teff ≲ 9500 K, except in HD 106322, HD 340577, and HD 85284 (whose effective temperature is uncertain – see above), in which the Fe Iλ 6335.3 Å line is too weak to provide useful information at the achieved S/N. The Zeeman patterns of the two Fe I lines of interest are shown in Fig. 6. The pattern spread is considerably wider for Fe Iλ 6336.8 Å than for Fe Iλ 6335.3, especially since the strongest Zeeman components of the former are the outermost ones, while in the latter, the innermost components are stronger. The Fe Iλ 6336.8 Å line is one of the most magnetically sensitive lines of the red spectrum of the Ap stars. In the eight stars of this study in which the Fe IIλ 6149 Å line is magnetically resolved, Fe Iλ 6336.8 Å shows at least a broadened, roughly flat bottom (HD 96571, HD 151860, TYC 8912-1407-1), possibly with some additional structure (HD 203922), or it is clearly split into two ‘components’ (HD 97127, BD+46 570, HD 90131, BD+39 4435). Because of the complex Zeeman pattern of the Fe Iλ 6336.8 Å transition, these ‘components’ are in fact the result of the combination of several individual components with different wavelength shifts and relative strengths. Therefore, the value of ⟨B⟩ cannot be derived in a straightforward manner from their separation, contrary to the case of the Fe IIλ 6149 Å line. Proper determination of the mean magnetic field modulus from the splitting of the Fe Iλ 6336.8 Å line would require a numerical analysis taking into account the radiative transfer effects.
 |
Fig. 5. Comparison of the profiles of the Fe Iλ 6335.3 Å and λ 6336.8 Å lines as observed in the 15 stars of the present sample in which both are well visible. The spectra are shown in order of increasing effective temperature, from top to bottom, then from left to right. The value of the mean quadratic magnetic field ⟨Bq⟩ is indicated at the bottom of each panel, for all stars in which its line broadening effect was above the limit of detection at the achieved spectral resolution. For those stars for which both HARPS-N and CAOS spectra were obtained, the ⟨Bq⟩ value is the one determined from the higher resolution HARPS-N spectrum. The wavelengths are in the laboratory reference frame. The Zeeman patterns of the lines seen in the considered spectral range are illustrated in Fig. 6. The emission feature at λ ∼ 6336 Å in the CAOS spectrum of HD 203922 is due to an instrumental glitch. |
 |
Fig. 6. Zeeman patterns of the main lines observed in the spectral range covered in Fig. 5: Fe Iλ 6335.3 Å, Fe IIλ 6336.2 Å, and Fe Iλ 6336.8 Å. The amplitude of the splitting corresponds to a magnetic field strength B = 5 kG. See the caption of Fig. 3 for more details. |
Besides the stars listed above, HD 96003 also shows a hint of broadening of Fe Iλ 6336.8 Å relative to Fe Iλ 6335.3 Å, or even some incipient splitting of the former. The two lines also appear to have different widths in HD 7410 but, in addition, they seem to be somewhat asymmetric, with a more extended blue wing, for an undetermined reason. As to the SB2 HD 174016, the two components cannot be distinguished from each other here. The observed wavelengths of the two Fe I lines suggests that they originate predominantly from the G giant primary. The other stars shown in Fig. 4, with the possible exception of BD+35 5094, do not show any conspicuous additional broadening of the Fe Iλ 6336.8 Å line.
For determination of the mean quadratic magnetic field from the observed differential magnetic broadening of spectral lines, we used the moment technique (Mathys 1995). In practice, to derive the value of ⟨Bq⟩, we applied the following formula (Mathys & Hubrig 2006):
 (5)
(5)
where a2 = ⟨Bq⟩2. In this equation, RI(2)(λI) is the second-order moment of the line profile observed in natural light (Stokes I) about its centre of gravity λI, Wλ is the equivalent width of the line, and S2 and D2 are atomic parameters characterising the Zeeman pattern of the considered transition. For details about these parameters as well as about the definition and actual measurement of RI(2)(λI), the reader is referred to Mathys (2017).
Following this author, in practice, RI(2)(λI) is measured for a sample of lines and a linear least-squares fit to these data of the form given by Eq. (5) is computed. This fit is weighted by the uncertainty of the RI(2)(λI) values measured for the individual lines, following the procedure originally introduced by Mathys (1994) for determination of the mean longitudinal magnetic field.
The difficulty in the derivation of the mean quadratic magnetic field is to disentangle the contributions of the three terms appearing on the right-hand side of Eq. (5) to the second-order moments of the Stokes I line profiles. These contributions are illustrated in Fig. 7 , in the case of the analysis of the HARPS-N spectrum of BD+39 4435, which yields the highest value of ⟨Bq⟩ derived in this study.
 |
Fig. 7. Contribution of the intrinsic (left), Doppler (centre) and magnetic (right) terms to the second-order moment about their centre of the profiles of the Fe I lines analysed in the HARPS-N spectrum of BD+39 4435. The slopes of the dashed-dotted orange lines are, respectively, the coefficients a3, a1 and a2 of the least-squares fit of the measured values of RI(2)(λI) by a function of the form given in Eq. (5). The sky blue dashed line in the centre panel represents the minimum contribution of the instrumental profile and of thermal Doppler broadening to the observed line width (see text for details). In BD+39 4435, because the rotational broadening is negligibly small, this line coincides almost exactly with the a1 slope line, from which it cannot be readily distinguished. The two lines are clearly separated from each other in stars that show significant rotation, as illustrated in Figs. 8 and 9. |
 |
Fig. 8. Same as Fig. 7, for the HARPS-N (top) and CAOS (bottom) spectra of BD+46 570. While the magnetic broadening is unambiguously seen in the right panels for both spectra, the scatter of the individual points about the respective best fit lines reflects the better precision achievable in the determination of the value of ⟨Bq⟩ at the higher resolution of HARPS-N. A much stricter upper limit on v sin i can also be set from the latter, but the picture is confused by crosstalk between the intrinsic and Doppler contributions to the line width in the analysis of the CAOS spectrum (see text for details). |
 |
Fig. 9. Same as Fig. 7, for SALT-HRS spectra of HD 90131 (at HJD 2460127.224) and HD 171420. The magnetic broadening is unambiguously seen in the former but its contribution is at most marginally significant in the latter. Conversely, HD 171420 shows definite rotational broadening, but the Doppler-like term in HD 90131 hardly exceeds the combined contributions of the intrinsic profile width and the thermal broadening. |
To build this figure, we computed a weighted fit of the values of RI(2)(λI) measured in 25 Fe I diagnostic lines to a function of the form given by Eq. (5). We isolated the contribution of each of the terms appearing on the right-hand side of this equation by subtracting from the measured values of RI(2)(λI) the fitted contributions of the other two terms. We then plotted the residuals against the relevant parameter, as follows. In the left panel of Fig. 7, [RI(2)(λI)−a1 λ02/(5c2)−a2 (3S2 + D2) ΔλZ2/4] is plotted against (Wλ2λ02/c4). The middle panel shows RI(2)(λI)−a2 (3S2 + D2) ΔλZ2/4 − a3 Wλ2 λ04/c4] against [λ02/(5c2)]. In the right panel, one sees [RI(2)(λI)−a1 λ02/(5c2)−a3 Wλ2 λ04/c4] against [(3S2 + D2)ΔλZ2/4]. The least-squares fits of the residuals against the corresponding relevant parameter are illustrated by the dashed-dotted orange straight lines. The slopes of the latter, from left to right, are respectively the fit coefficients a3, a1, and a2.
The main contribution to the second-order moments of the line profiles in the HARPS-N spectrum of BD+39 4435 is that of the second term of the right-hand side of Eq. (5). This term corresponds to the magnetic broadening. The value of the mean quadratic magnetic field can be derived from that of the fit coefficient a2:  . Its uncertainty is computed from the standard deviation σ(a2): this formal value corresponds to the line-to-line scatter about the best fit regression; it does not consider other possible sources of error. One can see from Fig. 7 that the linear dependence that determines the value of ⟨Bq⟩ is very well defined.
The second significant contribution to the moments RI(2)(λI) in the HARPS-N spectrum of BD+39 4435 comes from the third term of the right-hand side of Eq. (5). Here too, the linear dependence that constrains the value of the fit coefficient (a3) is well defined (see Fig. 7). This term corresponds to what Mathys & Hubrig (2006) refer to as the intrinsic part of the line profile. The physical meaning of this broadening contribution, which depends, in particular, on the line equivalent widths, has no relevance in the present context, but it is important to take this term duly into account to avoid overestimating the other two.
The first term of the right-hand side of Eq. (5) makes, at most, a marginal contribution to the second-order moments of the Stokes I line profiles of BD+39 4435. This term corresponds to the Doppler-like line broadening agents, which are proportional to the wavelength. (Line width proportionality to the wavelength translates into quadratic proportionality of the corresponding terms in the second-order moment of the line profile.) The a1 fit coefficient can be expanded as follows (Mathys & Hubrig 2006):
 (6)
(6)
with F = 1/(8ln2 R2). On the right-hand side of this equation, the terms, in order, account respectively for rotational Doppler broadening, instrumental broadening, thermal broadening, and all the other contributions to the line width with a Doppler-like wavelength dependence (such as microturbulence or pulsation). In general, we cannot readily determine the value of a′1, but we can calculate the instrumental and thermal terms (provided that we have an estimate of the effective temperature). By subtracting these two terms from a1, we can derive an upper limit of the projected equatorial velocity. For the Fe diagnostic lines used in this study, the numerical expression of this upper limit is:
 (7)
(7)
where ainst = 1.6205 × 10¹⁰ R−2 km2 s−2. For SALT-HRS, ainst = 40.02 km2 s−2; for FEROS, ainst = 35.17 km2 s−2; for CAOS, ainst = 26.79 km2 s−2; for ESPaDOnS, ainst = 19.18 km2 s−2; and for HARPS-N, ainst = 1.23 km2 s−2. The upper limit of v sin i that is derived by application of Eq. (7) is meaningful because typically a′1 is small.
For the HARPS-N spectrum of BD+39 4435, the upper limit of v sin i is below the detection limit (that is, it is negative, which strictly speaking makes no physical sense, but compatible with a null or very small value of the projected equatorial velocity within the uncertainties). This is illustrated in the middle panel of Fig. 7 by the sky blue dashed line. In this case, the slope of the latter, (ainst + 1.474 × 10⁻³ Teff), is almost equal to the slope a1 of the best fit line, so that both lines are almost exactly superimposed onto each other.
As one may expect, our ability to detect the magnetic and/or rotational broadening, the precision that can be achieved in the determination of the value of the mean quadratic magnetic field, and the significance with which an upper limit of the projected equatorial velocity can be set depend considerably on the spectral resolution of the observation. This is illustrated in Fig. 8, in which we compare the analysis of the HARPS-N spectrum and the CAOS spectrum of BD+46 570. In both, the contribution of magnetic broadening to the second-order moments of the Stokes I line profiles is unambiguously seen in the right panels. The greater scatter of the individual line measurement points about the straight line fit in the CAOS observations reflects the greater uncertainty of the mean quadratic field determinations achievable with this instrument compared with the HARPS-N measurement: with HARPS-N, we derive ⟨Bq⟩ = (3537 ± 148) G; with CAOS, ⟨Bq⟩ = (4029 ± 1003) G. Both values are significant, and they are mutually consistent (although they do not have to be – the magnetic field strength could plausibly have varied between the two epochs of observation). The higher uncertainty of the value derived with CAOS not only results from the lower S/N of the spectrum (to which the uncertainty is to first order inversely proportional) and to the fact that the line profiles are less well defined at lower resolution. Because of the limited resolution of CAOS, the number of lines (12) that are sufficiently free from blending to be used to diagnose the magnetic field is lower than in the HARPS-N case (20). Previous experience (for instance, Mathys 2017) has shown that in general, using a greater number of diagnostic lines allows one to achieve a higher precision in magnetic field determinations. In cases such as BD+46 570, the size of the diagnostic line samples also contributes to the differences in the uncertainties of the ⟨Bq⟩ values determined with different spectrographs.
For the HARPS-N spectrum of BD+46 570, one can also see in the left panel of Fig. 8 the tight dependence of the intrinsic part of RI(2)(λI) on the line intensity variable, Wλ2 λ04/c4. By contrast, the fit of the Doppler-like term (orange dash-dotted line) is marginally below the line showing the combination of the instrumental and thermal line broadening (sky blue dashed line), indicating that, like for BD+39 4435, the rotational Doppler effect is below the detection limit. This conclusion is consistent with the fact that the FWHD of the profile of the Fe Iλ 5434.5 Å line does not significantly exceed the length of the horizontal bar representing the contributions to the line width of the instrumental profile and of the thermal broadening (see Fig. 4).
The conclusion that rotational broadening is below the detection limit in the HARPS-N spectrum of BD+46 570 seems to be in contradiction with the result of the analysis of its CAOS spectrum. Indeed, in the middle panel of the lower row of Fig. 8, the representative points of the inferred contribution of the first term of the rigt-hand side of Eq. (5) are located well above the intrinsic and thermal broadening line. Thus rotation appears to make a significant, though poorly constrained (note the large scatter), contribution to the line width. This results from the occurrence of crosstalk between the a1 and a3 terms of the regression analysis of the CAOS spectrum of BD+46 570. This is indicated by the lack of dependence of RI(2)(λI) on the equivalent width, which does not make physical sense.
The possible occurrence of crosstalk between the a1 and a2 terms in mean magnetic quadratic field determinations has been discussed in some detail by Mathys & Hubrig (2006), who showed some examples of instances in which it probably played a role. It results from the fact that some correlation may exist between the independent variables of the two terms of interest of the right-hand side of Eq. (5). While this type of crosstalk is the most likely to present itself in the ⟨Bq⟩ determination, the fact that Mathys & Hubrig (2006) did not find any correlation between (Wλ2 λ04/c4) and the other two independent variables in the examples that they considered does not rule out the possibility of such correlations in other cases. In particular, given the wavelength depence of the intrinsic contribution to the second-order moment of the Stokes I line profiles, crosstalk between the a1 and a3 terms is more likely to occur in the case of moderate resolution spectra recorded at comparatively low S/N in which the line equivalent widths span a narrow range of values. The CAOS spectrum of BD+46 570 fulfils all these conditions.
This example serves as a warning. Critical evaluation of the results of the analysis carried out to determine the mean quadratic magnetic field is required to validate them, as far as possible. This can be done through consideration of the respective contributions of the three terms of the right-hand side of Eq. (5) using graphs such as those shown in Figs. 7 and 8 and visual inspection of the analysed spectra. In the case of BD+46 570, one can confirm from the appearance of lines with high magnetic sensitivity, such as shown in Figs. 2 and 5, that the value of ⟨Bq⟩ is almost certainly determined correctly, despite the crosstalk between the a1 and a3 terms.
In Fig. 9, we compare the results of the analysis of the SALT-HRS spectra of HD 90131 and HD 171420. The former is one of the most strongly magnetic stars of this study, as confirmed by the well resolved split components of the Fe IIλ 6149 Å line. This is reflected in the top right panel of Fig. 9 by the slope of the tight linear dependence of the magnetic part of RI(2)(λI) on the magnetic sensitivity (3S2 + D2) ΔλZ2/4. By contrast, the representative points of the Doppler-like contribution to RI(2)(λI) (top centre panel) hardly lie above the representative line of the intrinsic and thermal line broadening: rotational broadening is below the detection limit, consistently with the FWHD of the Fe Iλ 5434.5 Å line as seen in Fig. 4.
The opposite situation prevails for HD 171420: significant rotational line broadening is observed in the bottom centre panel of Fig. 9, corresponding to an upper limit v sin i ≲ 11.3 km s−1, but the mean quadratic magnetic field is below the detection limit achievable with SALT-HRS. Here too, the results of the analysis are consistent with the observed profiles of the Fe Iλ 5434.5 Å (Fig. 4) and λ 6336.8 Å (Fig. 5) lines.
3.2.2. Measurements
In practice, for determination of the mean quadratic magnetic field, a suitable set of Fe diagnostic lines was built. This set consists of lines that appear to be (almost) free from blends. Iron lines are preferred because they are present in the spectra of all Ap stars within the whole effective temperature range spanned by the ssrAp star candidates. Furthermore, experience indicates that Fe lines in Ap stars tend to undergo, at most, low-amplitude intensity variations: in most stars, the Fe distribution over the stellar surface is either uniform or shows only moderate inhomogeneitites. This ensures that the value of the magnetic field moment that is derived from analysis of a Fe line sample is as representative as possible of the actual strength and structure of the field rather than a convolution of the latter with an unknown elemental abundance distribution.
In most cases, the diagnostic lines were selected in the wavelength range ∼5400–6700 Å. This choice is based on various considerations. Blueward of 5400 Å, in most stars, the increase of the line density drastically reduces the number of lines that are sufficiently free from blends, especially in the SALT-HRS, CAOS and FEROS spectra, which have lower resolution than the HARPS-N spectra. This wavelength also approximately coincides with the dividing wavelength between the spectral ranges covered by the blue and red arms of SALT-HRS. For this instrument, we prefer to use a sample of diagnostic lines from a single arm, out of concern that different instrumental effects between one arm and the other could introduce systematic errors in the ⟨Bq⟩ determinations if we combined diagnostic lines from both arms. On the other end, above ∼6700 Å, the stellar line density drops quickly, and telluric lines abound in some wavelength intervals, so that it becomes difficult to find suitable diagnostic lines. With such limited prospects, it may actually be counterproductive to try to select diagnostic lines over a broader wavelength interval, as the magnetic field may be differently sampled at the blue and red ends of too long a range (see for instance Järvinen et al. 2020), thereby increasing the error of the ⟨Bq⟩ determination.
Most stars have low enough temperatures so that Fe I lines can be best used for determination of their mean quadratic magnetic field. However, at the hot end of the studied star sample, not enough lines of this ion are present in the spectra of HD 148330, HD 127304, HD 17330, HD 236298, HD 11187, HD 67658, and HD 44979. We used Fe II lines instead to diagnose ⟨Bq⟩ in these stars. Furthermore, in the spectra of the two hottest ones (HD 67658 and HD 44979), and in the CAOS spectrum of HD 148330, even the Fe II line density is too low in the ∼5400–6700 Å wavelength interval, so that we selected the diagnostic lines in the ∼4100–5500 Å range. Lines of Fe I from this range also had to be used for the analysis of HD 106322, given the weakness of the Fe I lines in the red part of its spectrum.
For historical reasons, SALT-HRS spectra of TYC 8912-1407-1 that can be used for determination of the mean quadratic magnetic field were recorded at five different epochs. Following Mathys (2017), we took advantage of these multi-epoch observations to untangle more efficiently the magnetic contribution (a2) to the second-order moments of the unpolarised line profiles from the instrinsic (a3) and Doppler broadening (a1) terms. Indeed, to first order, contrary to the former, the latter two can be expected to show little, if any, rotational modulation. Hence, the values of the fit parameters a1 and a3 can be determined at a higher S/N from the average over the observed phases of the second-order moments RI(2)(λI) of the diagnostic lines. By subtracting from the RI(2)(λI) values observed at each epoch the fitted intrinsic and Doppler-like contributions to the multi-epoch RI(2)(λI) average, one can then isolate the magnetic contribution to the line width at each phase from those of the other broadening agents. In practice, we applied this method in the analysis of the SALT-HRS spectra of TYC 8912-1407-1. The reader is referred to Mathys (2017) for the details of the procedure.
This approach proves particularly effective if the mean quadratic magnetic field of the studied star indeed shows significant variability between the various epochs of observations, or at least, if the magnetic broadening is large enough compared to the other line broadening terms. The former condition is not fulfilled in our series of spectra of TYC 8912-1407-1: no ⟨Bq⟩ variations are detected over the time range spanned by these observations. However, the mean quadratic magnetic field is rather strong, so that both it and the Doppler-like broadening term can be better constrained by application of the above-described two-step procedure than through separate analysis of each of the individual spectra.
By contrast, the application of this two-step method to the ESPaDOnS archive spectra of HD 127304 and HD 148330 recorded at different epochs yields physically meaningless results. Indeed, these two stars, which are not typical Ap stars (see Appendices A.14 and A.16), do not show any magnetic broadening of their spectral lines. Since they also have low projected equatorial velocities, the results of the analysis of the averages over the different epochs of the RI(2)(λI) moments of the diagnostic lines suffer from crosstalk, which leads to badly overestimated magnetic broadening. In this case, the only sensible option is to analyse each individual spectrum independently from the others. Doing so for the ESPaDOnS spectra of HD 127304 and HD 148330, we found that the mean quadratic magnetic field is below the detection threshold in all of them. The derived upper limits of the projected equatorial velocity are v sin i ≲ 7.34 km s−1 for HD 127304 and v sin i ≲ 10.23 km s−1 for HD 148330.
Further consideration of these observations would be outside the scope of this paper, since the probable non-Ap nature of HD 127304 and HD 148330 makes them irrelevant for the study of ssAp stars. Therefore, we restrict ourselves to presenting in Table A.1 the results of our analysis of the CAOS spectra of these two stars, which were obtained for the specific purpose of this project, but we omit the detailed data obtained from the ESPaDOnS spectra at individual epochs, which are without interest in the present context. The non-zero but formally insignificant value of ⟨Bq⟩ derived from the CAOS spectrum of HD 148330 reflects primarily the occurrence of crosstalk between the a2 and a3 terms of the fit of the observed second-order moments of the unpolarised line profiles by a function of the form given in Eq. (5). Indeed, the derived value of a3 is negative, which is physically meaningless, as it would indicate an anti-correlation between the intrinsic width of the spectral lines and their intensity.
3.2.3. Results
We analysed the spectra of 24 of the 25 stars shown in Figs. A.1–A.5. The exception is the SB2 system TIC 233529061 (HD 174016-7), for which we cannot untangle the lines of the two components. We also analysed a spectrum of TIC 80486647 (HD 67658), whose spectral lines are visibly broader than those of the stars appearing in the figures, but considerably narrower than those of all other ssrAp star candidates that we observed until now as part of this project. The latter are fast rotators. It will be important to understand why they were unduly identified as ssrAp star candidates in our TESS-based systematic search, but this discussion is better left to a future study.
For each of the 25 stars studied here, we determined the radial velocity vr, the mean quadratic magnetic field ⟨Bq⟩, and an upper limit of the projected equatorial velocity (v sin i)max. For the eight stars among them that show (marginal) resolution of the magnetically split components of the Fe IIλ 6149 Å line, we also derived the value of the mean magnetic field modulus ⟨B⟩. The results are presented in Table A.1. They are discussed on a star-to-star basis in Appendix A.
For the eight stars in which the Fe IIλ 6149 Å line is magnetically resolved, Fig. 10 illustrates the relation between the derived values of ⟨B⟩ and ⟨Bq⟩. This figure should be compared with Fig. 12 of Mathys (2017), from which this author established the existence of a linear relation between the two magnetic field moments, with a slope of 1.28 determined through least-squares fitting. This is the slope of the blue dashed line of Fig. 12 of Mathys (2017) and of the red dashed-dotted line plotted in Fig. 10. Each data point appearing in Fig. 12 of Mathys (2017) corresponds to the average of the values of ⟨B⟩ and ⟨Bq⟩ derived from spectra recorded at different sets of epochs. Thus, the two field moments do not sample their respective phase variation curves in the same way. By contrast, each data point in Fig. 10 corresponds to the determination of both ⟨B⟩ and ⟨Bq⟩ from a spectrum recorded at a single epoch. This figure demonstrates that the same correlation that was found from consideration of epoch-averaged data is also valid on an epoch-by-epoch basis. This result is established here for the first time. Its validity is not questioned by the only point in the figure that departs significantly from the linear trend: the low S/N of the CAOS spectrum of BD+39 4435 to which it corresponds implies that the uncertainties affecting the derived ⟨B⟩ and ⟨Bq⟩ values are exceptionally large, possibly even more than the formal error bars represent.
 |
Fig. 10. Comparison of the values of the mean magnetic field modulus ⟨B⟩ and the mean quadratic magnetic field ⟨Bq⟩ derived at individual epochs for the eight stars of this study in which the magnetically split components of the Fe IIλ 6149 Å line are resolved. Each of these stars is identified by a different symbol/colour combination, as indicated in the figure legend. The dashed-dotted red line, whose slope is 1.28, represents the relation between ⟨Bq⟩ and ⟨B⟩, as derived by Mathys (2017) (see text for details). |
4. Discussion
4.1. Rotation and chemical peculiarity
In this study, we analysed spectra of 27 ssrAp star candidates that had been identified in Paper I and Paper II, focussing on their rotation, their magnetic fields, and their binarity. The results are summarised in Table 1. Eighteen of these 27 stars are typical Ap stars with lines sharp enough to be consistent with moderately to very long rotation periods. The upper limit of the projected equatorial velocity and TESS photometric variability constraints that we derived for eleven of them indicate that they are almost certainly ssrAp stars; three more could either have Prot > 50 d (the defining criterion of super-slow rotation) or have moderately long periods (20 d ≲ Prot ≲ 50 d). The somewhat higher upper limits of v sin i and/or the detection of TESS variations for the remaining four seem to rule out super-slow rotation but are suggestive of moderately long periods. In fact, for three stars, the actual value of the period was determined: the ssrAp star HD 340577 ( ), and two stars with moderately long periods: HD 236298 (
 ) and HD 7410 (
 ). For the latter, the rotation period was known prior to this study, but this had been overlooked in Paper II.
Properties of the studied stars.
One more typical Ap star, HD 11187, which also shows rather sharp spectral lines, undergoes variations with a period of the order of a few days, whose exact value remains ambiguous. This was another oversight of our original search for ssrAp star candidates. The inclination of the rotation axis of this star to the line of sight must be low. Such configurations are expected to occur for a small fraction of the ssrAp star candidates (see Paper I for details). The presence of one such star in our sample is compatible with this expectation.
None of the remaining stars of Table 1 has a typical Ap spectrum. While their exact spectral classification remains to be definitely established, their rate of occurrence among the ssrAp star candidates from our TESS-based survey suggests that misclassification is one of the main causes responsible for spurious identification of such candidates. This strengthens the suspicion expressed in Paper III that Ap star lists, such as Renson & Manfroid (2009), tend to be significantly contaminated by spectral classification errors (even for stars that are not flagged as having uncertain chemical peculiarities), and justifies the care taken in this paper to carry out a critical evaluation of the information available about each ssrAp star candidate to ensure as much as possible that it was indeed a bona fide Ap star. However, this does not imply that all TESS-based ssrAp stars candidates for which follow-up spectroscopy indicates fast rotation are not Ap stars. Consideration of the stars of this group is outside the scope of the present study, but the confirmation of their spectral classification will be an important part of a next step of this project.
4.2. Binarity
Eight of the 18 slowly rotating Ap stars of Table 1 appear to be spectroscopic binaries. This represents a fraction of 44%, which within the limits of small number statistics, is consistent with the 51% rate of occurrence of binarity among the Ap stars with resolved magnetically split lines studied by Mathys (2017). The binarity of three of these stars, HD 17330, HD 96003 and HD 174017, had already been mentioned in the literature. To the best of our knowledge, the variability of the radial velocity of the other five is reported here for the first time. On the other hand, the HD 174016-7 system represents one of the few known cases of an Ap star in a double-lined spectroscopic binary; the seven other slowly rotating Ap binaries listed here appear to be single-lined. It will be interesting to study these systems in detail, to compare their distribution in a diagramme showing the rotation period against the orbital period with that of the other spectroscopic binaries containing a slowly rotating Ap star shown in Fig. 16 of Mathys (2017).
Among the nine stars of Table 1 that do not have typical Ap star spectra, two are also binaries. One, HD 97132, is a particularly remarkable SB2 system, whose components, which show very sharp lines, are Am stars that appear almost identical. We could not find any previous mention of this double-lined spectrum in the literature. By contrast, definite differences exist between the published values of the radial velocity of HD 127304, whose variability is fully confirmed by our measurements. The existing measurements were obtained randomly; no systematic attempt was made to characterise the orbit. We could not confirm the suggestion by Ramella et al. (1989) that HD 127304 is probably a SB2 system, but we cannot rule out this possibility.
4.3. Magnetic field distribution
In this study, we discovered eight new Ap stars in which the components of the Fe IIλ 6149 Å line are resolved or marginally resolved into their magnetically split components and we determined their mean magnetic field modulus. We were also able to derive the value of the mean quadratic magnetic field for five additional slowly rotating stars for which this field moment had never been measured. Furthermore, we identified four stars that have a low projected equatorial velocity compatible with long rotation periods in which ⟨Bq⟩ is below the detection threshold with the currently available spectra. For these, we can estimate upper limits of the field strength. A lower limit can also be set for two of them, based on mean longitudinal magnetic field measurements from the literature. One last star, HD 174016-7, appears to show line widths compatible with a very long rotation period, but it belongs to a SB2 system. At the epoch of observation, the lines of the two components were overlapping, so that it was impossible to constrain the magnetic field of the Ap star.
Thus, we have obtained new magnetic field contraints for 17 stars. Ten of them must with a very high probability be ssrAp stars; the other seven may have moderately long rotation periods. At this stage of our study, this distinction has little importance. As explained in Paper III, including stars with 20 d ≲ P ≲ 50 d in the sample of ssrAp stars used to study the distribution of the magnetic field strengths should have very little impact on the statistical conclusions that can be drawn. We can update the knowledge of this distribution that was achieved in Paper III by including the new magnetic field determinations for the 17 stars specified above. Of these 17 stars, three were already part of the sample of Paper III, but only on the basis of mean longitudinal magnetic field measurements. We can characterise the magnetic field strength of two of them in a much more meaningful way by using instead the ⟨B⟩ and ⟨Bq⟩ values derived here. In this way, we add 14 stars to the sample of ssrAp star candidates for which the magnetic field is constrained that was considered in Paper III. The latter was incorrectly stated to include 70 stars while its size actually was 71 stars, as can be inferred from consideration of Fig. 6 of Paper III. However, one of these 71 stars, HD 11187, was reported here (Appendix A.24) to be a fast rotator, and we argued that HD 148330 is not a typical Ap star (Appendix A.14). Accordingly, these two stars were excluded from the present sample, which now contains 83 stars.
Ideally, the statistical study of the distribution of the magnetic field strengths in the slowly rotating Ap stars should be based on field moment values averaged over a stellar rotation cycle. While this was possible for a rather small fraction of the stars studied in Paper III, here, there is only one star, TYC 8912-1407-1, for which more than a couple of magnetic measurements could be obtained, and even then, the resulting values are unlikely to sample the variation cycle adequately. Accordingly, the adopted field moment values on which this analysis is based are in most cases snapshots of certain rotation phases rather than rotation-averaged measurements. The reasons why this is non-critical in the present context, given the typically low amplitudes of variability of ⟨B⟩ and ⟨Bq⟩, were explained in Paper III.
We denote by B0 the reference values on which the statistical study of the distribution of the magnetic field strengths of the ssrAp stars and of the Ap stars with moderately long rotation periods is based. The reader is referred to Paper III for details about the definition of B0 according to the different types of magnetic measurements that were available in the previously studied sample. As far as the new magnetic field determinations of this paper are concerned, the following values were used. For those stars in which the value of the mean magnetic field modulus could be derived, B0 was set to this value. When ⟨B⟩ measurements at several epochs had been obtained, their average was adopted. In the case of the stars that do not show resolved magnetically split lines for which the mean quadratic magnetic field could be determined, we converted it using the relation B0 = ⟨Bq⟩/1.28 (see Sect. 3.2.3). Only the formally significant values of ⟨Bq⟩ were considered. In three stars for which both a CAOS spectrum and a HARPS-N spectrum were available and yielded formally significant ⟨Bq⟩ values, the adopted ⟨Bq⟩ value was determined from the latter, given its better spectral resolution. For two stars for which the ⟨Bq⟩ value was below the detection threshold from a CAOS spectrum (HD 17330, HD 340577), we used the lower limit of B0 = 3 ⟨Bz⟩rms derived from mean longitudinal field measurements from the literature. (The root-mean square longitudinal magnetic field ⟨Bz⟩rms, defined by Bohlender et al. 1993, is the quadratic mean over the observed phases of the mean longitudinal magnetic field values ⟨Bz⟩.) Magnetic broadening was also below the detection threshold in the analyses of a CAOS spectrum of BD+35 5094 and of a SALT-HRS spectrum of HD 95811. For these stars, we set B0 = 1.4 kG. By comparison with the other stars of this study, we estimate that this value represents a reasonable approximation of the upper limit of B0 in such cases.
Figure 11 shows the distribution of B0 after addition of the new magnetic field measurements presented in this paper to those considered in Paper III. It should be compared to Fig. 6 of the latter. It should be noted that none of the new B0 values of this study (identified by the orange colour) exceeds 6 kG. This strengthens the views that previous studies tended to overlook ssrAp stars with weak to moderate magnetic fields. While the longest rotation periods (Prot ≳ 150 d) are not found among the most strongly magnetic Ap stars (B0 ≳ 7.5 kG; Mathys 2017), the previously observed trend for super-slow rotation to occur less frequently in the most weakly magnetic Ap stars (B0 ≲ 2 kG) than in the Ap stars with moderate magnetic field strengths (3 kG ≲ B0 ≲ 7.5 kG) remains visible in Fig. 11. As argued in detail in Paper II, this effect appears particularly significant if one compares the B0 distribution in slowly rotating Ap stars with the distribution of the rms longitudinal magnetic field in all Ap stars, which peaks abruptly well below 1 kG (Bychkov et al. 2009).
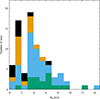 |
Fig. 11. Distribution of the phase-averaged magnetic field strength B0 for the long-period Ap stars of Table 1 of Paper I, of Table A.1 of Paper II, of Tables 1–3 of Paper III, and for which new ⟨B⟩ or ⟨Bq⟩ determinations were obtained in this study. The green, sky blue and orange parts of the histogram corresponds to the stars for which measurements of the mean magnetic field modulus or of the mean quadratic magnetic field are available; for the remaining stars (black part of the histogram), a lower limit of B0 was inferred from the existing mean longitudinal magnetic field measurements. Orange identifies the stars for which the ⟨B⟩ and ⟨Bq⟩ measurements of this paper were used. Green distinguishes the known ssrAp stars that were not identified as ssrAp star candidates on the basis of our TESS-based photometric survey. Sky blue is used for the previously confirmed ssrAp star candidates identified with TESS with ⟨B⟩ and ⟨Bq⟩ values from earlier studies. |
Figure 11 also appears to confirm and strengthen the reality of the existence of a gap, or deficiency, of slowly rotating Ap stars with (phase-averaged) field strengths between ∼2 and ∼3 kG. By contrast, the distribution of Bychkov et al. (2009) shows a strictly monotonic decrease from the lowest ⟨Bz⟩rms values to the highest ones, without any hint of a gap or a discontinuity. While the gap in the distribution of the B0 values in the ssrAp stars appears to be in the interval from ∼2.0 to ∼3.0 kG, this does not imply that it is an artefact of the chosen binning. As the total number of ssrAp stars for which magnetic measurements become available increases, the number of such stars with a field strength between ∼2.0 and ∼3.0 kG hardly grows while the neighbouring bins become more and more populated. This is a genuine observational result, not the consequence of any selection effect. The targets that are observed are just the ssrAp stars that are identified; there is no other criterion applied in the definition of the sample. Admittedly, the statistics are limited, but the more they grow, the firmer are the conclusions that can be drawn from them. A more detailed comparison of the field strength distribution revealed by our study of the ssrAp stars with the distribution for all Ap stars as established by Bychkov et al. (2009) was given in Paper II. In this reference, further supporting evidence based on the study of a volume-limited sample (Sikora et al. 2019) was also presented. The new data of the present study confirm and strengthen the conclusions reached in Paper II.
The origin of the gap in the B0 value distribution in the ssrAp stars remains unknown, but is plausibly related with the existence of two channels of formation of Ap stars, with different processes responsible for weakly and (more) strongly magnetic stars. Or possibly, if all Ap stars form in the same way, there may be two rotational braking processes allowing them to achieve slow rotation, one below ∼2 kG and the other above ∼3 kG, neither of which is efficient in the ∼2–3 kG field strength interval. The observational evidence available until now is insufficient to draw definitive conclusions. Further characterisation of the magnetic field strength distribution as well as of possible correlations between magnetic and other properties are needed to provide the basis for further theoretical developments.
The magnetic field values B0 used to build Fig. 11 were defined in such a way as to be consistent with the data presented in Fig. 6 of Paper III. In particular, for those stars for which only the mean longitudinal magnetic field could be determined until now, lower limits of B0 were used. This lower limit, B0 = 3 ⟨Bz⟩rms, is empirical. It is based on the consideration of Fig. 8 of Mathys (2017), which shows that with almost no exception, for measurements of ⟨B⟩ and ⟨Bz⟩ distributed over a stellar rotation cycle or obtained at a number of random epochs (generally different for the two magnetic field moments), one has ⟨Bz⟩rms ≥ ⟨B⟩av/3 (⟨B⟩av is the average of the individual ⟨B⟩ values over the set of measurements under consideration).
Recently, Kochukhov (2024) carried out numerical simulations in an attempt to establish, for stars having a dipolar magnetic field, statistical relationships between the polar field strength and the observable field moments ⟨Bz⟩ and ⟨B⟩. With respect to the latter two, he derived the following conversion equation:
 (8)
(8)
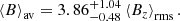
Taking this result into account, an alternative version of the distribution of the magnetic field strength B0 in the long-period Ap stars was generated, adopting the value B0 = 3.86 ⟨Bz⟩rms for those stars for which the only available magnetic field measurements are those of ⟨Bz⟩. This revised distribution is shown in Fig. 12. The interest of this representation over that of Fig. 11 is that, on a statistical basis, the values of B0 used for those stars for which only ⟨Bz⟩ measurements are available should be more consistent with those derived from ⟨B⟩ and ⟨Bq⟩ measurements. This difference concerns 11 stars out of a total sample of 83, so that its impact on the overall aspect of the figure is unavoidably limited. Nevertheless, the similarity between both figures is noteworthy, especially with respect to the absence of periods Prot ≳ 150 d in stars with B0 ≳ 7.5 kG, the lower rate of occurrence of super-slow rotation for field strengths B0 ≲ 2 kG than in the range 3 kG ≲ B0 ≲ 7.5 kG, and the deficiency of slowly rotating Ap stars with (phase-averaged) field strengths between ∼2 and ∼3 kG. The difference between the smooth behaviour of the ⟨Bz⟩rms distribution from Bychkov et al. (2009) and the apparently bimodal distribution of Figs. 11 and 12 for the ssrAp stars does not depend in any way on the value of the factor adopted to convert ⟨Bz⟩rms to B0.
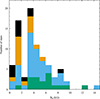 |
Fig. 12. Same as Fig. 11 but using the relation B0 = 3.86 ⟨Bz⟩rms to compute the values of B0 for those stars for which the only magnetic field moment that has been determined until now is the mean longitudinal field. These stars are still represented by the black parts of the histogram; the meaning of the other colours is unchanged. |
One thing that we do not know for sure is whether the observed gap at the low end of the magnetic field strength distribution is also present in faster rotating stars. Observations such as those presented here are ill-suited to address this question, because resolved magnetically split lines can only be observed in the stars that have the lowest projected equatorial velocity and the mean quadratic magnetic field becomes increasingly difficult to untangle from Doppler broadening as v sin i becomes increasingly large. High-resolution infrared (IR) spectroscopy would lend itself better to study the low end of the magnetic field strength distribution in Ap stars that rotate faster than those considered here. Indeed, since the Zeeman effect increases quadratically with wavelength, as opposed to the linear dependence of the Doppler effect, at equal spectral resolution, for a given field strength, the magnetic splitting can be observed in shorter period Ap stars in the IR than in the visible. The value of high resolution IR spectroscopy for determination of Ap star magnetic fields has been illustrated by Leone et al. (2003). More recently, Chojnowski et al. (2019) have observed resolved magnetically split lines in the H-band spectrum of more than 150 Ap stars, most of which have projected equatorial velocities greater than those of the Ap stars in which the Fe IIλ 6149 Å line is resolved into its components. But the lowest value of the mean magnetic field modulus that they were able to measure is ⟨B⟩ = 3.6 kG, because of the limited resolution of these IR observations. Higher resolution IR spectroscopy is required to decide if the ∼2–3 kG gap in the magnetic field distribution is limited to the most slowly rotating Ap stars or if it also exists for shorter rotation periods.
5. Conclusions
Overall, the outcome of the present study validates the technique proposed in Paper I and subsequently applied in Paper II and Paper III to carry out a systematic search for ssrAp stars from the analysis of TESS photometric observations. It also sheds light on its limitations.
As seen in Sect. 4.1, 18 of the 27 stars that were analysed in this work are definite Ap stars whose spectral lines are sharp enough to be compatible with long rotation periods. An additional Ap star, HD 11187, must have a rather short rotation period, of the order of days, but also shows moderate broadening of its spectral lines: its lack of photometric variability over the duration of a TESS sector can plausibly be assigned to the low inclination of its rotation axis to the line of sight. Given the size of the studied sample, it is not surprising that at least one star may show near-alignment of the rotation axis with the line of sight.
The lines of the remaining eight stars tend to be somewhat broader in average. More importantly, none of these stars shows a typical Ap star spectrum. We cannot rule out at this stage the occurrence of mild peculiarities in some of them, but at first sight, the available evidence rather suggests that most are stars that were misclassified as Ap. Actually, one of them, HD 97132, is a SB2 system consisting of two nearly identical, very sharp-lined Am components. Checking the exact nature of all of these stars is better left to a future study including also those TESS-based ssrAp star candidates whose spectra show broad to very broad spectral lines. However, it appears inescapable that one of the main reasons for misidentification of stars showing no TESS photometric variability as ssrAp star candidates is that the published Ap star lists are rather severely contaminated by misclassified stars of other types, such as normal A stars, Am stars, HgMn stars, or F str λ 4077 stars. This suspicion was already raised in Paper III; the evidence presented here strengthens it.
The other difficulty that has already been discussed in Paper III is to distinguish the ssrAp stars from the Ap stars that have moderately long rotation periods (20 d ≲ Prot ≲ 50 d). This difficulty arises from the fact that in the process of correcting the data for instrumental effects, the TESS pipeline may often also remove actual stellar variations occurring on timescales of the same order as the length of a TESS sector. Spectroscopic observations obtained at one or two epochs are in most cases insufficient to resolve the ambiguity. Measurements of v sin i only yield lower limits of the stellar rotation rate. Among the stars studied here, HD 95811 and HD 203922 show line broadening that appears inconsistent with super-slow rotation and rather seems indicative of a moderately long rotation period, even though analysis of the TESS raw (SAP) data does not show convincing evidence of variability. Analysis of the SAP data also reveals the occurrence of photometric variations likely due to rotation with moderately long periods for two more stars of our sample, HD 7410 ( ) and HD 236298 (
 ). However, periodic variability typical of rotation was not detected in either the SAP or PDCSAP (pipeline reduced) TESS data for HD 11187, despite the definite rotational broadening of its spectral lines and the observed variability of its mean longitudinal magnetic field on timescales of days.
The remaining 14 typical Ap stars of this study have lines sharp enough to be compatible with super-slow rotation (Prot > 50 d), but some may have somewhat shorter periods, even though analysis of the SAP data did not show convincing evidence of rotational variability for any of them. The difficulties of this analysis are abundantly illustrated in Appendix A. Even though for many of these stars, TESS observations have become available for more sectors than there were at the time when the initial systematic search for ssrAp star candidates was carried out on the basis of the PDCSAP data (Paper I and Paper II), low amplitude stellar variations standing out of the instrumental effects on timescales of a few weeks remain elusive. This does not imply that none of these stars may have a moderately long rotation period. However, for a random distribution of the inclination angles of the rotation axes to the line of sight, one should expect the vast majority of the Ap stars with lines sharp enough for consistency with periods longer than 50 days to be indeed super-slow rotators.
In other words, the 14 sharp-lined Ap stars identified in this work (listed under ‘ssrAp stars’ or ‘Long period Ap stars’ in Table 1) fufil the necesary condition to be ssrAp stars. However, observation at more epochs are needed for final confirmation that their rotation periods are indeed longer than 50 d. Photometry is poorly suited to this effect, mostly because of the difficulty of ensuring sufficient long-term stability in the measurements so as to avoid confusion between variations of stellar origin and instrumental drifts. Line-intensity variations may provide useful constraints in some Ap stars, but their occurrence is not ubiquitous, and in some cases, the variation amplitudes may be too low to allow definite conclusions to be drawn. As a rule, consideration of the magnetic field behaviour is the best-suited approach to study the variability of the ssrAp stars (Mathys 2020).
The mean quadratic magnetic field ⟨Bq⟩ and, in the most favourable cases (stars with strong enough magnetic fields observed at sufficiently high spectral resolution), the mean magnetic field modulus ⟨B⟩ can be determined from the analysis of spectra recorded in natural light. However, the relative amplitude of variation (that is, the ratio of the maximum value to the minimum) of these field moments only seldom exceeds 1.3 (for ⟨B⟩; see Mathys 2017), so that high precision measurements are required to characterise the variations in a meaningful manner. This is more easily achieved for ⟨B⟩, whose values range from ∼2 kG up and can frequently be determined with uncertainties in the ∼30–∼50 G range, and only very rarely greater than ∼100 G. The precisions with which the values of ⟨Bq⟩ can be derived is less good. Values of the internal error as low as 120 G as reported here for the analysis of the HARPS-N spectrum HD 96571 are exceptionally good; typical values are more often of the order of a few hundred gauss. On the other hand, the orders of magnitude of the mean quadratic magnetic field and of the mean magnetic field modulus are similar to each other – the former is, in average, 30% greater than the latter (see Sect. 3.2.3 and Fig. 10).
Thus, the relative precision of the ⟨B⟩ values is in general considerably better than for the ⟨Bq⟩ values: consideration of the former, when possible, represents a better way to constrain the magnetic variations of ssrAp stars. However, ⟨Bq⟩ presents the advantage that it can also be measured in stars that do not have resolved magnetically split lines, so that in principle, it gives access to weaker magnetic fields. This is illustrated by the fact that we achieved a signficant detection of a mean quadratic magnetic field as low as ⟨Bq⟩ = 1110 G through analysis of a HARPS-N spectrum of HD 96003. As argued in Sect. 3.2.3, this suggests that the mean magnetic field of this star, whose lines are unresolved, should be of the order of ⟨B⟩ ∼ 870 G. This is about half of the lowest value of the mean magnetic field modulus that we actually determined, ⟨B⟩ = 1720 G for a star showing resolved lines. The latter, in turn, matches well the estimated lower limit of the ⟨B⟩ values that can be derived from observations performed in the visible range (Mathys et al. 1997).
An aspect that the determinations of the mean magnetic field modulus and of the mean quadratic magnetic field have in common is that both strongly benefit from the usage of observations recorded at the highest spectral resolution. Determining the lowest values of ⟨B⟩ and achieving the lowest uncertainties of ⟨Bq⟩ are only feasible at resolutions such as that of HARPS-N. They are beyond reach for the lower resolution of the spectra obtained with the other instruments used in this study.
An even better way to constrain the timescales over which variability occurs in (very) slowly rotating Ap stars is the consideration of their mean longitudinal magnetic fields ⟨Bz⟩. Not only is the relative amplitude of variation of the latter often considerably greater than for ⟨B⟩ or ⟨Bq⟩ (see Fig. 9 of Mathys 2017), but also the occurrence of sign reversal in numerous stars makes unambiguous period determinations more straightforward. However, the determination of this field moment requires spectropolarimetric observations. Suitable instruments are much less numerous than natural light spectrographs, and they tend to be in higher demand. Securing observing time on them for multi-epoch observations potentially to be spread over time intervals of years, which do not lend themselves well to rapid publications of significant results, may represent a challenge on several levels. Convincing the evaluators of observing proposals that the expected scientific return is sufficient to place the project above the telescope oversubscription cutoff line in the peer review process may not be enough. Observatory policy barriers that do not affect short-term programmes may also need to be overcome.
An additional advantage of spectropolarimetric observations is their ability to detect and constrain much weaker magnetic fields than those that can be diagnosed from spectra recorded in natural light. For several stars in this study for which the mean quadratic magnetic field was below the detection threshold, the literature reports successful detections of the mean longitudinal magnetic field: HD 17330, HD 340577, and HD 11187 (which is not a ssrAp star). Even though ⟨Bz⟩ measurements are affected by additional ambiguity given their high sensitivity to the geometry of the observations, they represent the best approach for characterisation of the lowest end of the magnetic field strength distribution.
Multi-epoch observations with a view to constraining rotation from magnetic field measurements represent a genuine follow-up of the work presented here. It will also be of interest to try to constrain the strengths of the magnetic fields that were below the detection threshold with the observations obtained until now, either by recording spectra in natural light at higher resolution (and in some cases, S/N) than those that could be analysed until now, or by performing Stokes I and V spectropolarimetric observations with a view to measuring the mean longitudinal magnetic field. More generally, the ultimate goal must be to achieve the most detailed characterisation of the period and magnetic field strength distribution for the ssrAp stars, and of the possible correlations between the rotational and magnetic properties of these stars. A couple of specific questions to be answered have already been identified. Is the rate of occurrence of super-slow rotation lower among weakly magnetic stars than among strongly magnetic ones? Is there a gap between ∼2 kG and ∼3 kG in the distribution of the magnetic field strengths of the ssrAp stars? The elements of information gathered until now support these views, but further confirmation of their validity is needed to draw definitive conclusions. On the other hand, as our knowledge of the ssrAp stars improves, more questions will certainly arise.
The above-described follow-up represents one of our main objectives for the next steps of this project. In parallel, we continue to acquire spectroscopy for those ssrAp star candidates from Paper I to Paper III for which no information about the rotation period or the projected equatorial velocity is available until now. We plan to analyse these observations in the same way as the data considered in this study. This will allow us to build the largest set of confirmed ssrAp stars to date for which preliminary constraints on the magnetic field strength have been determined. This sample will lend itself to a statistical investigation of the other properties that possibly distinguish the ssrAp stars from their faster rotating counterparts, with a view to gaining theoretical understanding of the physical processes responsible for the differentiation of the rotation rates among Ap stars. It would be premature to address this issue in more detail in the present study as we have the prospect of becoming able to do it on the basis of a more complete sample in a reasonably near future (within the next couple of years). That is why, in this paper, we focussed primarily on the description of the methods that we used to analyse the observations and on the presentation of the immediate results of the measurements. Once we have analysed the spectroscopic data whose acquisition is in progress for the TESS-based ssrAp star candidates that have not been studied here, we shall devote the next paper to the presentation of the resulting measurements and to the detailed discussion of the insight that the consideration of the full data set provides into the origin of extremely slow rotation in Ap stars.
As illustrated in this paper, the present work also yielded several by-products, of which more should be delivered by the intended follow-up. Obviously, the discovery of eight new stars showing resolved magnetically split lines in the visible range is not unexpected, in a study aimed at confirming the low projected equatorial velocity of magnetic Ap stars. Nevertheless, it represents a significant addition to the sample of known Ap stars having this property, which contains of the order of 100 members.
We also reported the detection of radial velocity variations in five Ap stars that were not previously known to be part of spectroscopic binaries. The apparent existence of an intriguing connection between rotation and binarity in ssrAp stars (see Sect. 5.6 of Mathys 2017) highlights the interest of determining the orbital parameters of binaries containing a ssrAp star. Besides the five recently discovered binaries mentioned above, the sample considered in the present study contains two previously identified ssrAp binaries whose orbits have not been characterised yet. The follow-up observations to be obtained to study the magnetic variations of these seven stars will also lend themselves to deriving constraints on their orbital properties. Moreover, one should also expect the spectroscopic survey of unconfirmed TESS-based ssrAp candidates to lead to the discovery of some new spectroscopic binaries.
As an aside, we also identified a previously unknown spectroscopic binary consisting of two very similar Am stars that have very sharp spectral lines (HD 97132). While the inclusion of this target in our sample resulted from misclassification and HD 97132 is not directly relevant to our objectives, it is nevertheless a rather infrequent and scientifically interesting system that deserves further attention on its own.
Finally, the analysis carried out in this work gave us unprecedented insight into some aspects of the method of determination of the mean quadratic magnetic field. Its potential pitfalls were highlighted, the origin of some of its limitations became clearer, and precautions to be taken in its application were identified. The discussion in Sect. 3.2.1 represents a valuable complement to the detailed considerations of the original presentation of this magnetic field diagnosis approach (Mathys & Hubrig 2006), which should be taken into account in future applications.
Acknowledgments
DLH and DWK acknowledge support from the Fundação para a Ciência e a Tecnologia (FCT) through national funds (2022.03993.PTDC). Based on observations made with the Italian Telescopio Nazionale Galileo (TNG) operated on the island of La Palma by the Fundación Galileo Galilei of the INAF (Istituto Nazionale di Astrofisica) at the Spanish Observatorio del Roque de los Muchachos of the Instituto de Astrofisica de Canarias; on observations obtained with the Southern African Large Telescope under the proposal codes 2018-1-SCI-026, 2022-2-SCI-017, 2023-1-SCI-008 (PI: Holdsworth); on ESPaDOnS data retrieved from the CFHT Science Archive; and on observations collected at the European Southern Observatory under ESO programmes 081.D-2002 and 084.D-0067. We thank Martin Hall for making the reduced version of these latter data available to us. This paper includes data collected by the TESS mission. Funding for TESS is provided by NASA’s Science Mission Directorate. Resources used in this work were provided by the NASA High End Computing (HEC) Program through the NASA Advanced Supercomputing (NAS) Division at Ames Research Center for the production of the SPOC data products. This work has made use of the VALD database, operated at Uppsala University, the Institute of Astronomy RAS in Moscow, and the University of Vienna. This research has also made use of the SIMBAD database, operated at CDS, Strasbourg, France. The collocation of Figs. A.1 to A.5, of Table A.1, and of the notes on individual stars in an appendix was demanded by the A&A Editorial Office.
References
- Babcock, H. W. 1958, ApJS, 3, 141 [Google Scholar]
- Bernhard, K., Hümmerich, S., & Paunzen, E. 2020, MNRAS, 493, 3293 [NASA ADS] [CrossRef] [Google Scholar]
- Bohlender, D. A., Landstreet, J. D., & Thompson, I. B. 1993, A&A, 269, 355 [Google Scholar]
- Bramall, D. G., Sharples, R., Tyas, L., et al. 2010, Proc. SPIE, 7735, 77354F [NASA ADS] [CrossRef] [Google Scholar]
- Bychkov, V. D., Bychkova, L. V., & Madej, J. 2009, MNRAS, 394, 1338 [NASA ADS] [CrossRef] [Google Scholar]
- Catanzaro, G., Frasca, A., Alonso-Santiago, J., & Colombo, C. 2024, A&A, 685, A133 [NASA ADS] [CrossRef] [EDP Sciences] [Google Scholar]
- Chojnowski, S. D., Hubrig, S., Hasselquist, S., et al. 2019, ApJ, 873, L5 [NASA ADS] [CrossRef] [Google Scholar]
- Cosentino, R., Lovis, C., Pepe, F., et al. 2012, SPIE Conf. Ser., 8446, 84461V [Google Scholar]
- Crause, L. A., Sharples, R. M., Bramall, D. G., et al. 2014, Proc. SPIE, 9147, 91476T [CrossRef] [Google Scholar]
- Denoyelle, J. 1987, A&AS, 70, 373 [NASA ADS] [Google Scholar]
- Donati, J.-F., Semel, M., Carter, B. D., Rees, D. E., & Collier Cameron, A. 1997, MNRAS, 291, 658 [NASA ADS] [CrossRef] [Google Scholar]
- Donati, J.-F., Catala, C., Landstreet, J. D., & Petit, P. 2006, Solar Polarization 4, 358, 362 [Google Scholar]
- Elkin, V. G., Kurtz, D. W., & Nitschelm, C. 2012, MNRAS, 420, 2727 [NASA ADS] [CrossRef] [Google Scholar]
- Floquet, M. 1975, A&AS, 21, 25 [NASA ADS] [Google Scholar]
- Freyhammer, L. M., Elkin, V. G., Kurtz, D. W., Mathys, G., & Martinez, P. 2008, MNRAS, 389, 441 [NASA ADS] [CrossRef] [Google Scholar]
- Giarrusso, M., Cecconi, M., Cosentino, R., et al. 2022, MNRAS, 514, 3485 [NASA ADS] [CrossRef] [Google Scholar]
- Ginestet, N., Griffin, R. F., Carquillat, J. M., & Udry, S. 1999, A&AS, 140, 279 [NASA ADS] [CrossRef] [EDP Sciences] [Google Scholar]
- Gontcharov, G. A. 2006, Astron. Lett., 32, 759 [Google Scholar]
- Holdsworth, D. L., Smalley, B., Gillon, M., et al. 2014a, MNRAS, 439, 2078 [NASA ADS] [CrossRef] [Google Scholar]
- Holdsworth, D. L., Smalley, B., Kurtz, D. W., et al. 2014b, MNRAS, 443, 2049 [CrossRef] [Google Scholar]
- Holdsworth, D. L., Cunha, M. S., Kurtz, D. W., et al. 2021, MNRAS, 506, 1073 [NASA ADS] [CrossRef] [Google Scholar]
- Houk, N. 1978, Michigan catalogue of two-dimensional spectral types for the HD stars. Volume 2. Declinations − 530 to − 400 (Ann Arbor: University of Michigan, Department of Astronomy) [Google Scholar]
- Houk, N. 1982, Michigan Catalogue of Two-dimensional Spectral Types for the HD stars. Volume 3. Declinations − 400 to − 260 (Ann Arbor: University of Michigan, Department of Astronomy) [Google Scholar]
- Houk, N., & Smith-Moore, M. 1988, Michigan Catalogue of Two-dimensional Spectral Types for the HD Stars. Volume 4, Declinations − 260 to − 120 (Ann Arbor: University of Michigan, Department of Astronomy) [Google Scholar]
- Hubrig, S., North, P., & Schöller, M. 2007, Astron. Nachr., 328, 475 [NASA ADS] [CrossRef] [Google Scholar]
- Hubrig, S., Järvinen, S. P., Alvarado-Gómez, J. D., Ilyin, I., & Schöller, M. 2023, MNRAS, 526, L83 [NASA ADS] [CrossRef] [Google Scholar]
- Hümmerich, S., Paunzen, E., & Bernhard, K. 2016, AJ, 152, 104 [CrossRef] [Google Scholar]
- Järvinen, S. P., Hubrig, S., Mathys, G., et al. 2020, MNRAS, 499, 2734 [CrossRef] [Google Scholar]
- Kaufer, A., Stahl, O., Tubbesing, S., et al. 1999, The Messenger, 95, 8 [Google Scholar]
- Khalack, V., Gallant, G., & Thibeault, C. 2017, MNRAS, 471, 926 [NASA ADS] [CrossRef] [Google Scholar]
- Kniazev, A. Y., Gvaramadze, V. V., & Berdnikov, L. N. 2016, MNRAS, 459, 3068 [NASA ADS] [CrossRef] [Google Scholar]
- Kniazev, A. Y., Gvaramadze, V. V., & Berdnikov, L. N. 2017, ASP Conf. Ser., 510, 480 [NASA ADS] [Google Scholar]
- Kochukhov, O. 2024, A&A, 686, A189 [NASA ADS] [CrossRef] [EDP Sciences] [Google Scholar]
- Kochukhov, O., & Bagnulo, S. 2006, A&A, 450, 763 [NASA ADS] [CrossRef] [EDP Sciences] [Google Scholar]
- Kochukhov, O., Alentiev, D., Ryabchikova, T., et al. 2013, MNRAS, 431, 2808 [NASA ADS] [CrossRef] [Google Scholar]
- Kramida, A., Raichenko, Y., & Reader, J. NIST ASD Team 2023, NIST Atomic Spectra Database (Version 5.11) [Google Scholar]
- Kudryavtsev, D. O., Romanyuk, I. I., Elkin, V. G., & Paunzen, E. 2006, MNRAS, 372, 1804 [NASA ADS] [CrossRef] [Google Scholar]
- Kupka, F., Piskunov, N., Ryabchikova, T. A., Stempels, H. C., & Weiss, W. W. 1999, A&AS, 138, 119 [NASA ADS] [CrossRef] [EDP Sciences] [Google Scholar]
- Kurucz, R. L., & Peytremann, E. 1975, SAO Spec. Rep., 362 [Google Scholar]
- Leone, F., Vacca, W. D., & Stift, M. J. 2003, A&A, 409, 1055 [NASA ADS] [CrossRef] [EDP Sciences] [Google Scholar]
- Leone, F., Avila, G., Bellassai, G., et al. 2016, AJ, 151, 116 [NASA ADS] [CrossRef] [Google Scholar]
- Mathys, G. 1990, A&A, 232, 151 [NASA ADS] [Google Scholar]
- Mathys, G. 1994, A&AS, 108, 547 [NASA ADS] [Google Scholar]
- Mathys, G. 1995, A&A, 293, 746 [NASA ADS] [Google Scholar]
- Mathys, G. 2017, A&A, 601, A14 [NASA ADS] [CrossRef] [EDP Sciences] [Google Scholar]
- Mathys, G. 2020, in Stellar Magnetism: A Workshop in Honour of the Career and Contributions of John D. Landstreet, eds. G. Wade, E. Alecian, D. Bohlender, & A. Sigut, 11, 35 [NASA ADS] [Google Scholar]
- Mathys, G., & Hubrig, S. 2006, A&A, 453, 699 [NASA ADS] [CrossRef] [EDP Sciences] [Google Scholar]
- Mathys, G., Hubrig, S., Landstreet, J. D., Lanz, T., & Manfroid, J. 1997, A&AS, 123, 353 [NASA ADS] [CrossRef] [EDP Sciences] [Google Scholar]
- Mathys, G., Kurtz, D. W., & Holdsworth, D. L. 2020, A&A, 639, A31 [NASA ADS] [CrossRef] [EDP Sciences] [Google Scholar]
- Mathys, G., Kurtz, D. W., & Holdsworth, D. L. 2022, A&A, 660, A70 [NASA ADS] [CrossRef] [EDP Sciences] [Google Scholar]
- Mathys, G., Holdsworth, D. L., & Kurtz, D. W. 2024, A&A, 683, A227 [NASA ADS] [CrossRef] [EDP Sciences] [Google Scholar]
- Murphy, S. J., Gray, R. O., Corbally, C. J., et al. 2020, MNRAS, 499, 2701 [NASA ADS] [CrossRef] [Google Scholar]
- Preston, G. W. 1971, PASP, 83, 571 [NASA ADS] [CrossRef] [Google Scholar]
- Ramella, M., Boehm, C., Gerbaldi, M., & Faraggiana, R. 1989, A&A, 209, 233 [NASA ADS] [Google Scholar]
- Renson, P., & Manfroid, J. 2009, A&A, 498, 961 [NASA ADS] [CrossRef] [EDP Sciences] [Google Scholar]
- Romanyuk, I. I., Semenko, E. A., Kudryavtsev, D. O., Moiseeva, A. V., & Yakunin, I. A. 2017, Astrophys. Bull., 72, 391 [NASA ADS] [CrossRef] [Google Scholar]
- Romanyuk, I. I., Semenko, E. A., Moiseeva, A. V., Kudryavtsev, D. O., & Yakunin, I. A. 2018, Astrophys. Bull., 73, 178 [NASA ADS] [CrossRef] [Google Scholar]
- Romanyuk, I. I., Moiseeva, A. V., Semenko, E. A., Kudryavtsev, D. O., & Yakunin, I. A. 2020, Astrophys. Bull., 75, 294 [NASA ADS] [CrossRef] [Google Scholar]
- Romanyuk, I. I., Moiseeva, A. V., Semenko, E. A., Kudryavtsev, D. O., & Yakunin, I. A. 2022a, Astrophys. Bull., 77, 94 [NASA ADS] [CrossRef] [Google Scholar]
- Romanyuk, I. I., Moiseeva, A. V., Semenko, E. A., Yakunin, I. A., & Kudryavtsev, D. O. 2022b, Astrophys. Bull., 77, 271 [NASA ADS] [CrossRef] [Google Scholar]
- Romanyuk, I. I., Moiseeva, A. V., Semenko, E. A., Yakunin, I. A., & Kudryavtsev, D. O. 2023, Astrophys. Bull., 78, 567 [NASA ADS] [CrossRef] [Google Scholar]
- Royer, F., Gebran, M., Monier, R., et al. 2014, A&A, 562, A84 [NASA ADS] [CrossRef] [EDP Sciences] [Google Scholar]
- Różański, T., Niemczura, E., Lemiesz, J., Posiłek, N., & Różański, P. 2022, A&A, 659, A199 [NASA ADS] [CrossRef] [EDP Sciences] [Google Scholar]
- Shang, L.-H., Luo, A. L., Wang, L., et al. 2022, ApJS, 259, 63 [NASA ADS] [CrossRef] [Google Scholar]
- Sikora, J., Wade, G. A., Power, J., & Neiner, C. 2019, MNRAS, 483, 3127 [NASA ADS] [CrossRef] [Google Scholar]
- Wilson, R. E. 1953, General catalogue of stellar radial velocities (Washington: Carnegie Institution) [Google Scholar]
- Ziznovsky, J., & Romanyuk, I. I. 1990, Bull. Astron. Inst. Czechoslovakia, 41, 118 [NASA ADS] [Google Scholar]
Appendix A: Spectra, measurement results and notes on individual stars
The spectral properties of the analysed ssrAp star candidates are described in Sect. 2.2. Figures A.1 to A.5 illustrate this description.
These spectra were measured as explained in Sect. 3. The latter includes a discussion of the measurement results (Sect. 3.2.3), which are presented in Table A.1. The properties of the individual stars are discussed below.
A.1. TIC 73765625 (HD 90131)
Two SALT-HRS spectra of HD 90131 have been obtained, at epochs separated by 109 days. The two components of the Fe IIλ 6149 Å line are clearly resolved and the line is almost free from blending (see Fig. 2). Accordingly, the mean magnetic field modulus was determined with the highest precision that is achievable with HRS. Good precision was also achieved in the determination of the mean quadratic magnetic field, as more than 20 clean diagnostic lines of Fe I were identified in the red arm spectral range. Neither of the two field moments shows any significant variability between the two epochs of observation. The upper limit of the projected equatorial velocity derived from the first epoch spectrum, v sin i ≲ 3.43 km s−1 is small enough to be compatible with super slow rotation. The second epoch spectrum does not show any significant rotational broadening, consistently with the width of the Fe Iλ 5434.5 Å line seen in Fig. 4. The spectroscopic evidence strongly supports the conclusion that HD 90131 must be a ssrAp star. On the other hand, while its radial velocity is greater than that of the majority of single Ap stars, there is no indication of variability.
SAP data are available for TIC 73765625 for Sectors 22, 45, 46 and 49. Sectors 22 and 49 suffer strong instrumental excursions up to 8 mmag in range. The S45-46 data are cleaner, and are used here for a constraint on possible rotational light variations. The two sectors comprise 34164 data points after the removal of 96 problematic points (outliers or obvious instrumental excursions). Figure A.6 shows the light curve and amplitude spectrum of the SAP data. The visible variations and both of the low-frequency peaks are plausibly instrumental in origin. The two low frequency peaks are significant and have periods of  and
and  , but for rotational variations in α2 CVn stars we expect only one rotational peak and that is usually at much higher amplitude than these two peaks, which have amplitudes of only 160 μmag. We also find the same light variations and two peaks for S45-46 data for the next star, TIC 77038207, showing that these peaks are instrumental in origin. We therefore conclude that there is no rotational variation visible over the 52.4-d time span of S45-46, supporting the identification of TIC 73765625 as a ssrAp star.
A.2. TIC 77038207 (HD 96003)
With more than 30 suitable Fe I diagnostic lines, the high-resolution spectrum of HD 96003 recorded with HARPS-N lends itself well to a very precise determination of the mean quadratic magnetic field. With ⟨Bq⟩ = 1.1 kG, this is the weakest field that we could definitely detect in this study. It is well below the detection limit with CAOS. The distortion of the Fe Iλ 6336.8 Å line by the magnetic field is clearly seen in the HARPS-N spectrum (see Fig. 5) but the Fe IIλ 6149 Å line is not resolved into its magnetically split components so that the mean magnetic field modulus cannot be precisely determined. The quadratic field value is consistent with the weak mean longitudinal magnetic field measurements obtained at the Special Astrophysical Observatory (Romanyuk et al. 2023, and references therein), according to which ⟨Bz⟩ shows at most low-amplitude variability about its rms value, ⟨Bz⟩rms = −170 G.
Romanyuk et al. also report the occurrence of variations of the radial velocity, and argue that HD 96003 is a spectroscopic binary. This conclusion is supported by the formally significant difference between the values of the radial velocity that we determine from the CAOS and HARPS-N spectra, which were obtained only 10 days apart. These values are within the range covered by the measurements of Romanyuk et al. (2023).
Our mean quadratic magnetic field determination with HARPS-N did not yield a significant value of the projected equatorial velocity. This suggests that rotational broadening of the spectral lines must be substantially less than the HARPS-N resolution, consistently with the profile of the Fe Iλ 5434.5 Å line illustrated in Fig. 4. This confirms that HD 96003 must be a ssrAp star. (The somewhat high value of the upper limit, v sin i ≲ 6.0 km s−1, derived from the analysis of the CAOS spectrum appears to result from crosstalk between the a1 and a3 terms of the regression analysis.)
SAP data are available for TIC 77038207 for Sectors 22, 45, 46 and 49, as for the previous star, TIC 73765625. The light curve and the amplitude spectrum for TIC 77038207 for the S45-46 data are essentially identical to those for TIC 73765625, showing that the variations are instrumental. We therefore conclude that there is no rotational variation visible over the 52.4-d time span of S45-46, supporting the identification of TIC 77038207 as a ssrAp star.
A.3. TIC 77128654 (HD 97127)
The Fe IIλ 6149 Å line is resolved into its magnetically split components in our HARPS-N spectrum of the roAp star HD 97127 (Holdsworth et al. 2014b). The considerable blending of the blue component (see Fig. 2) induces significant uncertainty in the determination of the mean magnetic field modulus. Its derived value, ⟨B⟩ = 2.5 kG, is among the lowest ever measured in an Ap star (see Mathys 2017). The mean quadratic magnetic field, ⟨Bq⟩ = 3.1 kG, can be determined with good precision. The value of the upper limit of the projected equatorial velocity that can be derived as a by-product, v sin i ≲ 3.95 km s−1, is not inconsistent with super-slow rotation, but a moderately long rotation period (20 d ≲ Prot ≲ 50 d) cannot be ruled out.
SAP data are available for TIC 77128654 for Sectors 22, 45, 46 and 49, the same as for the previous two stars. Sectors 22, 46 and 49 suffer strong instrumental excursions up to 60 mmag in range. To illustrate the problem of using the SAP data for the detection of long rotation periods, as in the ssrAp stars, the top panel of Fig. A.7 shows the unedited light curve for the S45-46 data. The large excursions for the S46 data occurred after the field was recovered following a data transfer to ground. Immediately after a field is recovered, the detectors are still temperature stabilising resulting in sensitivity changes. These are modelled and removed in PDCSAP data, but are still seen in the SAP data shown here. Figure A.7 shows the raw light curve (top), the edited light curve (middle) and the amplitude spectrum of the SAP data. All variations are plausibly instrumental in origin. We therefore conclude that there is no rotational variation evident over the 52.4-d time span of S45-46.
 |
Fig. A.1. Portion of the spectrum of 5 sharp-lined ssrAp star candidates. The wavelengths are in the laboratory reference frame. |
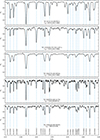 |
Fig. A.2. Portion of the spectrum of 5 sharp-lined ssrAp star candidates. The wavelengths are in the laboratory reference frame. |
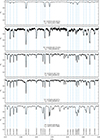 |
Fig. A.3. Portion of the spectrum of 5 sharp-lined ssrAp star candidates. The wavelengths are in the laboratory reference frame. |
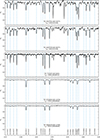 |
Fig. A.4. Portion of the spectrum of 5 sharp-lined ssrAp star candidates. The wavelengths are in the laboratory reference frame. |
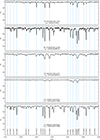 |
Fig. A.5. Portion of the spectrum of 5 sharp-lined ssrAp star candidates. The wavelengths are in the laboratory reference frame. |
Measurements of the spectra of the ssrAp star candidates.
A.4. TIC 80486647 (HD 67658)
According to a recent study (Murphy et al. 2020), HD 67658 is a normal A4IV star. Hence, it must have been misclassified as an Ap star. Indeed, lines of the elements typically present in Ap stars do not appear to be present in its HARPS-N spectrum. Visual inspection of the latter also reveals that HD 67658 has the broadest spectral lines among the stars of studied in this work. Of these stars, it is also the one for which we derived the least stringent upper limit of the projected equatorial velocity, v sin i ≲ 28.43 km s−1. With a mean quadratic magnetic field below the detection threshold, HD 67658 is definitely not a ssrAp star, and probably not even an Ap star at all. There is no plausible variation in the S7, 9 and 35 SAP data, hence no α2 CVn rotational variation, also suggesting that this is not an Ap star.
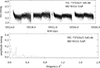 |
Fig. A.6. TIC 73765625 (HD 90131). Top: The light curve of the S45-46 SAP data. The visible variations are plausibly instrumental. Bottom: The amplitude spectrum of the S45-46 SAP data showing two low-frequency peaks, both of which are plausibly instrumental. |
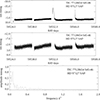 |
Fig. A.7. TIC 77128654 (HD 97127). Top: The light curve of the S45-46 SAP data without editing the data. The instrumental excursions in S46 are evident. S22 and S49 suffer similar excursions. This is not uncommon in the SAP data. Middle: The S45-46 SAP data after the larger instrumental excursions are filtered out. Bottom: The amplitude spectrum of the edited S45-46 SAP data showing two low-frequency peaks, both of which are plausibly instrumental. |
A.5. TIC 81554659 (HD 97132)
We observed HD 97132 with SALT-HRS and discovered that it is a double-lined spectroscopic binary (SB2). To the best of our knowledge, this has never been reported before. The two components appear to be nearly identical to each other. Although the star has been classified ApSrEuCr (Houk 1978), we could not readily identify in its spectrum strong lines of these elements, or of other rare earth elements. There is no plausible variation in the Sector 10, and 36-37 SAP data, hence no α2 CVn rotational variation, also suggesting that this is not an Ap star.
We carried out a preliminary abundance analysis through spectrum synthesis, similar to Catanzaro et al. (2024). We adopted the same fundamental parameters for both components, log g = 4.0 and Teff = 8250 K, which is lower than the value from the TIC (Teff = 9257 K). This temperature matches better the intensity ratio of the Fe I and Fe II lines and the Balmer line profiles. Some portions of the synthetic spectrum are shown in Fig. A.8. This analysis indicates that in both stars, the C and O abundances are solar, Ca and Sc are underabundant, and Si, Fe, and Ba are overabundant. Thus HD 97132 is a SB2 system consisting of two Am stars.
A.6. TIC 124988213 (HD 44979)
The line density in the spectrum of HD 44979 is low, and most lines are weak. Accordingly, our attempt to determine the mean quadratic magnetic field from a SALT-HRS spectrum was based on the analysis of the blue arm part. The upper limit that we derived for the projected equatorial velocity, v sin i ≲ 16.26 km s−1, is consistent with the moderately broadened appearance of the spectral lines. This is not a ssrAp star. Moreover, the mean quadratic magnetic field is below the detection threshold. One may wonder if the ApSi classification (Houk 1982) of HD 44979 is mistaken, as the Si lines in its spectrum do not appear particularly strong.
SAP data are available for TIC 124988213 for Sectors 6-7. Fig. A.9 shows the light curve and amplitude spectrum. All variations are plausibly instrumental. This also suggests that the star is not an α2 CVn star, hence not an Ap star.
A.7. TIC 154786038 (HD 96571)
Two observations of HD 96571 were obtained, one with CAOS and the other with HARPS-N, at an interval of 211 days. There is a highly significant difference of radial velocity (Δvr = 13.5 km s−1) between the two epochs. This represents a strong indication that the star must be a spectroscopic binary, which has not been previously identified. The radial velocity recorded with HARPS-N does not significantly differ from the value published in the General Catalogue of Stellar Radial Velocities (Wilson 1953).
In the HARPS-N spectum, the Fe IIλ 6149 Å line is only marginally resolved, but it is free from blends (see Fig. 2). This allowed us to determine the mean magnetic field modulus, ⟨B⟩ = 1.7 kG. This value is similar to the lower limit predicted by Mathys et al. (1997) for measurements of the mean magnetic field modulus from spectra at a resolving power R ∼ 105. Because of the marginal resolution of the Fe IIλ 6149 Å line, the estimated uncertainty of the ⟨B⟩ determination, 100 G, is greater than for higher mean field modulus values that can be derived in the best cases from the analysis of spectra of similar resolution (down to ∼25 G, see Table 13 of Mathys 2017).
By contrast, the formal precision achieved in the determination of the mean quadratic magnetic field from the HARPS-N spectrum is the best one of this study. The distortion of the Fe Iλ 6336.8 Å line by the magnetic field is clearly seen in Fig. 5. The value of ⟨Bq⟩ determined from analysis of the CAOS spectra is also just above the threshold of formal significance. Within the uncertainties, the mean quadratic field modulus has not varied between the two epochs of observations. However, this is a weak constraint, as for the CAOS spectrum, the formal uncertainty of ⟨Bq⟩ is rather large.
The upper limit of the projected equatorial velocity that is derived from analysis of the HARPS-N spectrum, v sin i ≲ 2.56 km s−1, is consistent with super slow rotation, but a moderately long rotation period (20 d ≲ Prot ≲ 50 d) cannot be definitely ruled out. Within the uncertainty, the analysis of the CAOS spectrum yields a v sin i upper limit that is not significantly different. In summary, all the available information consistently indicates that HD 96571 must be a slowly rotating Ap star in a binary system.
SAP data are available for Sectors 14, 19-20, 26, 40 and 53. There is a probable instrumental variation with an amplitude of only 0.5 mmag on the timescale of 30 d, which is close to the sector length. This does not support any photometric variation in the 20 d ≲ Prot ≲ 50 d range.
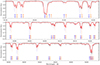 |
Fig. A.8. Synthetic spectrum of the SB2 star HD 97132, for selected wavelength ranges. The thin solid black line is the observed spectrum; the thick solid red line is the synthetic spectrum for the combination of the two components. The synthetic spectra of each individual component is represented by the thin dashed blue and red lines. The ions responsible for the fitted transitions are identified in the Kurucz notation (Kurucz & Peytremann 1975). |
A.8. TIC 163801263 (HD 203922)
The Fe IIλ 6149 Å line is marginally resolved into its two components in our CAOS spectrum of HD 203922. It is not significantly affected by any blend (see Fig. 2). Accordingly, the value of the mean magnetic field modulus, ⟨B⟩ = 3.46 kG, could be determined with rather good precision. The mean quadratic magnetic field, ⟨Bq⟩ = 3.31 kG, could also be measured at the 4.0 σ level. Given their respective uncertainties, the values of the two field moments are mutually consistent. The ⟨Bq⟩ analysis also yielded an estimate of the upper limit of the projected equatorial velocity, v sin i ≲ 5.27 km s−1. Indeed, in Fig. 4, the observed profile of the Fe Iλ 5434.5 Å line appears somewhat broader than the estimated contributions of instrumental and thermal broadening. This difference is not necessarily incompatible with super slow rotation, but it seems more likely that HD 203922 has a moderately long rotation period.
SAP data are available for Sectors 15 and 55. Figure A.10 shows the light curve and amplitude spectrum of the S55 SAP data. There is variability with an amplitude of 0.5 mmag on a timescale of ∼22 d for the S55 data. This signal is neither evident nor ruled out for the S15 data, and the two sectors are too far apart in time to meaningfully analyse them together. Hence, it is possible that this star has a moderate period of the order of 22 d, although the signal could also be instrumental. The similarity to the light curves and amplitude spectra for the next star, TIC 165446000, which was observed in the same sectors with the same camera suggests that the variability for both stars is instrumental.
A.9. TIC 165446000 (BD+39 4435)
The HARPS-N spectrum of BD+39 4435 was obtained 265 days after its CAOS spectrum. The two components of the Fe IIλ 6149 Å line are magnetically resolved in both of them (see Fig. 2). The measurements of this line in the two spectra yield substantially different values of the mean magnetic field modulus. While the ⟨B⟩ variability that they reflect appears real, their uncertainties, which are large as the spectra are noisy (especially the CAOS one), may be partly responsible for the apparently large variation amplitude. This is all the more plausible since the mean quadratic magnetic field, which could also be determined at both epochs, suggests more moderate variability; however, it is also difficult to constrain precisely due to the large formal uncertainty of the ⟨Bq⟩ value derived from the CAOS spectrum.
In any event, the observed ⟨B⟩ and ⟨Bq⟩ variations do not rule out super slow rotation, given the long time interval on which they occurred. Moreover, no formally significant rotational broadening could be detected as part of the ⟨Bq⟩ analysis of either spectrum. Thus, it is highly probable that BD+39 4435 is a ssrAp star.
SAP data are available for Sectors 15 and 55. Figure A.11 shows the light curve and amplitude spectrum of the S15 SAP data. There is variability with an amplitude of 1.0 mmag on a timescale of ∼23 d for the S15 data. The S55 data show a larger instrumental drift. Hence, it is possible that this star has a moderate period of the order of 23 d, although the signal could also be instrumental. The similarity to the light curves and amplitude spectra for the previous star, TIC 163801263, which was observed in the same sectors with the same camera suggests that the variability for both stars is instrumental.
A.10. TIC 167695608 (TYC 8912-1407-1)
Five good SALT-HRS spectra of the roAp star TYC 8912-1407-1 (Holdsworth et al. 2014a) were obtained. The first one was recorded 146 days before the second one; the last four span a time interval of only 12 nights.
All five spectra show the Fe IIλ 6149 Å line marginally resolved into its two magnetically split components. As in many Ap star spectra, the Fe IIλ 6149 Å line is blended on the blue side by the line of an unidentified ion probably pertaining to a rare earth element (see Fig. 2). In TYC 8912-1407-1, the strength of this blend tends to be above average, but it is separated enough from the blue component of Fe IIλ 6149 Å to allow it to be untangled reasonably well. We estimate the resulting uncertainty affecting the derived values of the mean magnetic field modulus to be of the order of 100 G. Within this uncertainty, no definite variation of ⟨B⟩ is detected.
As described in Sect. 3.2.2, we took advantage of the availability of five observations of TYC 8912-1407-1 to achieve better precision in the derived values of the mean quadratic magnetic field. One can indeed note in Table A.1 that the formal uncertainties of the ⟨Bq⟩ values for this star are lower than for any other star observed with SALT-HRS. Even with these rather low uncertainties, no significant variations of the mean quadratic magnetic field are detected between the considered epochs.
The applied procedure also allows in principle better precision to be achieved in the determination of the upper limit of v sin i. This limit, v sin i ≲ 1.96 km s−1, is very low, hence consistent with the identification of TYC 8912-1407-1 as a ssrAp star.
SAP data are available for Sectors 1-13, 27-39, and 61-68, as TIC 167695608 is in the southern continuous viewing zone. There is no indication of any rotational variability, consistent with this being a ssrAp star.
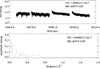 |
Fig. A.9. TIC 124988213 (HD 44979). Top: The light curve of the S6-7 SAP data. Bottom: The amplitude spectrum of the S6-7 SAP data. All variations are plausibly instrumental. |
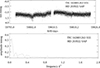 |
Fig. A.10. TIC 163801263 (HD 203922). Top: The light curve of the S55 SAP data. Bottom: The amplitude spectrum of the S55 SAP data. The low frequency peak has a period of ∼22 d. It could be the rotation period, or it could be instrumental. |
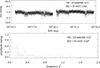 |
Fig. A.11. TIC 165446000 (BD+39 4435). Top: The light curve of the S15 SAP data. Bottom: The amplitude spectrum of the S15 SAP data. The low frequency peak has a period of ∼23 d. This could be rotation period, or it could be instrumental. Its similarity to that of TIC 163801263 above suggests an instrumental origin. |
A.11. TIC 170419024 (HD 151860)
The Fe IIλ 6149 Å line is marginally resolved into its magnetically split components in our SALT-HRS spectrum of HD 151860. The unidentified blend affecting its blue component (see Fig. 2) somewhat complicates the determination of the mean magnetic field modulus. The difference between its value, derived from the fit of three Gaussians, ⟨B⟩ = 3.4 kG, and the 2.5 kG value determined by Kochukhov et al. (2013) through spectrum synthesis analysis of an observation obtained ∼13 years earlier, seems significant and representative of actual variability. The fact that the Fe IIλ 6149 Å line does not show any hint of magnetic resolution in the FEROS spectrum analysed here, which was recorded ∼14.5 years before our SALT-HRS spectrum, lends further support to this interpretation.
The value of the mean quadratic magnetic field that we derive from this FEROS spectrum, ⟨Bq⟩ = 2.5 kG is fully consistent with the field determination of Kochukhov et al. (2013). Both are much lower than the value based on the SALT-HRS observation, ⟨Bq⟩ = 5.4 kG, which however is affected by a considerably higher uncertainty. The ⟨Bq⟩/⟨B⟩ value derived from this spectrum also lies further above the linear ⟨Bq⟩ vs ⟨B⟩ relation illustrated in Fig. 10 than for any other star of this study. However, this deviation remains compatible with the error bars. Furthermore, the distortion shown by the profile of the Fe Iλ 6336.8 Å line is indicative of the presence of a rather strong magnetic field. Thus, the difference between the ⟨Bq⟩ values derived from the 2008 and 2023 spectra appears to reflect real variations of the magnetic field.
On the other hand, the value of the projected equatorial velocity determined by Kochukhov et al. (2013), v sin i = 4.5 km s−1, seems definitely too large compared to the upper limits set from our analysis. We obtained v sin i ≲ 1.87 km s−1 from consideration of the FEROS spectrum while magnetic broadening is below the detection threshold in the SALT-HRS spectrum. These results, which hint at a value of v sin i significantly lower than 4.5 km s−1, are further supported by the appearance of the Fe Iλ 5434.5 Å line (see Fig. 4), whose FWHD hardly exceeds the estimated intrinsic line width. The absence of a detectable rotation signature in the pulsation anaysis of HD 151860 Holdsworth et al. (2021) also tends to favour a long period.
Moreover, HD 151860 appears to be a spectroscopic binary. Indeed, the radial velocity has significantly changed between the epochs of the FEROS (vr = −0.82 km s−1) and SALT-HRS (vr = 4.10 km s−1) observations. Thus, while no constraints can be set on the orbital period, HD 151860 is most probably another case of a ssrAp star in a binary system.
SAP data are available for Sectors 12 and 39. The S12 data show a strong slope; the S39 data have instrumental variations. Together a best fit is found for Prot = 40 d, but it is messy and unconvincing. Figure A.12 shows the two sectors phased with Prot = 100 d strictly for illustrative purposes. The available SAP data are consistent with this being a ssrAp star.
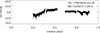 |
Fig. A.12. TIC 170419024 (HD 151860). The SAP light curves for Sectors 12 and 39 are phased with Prot = 100 d. This is simply to show what the problems are with the data and to indicate that if there is rotational variability, it is consistent with a ssrAp star. There is no claim that 100 d may be the period, or even close to it. |
A.12. TIC 202899762 (BD+46 570)
The radial velocity of BD+46 570 shows a small but significant variation between the CAOS and HARPS-N spectra of this star, which were obtained 425 days apart. In the HARPS-N spectrum, the Fe IIλ 6149 Å line is well resolved into its two components, and it is free from significant blends (see Fig. 2), so that the mean magnetic field modulus can be determined with the best estimated precision of the present study. If the field strength was of the same order (⟨B⟩ = 3.4 kG) at the time of the CAOS observation, one could expect Fe IIλ 6149 Å to be also marginally resolved in that spectrum. This is not the case, but it may be due to the rather low S/N rather than to magnetic field variability.
The mean quadratic magnetic field is precisely determined through analysis of the HARPS-N spectrum. The magnetic distortion of the Fe Iλ 6336.8 Å line in this spectrum is particularly remarkable. A formally significant value of ⟨Bq⟩ is also derived from the CAOS observation of BD+46 570, albeit with a large uncertainty. Due to the latter, the possible variability of ⟨Bq⟩ cannot be constrained in a meaningful manner. Mean longitudinal magnetic field measurements from Kudryavtsev et al. (2006) and from Romanyuk et al. (2020) do not reveal any definite variations either.
Rotational broadening is below the detection limit in the HARPS-N spectra, consistent with the observed profile of the Fe Iλ 5434.5 Å line (see Fig. 4). The high value of the upper limit of the projected equatorial velocity set from analysis of the CAOS spectrum, v sin i ≲ 8.36 km s−1 definitely results from crosstalk between the a1 and a3 terms of the linear regression. Indeed, the latter does not identify any dependence of RI(2)(λI) on Wλ2 λ04/c4, which is physically meaningless. As no variations of any of the studied magnetic field moments were detected, BD+46 570 appears to be another example of a ssrAp star in a binary system.
SAP data are available for Sector 18 only. There is no indication of rotational variablity.
A.13. TIC 206461701 (HD 209364)
Despite the good quality of the SALT-HRS spectrum of HD 209364, its mean quadratic magnetic field is below the detection limit. The v sin i upper limit that is derived for this star is higher than for most other targets of this study. The rotational broadening of the spectral lines is actually clearly seen even at the compressed scale of Fig. A.2. No lines show any hint of magnetic resolution. More strikingly, the absence of the Cr IIλ 6147.1 Å line from the spectrum of this star, together with the weakness of the Nd IIIλ 6145.1 Å line, suggests that the classification of HD 209364 as ApSrEuCr (Houk & Smith-Moore 1988) may be mistaken.
SAP data are available for Sectors 1 and 68 only. There is no indication of rotational variability in the S1 data. The S68 data have a slope that may be instrumental. The best fit to the two sectors together is for Prot = 50 d, but that is plausibly instrumental.
A.14. TIC 207468665 (HD 148330)
The spectrum of HD 148330 does not show any of the lines typically observed in the Ap stars of similar temperature (see Fig. A.4). Even though Khalack et al. (2017) found moderate, but not extreme, overabundances of a number of elements, HD 148330 does not look like a typical Ap star. In fact, Floquet (1975) had already noted inconsistencies in the appearance of the lines used for peculiarity identification in spectral classification studies and the possible variability of some of them. Furthermore, not only no formally significant mean quadratic magnetic field value was derived from the analysis of 12 ESPaDOnS archive spectra (see Sect. 3.2.2) nor of the CAOS spectrum specifically obtained in the framework of this project, but also the root mean square value of the mean longitudinal magnetic field, ⟨Bz⟩rms = (20 ± 11) G, determined from the same ESPaDOnS spectra, does not significanly differ from zero. This is a stringent limit, which shows that HD 148330 does not have the kind of magnetic field that is found in typical Ap stars. The ⟨Bz⟩ values derived by Khalack et al. (2017) from two of the ESPaDOnS spectra from the series that we analysed, which have a much higher uncertainty than our measurements, are not formally significant. Neither are most of the individual values of this field moment determined by Ziznovsky & Romanyuk (1990), whose uncertainties are even larger; the argument given by these authors that ⟨Bz⟩ phases with the photometric variations is not valid since such variations are not detected from the much higher precision TESS data Paper II. Finally, the upper limit of the projected equatorial velocity derived from analysis of the ESPaDOnS spectra, v sin i ≲ 10.23 km s−1, which is consistent with the value reported by Khalack et al. (2017), v sin i = (9.8 ± 1.0) km s−1, indicates that HD 148330 is not a super-slow rotator.
SAP data are available for many sectors: S16, 19, 23-25, 49-52, 56 and 76. Despite the non-negligible rotational line broadening, there is no convincing rotational variability seen in these SAP data, consistent with the indications that this is not an Ap star.
A.15. TIC 233539061 (HD 174016-7)
The SB2 system HD 174016-7 has been studied in detail by Ginestet et al. (1999). The secondary component, HD 174017, is an A0p SrCrEuSi star, which completes its orbit around the G6 III primary, HD 174016, in 3097.9 d. A HARPS-N spectrum of this system was obtained at orbital phase 0.10, at which the radial velocity difference between the two components must be of the order of 3.5–4 km s−1 (see Fig. 2 of Ginestet et al. 1999). In our spectrum, some Fe lines of the Ap component can indeed be distinguished as a blue blend in the blue wing of the Fe lines of the G giant (which is the brighter star). This is, for instance, the case for the Fe Iλ 5434.5 Å line, as can be seen in Fig. 4. The contributions of the two components to the observed Fe lines cannot be disentangled, so that there is no possibility to diagnose the mean quadratic field modulus or the projected equatorial velocity for the analysis of these lines, as was done in other stars of this study. Nevertheless, the Fe lines of HD 174017 seem to be sharp enough so that this may be a ssrAp star.
SAP data are available for many sectors: S14-17, 19-26, 40-41, 47, and 55-55. There is no convincing rotational variability seen in these SAP data.
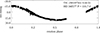 |
Fig. A.13. TIC 298197561 (HD 340577). There are four sectors of SAP data plotted here, S14, 15, 41, and 55. Here they have been phased with a rotation period of |

A.16. TIC 286965228 (HD 127304)
The case of HD 127304 is, to some extent, similar to that of HD 148330. Its spectrum also fails to show the characteristic lines generally found in Ap stars of similar temperature (see Fig. A.4). Here, too, the analysis of three ESPaDOnS archive spectra and of one CAOS dedicated spectrum failed to detect any formally significant mean quadratic magnetic field. A null value of the root mean square longitudinal magnetic field is also determined from the ESPaDOnS spectra, ⟨Bz⟩rms = (9 ± 7) G.
However, HD 127304 definitely shows radial velocity variations: the values that we measured range from vr = −26.2 km s−1 to vr = −2.1 km s−1; Royer et al. (2014) determined vr = −22.3 km s−1; and Gontcharov (2006) give vr = −12.6 km s−1. Ramella et al. (1989) suspect that this may be an Am SB2. Nevertheless, we do not readily see evidence of the secondary lines in the spectra that we analysed. The sets of diagnostic lines that we measured in each spectrum are internally consistent in terms of radial velocity, so that these lines must pertain to a single component. The resulting upper limit of the projected equatorial velocity, derived from the ESPaDOnS spectra, v sin i ≲ 7.34 km s−1, does not support the view that this component, whether it is an Ap star or not, rotates super slowly.
SAP data are available for Sectors 23 and 50. There is no convincing rotational variability seen in these SAP data, which supports the view that HD 127304 is probably not an Ap star.
A.17. TIC 291561579 (HD 171420)
At the 2.2σ level, the value of the mean quadratic magnetic field that is derived from the analysis our SALT-HRS spectrum of HD 171420 is not formally significant . However, inspection of the regression plots (Fig. 9) suggests that it should be readily measurable at somewhat higher resolution, with a probable value of the order of 1.5 kG. It would be interesting to confirm this, to test whether HD 171420 is a mild Ap star (rather than a star misclassified as Ap), as conjectured in Sect. 2.2. However, it is definitely not a slowly rotating Ap star, as indicated by the upper limit of the projected equatorial velocity, v sin i ≲ 11.51 km s−1, which is significant, and by the width of the Fe Iλ 5434.5 Å line, as illustrated in Fig. 4.
SAP data are available for Sector 13. There is no convincing rotational variability seen in these SAP data.
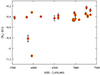 |
Fig. A.14. Mean longitudinal magnetic field measurements of HD 17330 against date, from the Special Astrophysical Observatory team (see text for specific references). Except for two discrepant values, little variability is seen, except perhaps for a small long-term trend. |
A.18. TIC 298197561 (HD 340577)
Following the identification of HD 340577 as a ssrAp star candidate that shows δ Sct pulsations, reported in Paper II, Hubrig et al. (2023) detected the magnetic field of this star through a single spectropolarimetric observation, from which they measured a value ⟨Bz⟩ ∼ −0.4 kG of its mean longitudinal component. This rather low ⟨Bz⟩ value is consistent with the fact that the mean quadratic magnetic field is below the detection threshold in the CAOS spectrum of HD 340577 that was analysed. The rotational Doppler broadening is also below the formal detection threshold, but the FWHD of the Fe Iλ 5434.5 Å line seems somewhat greater than could be accounted for by instrumental and thermal broadening: the weakly magnetic Ap star HD 340577 may either have a moderately long rotation period (20 d ≲ Prot ≲ 50 d) or be a ssrAp star.
SAP data are available for Sectors 14, 15, 41 and 55. Figure A.13 shows the phased light curve after some problematic data have been excised and after some adjustments to S14 and 55 by 0.01 mag were made. This star is definitely a ssrAp star, with a rotation period  (Hümmerich et al. 2016).
A.19. TIC 301918605 (HD 17330)
The magnetic field of HD 17330 was detected in 2010 by Romanyuk et al. (2017). In the following years, this group obtained 22 additional observations of the star, which are shown in Fig. A.14 (Romanyuk et al. 2018, 2020, 2022a,b, 2023). Twenty of the measurements yield values ⟨Bz⟩ ∼ −400 G, with a hint of a long-term trend towards less negative values at the more recent epochs. Two early determinations look discrepant, with mean longitudinal field values departing considerably from ⟨Bz⟩ ∼ −400 G. The origin of these deviations is unclear – the authors regard instrumental effects as unlikely – but they do not look at all like typical rotational modulation of Ap star magnetic fields. We believe that the long-term near stability of the 21 other ⟨Bz⟩ values, with a possible slow upward trend, is much more likely to represent the true variability of this field moment. If so, HD 17330 must have a rotation period Prot > 5 yr; it is a ssrAp star.
Romanyuk and his colleagues (see references above) also detected radial velocity variations, which they regard as significant, hence which indicate that HD 17330 is a spectroscopic binary. Their published measurements are insufficient to constrain the orbital period. The single radial velocity value that we derived is well within the range of those of the Romanyuk group.
For determination of the mean quadratic magnetic field of HD 17330 from our CAOS spectrum, we used diagnostic lines from Fe II. Indeed this is one of the few stars in the present study that have effective temperatures Teff > 104 K, so that Fe I lines tend to be too weak and too few to be used. The mean quadratic magnetic field is below the detection threshold, but a significant upper limit of the projected equatorial velocity is derived, v sin i < 8.15 km s−1, which is larger than one would expect if the rotation period is longer than 5 yr, as inferred from the mean longitudinal field variations. However, this apparent inconsistency results from the definite occurrence of significant crosstalk between the a1 and a2 terms of the right-hand side of Eq. (5), so that it does not question the conclusion that HD 17330 is very probably a ssrAp star in a binary system.
SAP data are available for Sector 18. There is no convincing rotational variability seen in these SAP data.
A.20. TIC 301946105 (HD 7410)
Bernhard et al. (2020) reported the occurrence of photometric variations in HD 7410 with a period  . This was overlooked in Paper II. This variability is unduly removed by the reduction process in the PDCSAP data, but it is clearly seen in the SAP data. The star was observed with TESS only in Sector 17, over a time base too short to allow the rotation period to be clearly determined. But the variations are consistent with the published Prot value, as can be seen in Fig. A.15. Hence, HD 7410 is not a ssrAp star, but an Ap star with a moderately long rotation period (see Sect. 2.4 of Paper III).
We have obtained a CAOS spectrum and a HARPS-N spectrum of HD 7410, 392 days apart. The radial velocity shows a small but formally significant change between the two epochs. This is probably a spectroscopic binary, possibly one with a long orbital period.
The analysis of the HARPS-N spectrum allowed us to derive a precise value of the mean quadratic magnetic field, ⟨Bq⟩ = 2086 G. This value is below the detection limit with CAOS. Meaningful upper limits of v sin i were determined from from both spectra: v sin i ≲ 7.16 km s−1 (CAOS) and v sin i ≲ 4.82 km s−1 (HARPS-N).
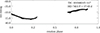 |
Fig. A.15. TIC 301946105 (HD 7410). This shows the light curve of the S17 SAP data phased with the rotation period found by Bernhard et al. (2020) of |

A.21. TIC 334505323 (HD 106322)
Spectral lines typical of Ap stars, such as those of Cr, Si, and Nd, are not seen in the spectrum of HD 106322 (see Fig. A.3): although it has been assigned the MK type Ap EuCr (Houk 1978), this star looks more like a normal A star. In particular, the spectral lines of Fe I in the red-arm SALT-HRS spectrum of HD 106322 are weak and their density is low, so that they cannot be used to diagnose the mean quadratic magnetic field. The Fe I lines of the blue-arm spectrum were used instead. Of course, because the Zeeman effect depends quadratically on the wavelength, the magnetic sensitivity of the lines is lower in the blue arm than in the red arm. In fact, no definite detection of the mean quadratic magnetic field was achieved, but a meaningful upper limit of the projected equatorial velocity, v sin i ≲ 14.77 km s−1, was derived. Thus, HD 106322 is not rotating extremely slowly, as is also apparent from consideration of the profile of the Fe Iλ 5434.5 Å line in Fig. 4.
SAP data are available for Sectors 10 and 37. There is no convincing rotational variability seen in these SAP data, lending plausibility to the suspicion that HD 106322 is not an Ap star.
A.22. TIC 347202840 (HD 236298)
As for some other stars, a precise determination of the mean quadratic magnetic field of HD 236298, ⟨Bq⟩ = 2218 G, could be obtained through analysis of a HARPS-N spectrum, but this field moment remained below the detection threshold of a CAOS spectrum. As the star is one of the hottest ones of the present sample (Teff = 10, 700 K), Fe II lines were used to diagnose the magnetic field. A meaningful upper limit of v sin i is obtained from both spectra: v sin i ≲ 5.50 km s−1 (CAOS) and v sin i ≲ 3.07 km s−1 (HARPS). The CAOS value is definitely an overestimate, because of crosstalk between the a2 and a3 terms of the regression analysis (the former is negative, which is physically meaningless). Crosstalk in this case appears to result primarily from the weakness of the spectral lines and the very narrow range of equivalent widths that they span, so that a3 is poorly constrained. The v sin i upper limit determined from the HARPS-N spectrum is consistent with a long rotation period.
The radial velocity does not appear to have changed at all over the 435 days that separate our two observations. All elements of information available until now indicate that HD 236298 must either be be a single magnetic ssrAp star, or a single Ap star with a moderately long rotation period.
SAP data are available for Sectors 17 and 24. Fig. A.16 shows the phased light curve after some zero-point shifts were made. It is clear that further zero-point shifts exist within the SAP data, but the rotational variation is clear with a period near Prot = 24.3 d, or twice this value. (As pointed out in Paper III, double-wave light curves are not infrequent in Ap stars, which cannot be easily distinguished using TESS observations when the one-wave period value is close to the sector length.) This star is an Ap star with a moderately long rotation period.
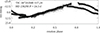 |
Fig. A.16. TIC 347202840 (HD 236298). Sectors 17 and 24 SAP data. Those have been phased with a rotation period of Prot = 24.3 d after some zero-point adjustments have been made. It is clear that there are further instrumental zero point shifts. |
A.23. TIC 352787151 (BD+35 5094)
The fact that no Cr II lines are visible in the portion of the spectrum of BD+35 5094 illustrated in Fig. A.1 probably results primarily from a temperature effect. Indeed, this is one of the coolest stars of the present sample, and the lines of Si I and Nd III are similar to those of the other Ap stars in the same temperature range. The Ap classification of BD+35 5094 also received recent confirmation from the analysis of LAMOST spectra by Shang et al. (2022).
The mean quadratic magnetic field of BD+35 5094 is below the detection threshold of the CAOS spectrum that we obtained for this star. However, a meaningful upper limit of the projected equatorial velocity, v sin i ≲ 5.92 km s−1, was obtained as a by-product of our analysis, but there appears to be some crosstalk between the a1 and a2 terms of the regression analysis. Indeed, the latter is negative, which is not physically meaningful. This implies that the value of a1 is overestimated. More likely, the rotational broadening of the spectral lines is at most marginally above the detection threshold, consistent with the appearance of the Fe Iλ 5434.5 Å line profile in Fig. 4. Accordingly, BD+35 5094 is probably a weakly magnetic ssrAp star, but a moderately long rotation period cannot be ruled out.
SAP data are available for Sector 17. Figure A.17 shows the phased light curve with a period of  . The variations are plausibly instrumental.
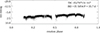 |
Fig. A.17. TIC 352787151 (BD +35 5094). S17 SAP data. Those have been phased with a rotation period of |

A.24. TIC 403625657 (HD 11187)
Babcock (1958) detected the magnetic field of HD 11187 and obtained seven measurements of its mean longitudinal component. The latter shows apparently significant variability over a couple of days, raising the suspicion that the rotation period may be short. Re-analysing the TESS data, short-term photometric variations were indeed detected, which suggest a value of the rotation period of the order of  . However, this value is not unambiguously constrained. A series of 15 determinations of the mean longitudinal magnetic field of HD 11187 obtained at the Special Astrophysical Observatory (Romanyuk, private communication) also indicates that the rotation period must be of the order of days to weeks. In particular, sign reversals of ⟨Bz⟩ are observed over a few days, but these measurements are not sufficient yet for unambiguous determination of the rotation period.
When fitting the observed values of RI(2)(λI) in our CAOS spectrum of HD 11187 by a function of the form given in Eq. (5), the rotational broadening term (a1) is by far the dominant one. The derived upper limit of the projected equatorial velocity, v sin i ≲ 16.96 km s−1, is compatible with a period of a few days. The mean quadratic magnetic field is below the detection threshold. In summary, HD 11187 is definitely a magnetic Ap star that does not rotate particularly slowly.
SAP data are available for Sector 18. Over the sector the light curve shows variations up to 0.015 mag that do not look periodic (see Fig. A.18). Hence these may be instrumental. No clear rotational variation is seen. We do not know how to reconcile this with the apparently significant variability of ⟨Bz⟩ over a timescale of days and the clear rotational broadening that affects the spectral lines.
A.25. TIC 444094235 (HD 85284)
The effective temperature listed in the TIC for HD 85284, Teff = 13, 640 K, is definitely much too high. The magnetic field of this typical Ap star can be best constrained by analysing its Fe I lines. Analysing a FEROS spectrum of this star, we could determine the mean quadratic magnetic field at the 5σ level, but the rotational broadening of the spectral lines is below the detection threshold. Indeed, the contribution of the a1 term of the regression appears to be somewhat below the expected intrinsic line broadening. However, the latter is overestimated because of the too large value of the effective temperature. If it was of the order of Teff ∼ 10, 700 K, as seems more plausible from the appearance of the spectrum (see Sect. 2.2), the observed line width would no longer be significantly less than the intrinsic line width estimate. Even so, no rotational broadening would be detected.
At the resolution of our SALT-HRS spectrum, the mean quadratic magnetic field is below the detection threshold. The upper limit of the projected equatorial velocity, v sin i ≲ 4.49 km s−1, is formally significant, but this results from a considerable amount of crosstalk between the a1 and a2 terms of the regression analysis (a2 is negative, which is unphysical). There is little doubt that the conclusion drawn from consideration of the FEROS spectrum, which implies that HD 85284 is most likely a ssrAp star, is correct. It can also be noted that a number of lines show significant intensity differences between the two available spectra, which are indicative of (probably) long-term spectroscopic variability. Detailed characterisation of these variations is beyond the scope of the present study.
Almost 13 years elapsed between the FEROS and SALT-HRS observations of HD 85284. The values of the radial velocity differ considerably between the two epochs: vr = 0.62 km s−1 and vr = 9.47 km s−1, respectively. Both also significantly differ from the value published by Denoyelle (1987), vr = 16 km s−1. Thus, HD 85284 appears to be another ssrAp star in a spectroscopic binary. The existing data are too sparse to set any constraint on the orbital period.
SAP data are available for Sectors 9, 10, 36, and 37. They show no obvious rotational variations.
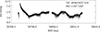 |
Fig. A.18. TIC 403625657 (HD 11187). The SAP light curve for S18. The variations are not periodic and do not look rotational. They are plausibly instrumental in origin. |
A.26. TIC 461161123 (HD 95811)
Although Renson & Manfroid (2009) note that HD 95811 may be a δ Del Am star rather than an Ap star, inspection of our SALT-HRS spectrum of this star confirms that the latter classification is correct. The mean quadratic magnetic field is below the detection threshold. The derived upper limit of the projected equatorial velocity, v sin i ≲ 10.89 km s−1, indicates that the lines are subject to some rotational broadening, which is also visible in the profile of the Fe Iλ 5434.5 Å line in Fig. 4. Thus, HD 95811 is not a ssrAp star. It may be an Ap star with a moderately long rotation period, even though no photometric variability signal was detected in the TESS SAP data, which are available for Sectors 9 and 36.
A.27. TIC 468507699 (HD 206977)
The analysis of our CAOS spectrum of HD 206977 yields a 3.1σ determination of the mean quadratic magnetic field. While it is at the limit of formal significance, this detection is likely real, as the fit appears well defined. At ⟨Bq⟩ = 1.65 kG, this is the lowest mean quadratic field value that could be measured in this study with either CAOS or SALT-HRS; weaker fields could only be measured with HARPS-N. This illustrates the importance of recording spectra at the highest possible resolving power for characterisation of the low end of the field strength distribution in the ssrAp stars. Indeed, the upper limit of the projected equatorial velocity that was derived for HD 206977, v sin i ≲ 1.75 km s−1, is consistent with it being a ssrAp star, or at least an Ap star with a moderately long rotation period (20 d ≲ Prot ≲ 50 d).
SAP data are available for Sectors 9 and 36. There is no clear rotational variation.
All Tables
All Figures
|
Fig. 1. Portion of the spectrum of the SB2 star HD 97132, obtained with SALT-HRS on HJD 2459968.455, covering the same range as in Figs. A.1–A.5. The wavelengths are in the heliocentric reference frame. |
| In the text | |
|
Fig. 2. Blown-up portion of the spectra of the eight Ap stars in which the presence of resolved, or marginally resolved, spectral lines is reported for the first time here, including the mean magnetic field modulus diagnostic line Fe IIλ 6149 Å. The CAOS spectra are plotted in black; the SALT-HRS spectra in sky blue; and the HARPS-N spectra in orange. For three stars, spectra were obtained both with HARPS-N and with CAOS. The two spectra of each pair are shown together, to illustrate the value of achieving the highest possible resolution to diagnose the magnetic field. The derived values of ⟨B⟩ appear in the bottom right corner of each panel; the CAOS spectra of BD+46 570 and of HD 96571 have insufficient resolution to determine ⟨B⟩ in these stars. The wavelengths are in the laboratory reference frame. The broad emission-like feature in the CAOS spectrum of BD+46 570 is due to an instrumental glitch. The Zeeman patterns of the lines seen in the considered spectral range are illustrated in Fig. 3. |
| In the text | |
|
Fig. 3. Zeeman patterns of the main lines observed in the spectral range covered in Fig. 2: Nd IIIλ 6145.1 Å, Cr IIλ 6147.1 Å, Fe IIλ 6147.7 Å, and Fe IIλ 6149.2 Å. The amplitude of the splitting corresponds to a magnetic field strength B = 5 kG. The length of each vertical bar is proportional to the relative strength of the corresponding line component. The π components appear above the horizontal line (in green), the σ+ and σ− components below it (in blue and yellow respectively). |
| In the text | |
|
Fig. 4. Profile of the magnetically insensitive Fe Iλ 5434.5 Å line as observed in the 18 stars of the present sample in which it is visible. The spectra are shown in order of increasing effective temperature, from left to right, then from top to bottom. The orange horizontal line at approximate mid-depth of each profile represents the estimated contribution of the instrumental profile and of thermal Doppler broadening to the line full width. An upper limit of v sin i, as given in Table A.1, is indicated at the bottom of each panel; v sin i ∼ 0 km s−1 means that the rotational broadening is below the detection limit at the achieved spectral resolution. The upper limit of v sin i was not determined for HD 174016 since it is a SB2 system for which the lines of the two components cannot be separated. For those stars for which both HARPS-N and CAOS spectra were obtained, the v sin i constraint is the one determined from the higher resolution HARPS-N spectrum. The wavelengths are in the laboratory reference frame. The deep, narrow feature at λ ∼ 5434 Å in the CAOS spectrum of TIC 163801263 is due to an instrumental glitch. |
| In the text | |
|
Fig. 5. Comparison of the profiles of the Fe Iλ 6335.3 Å and λ 6336.8 Å lines as observed in the 15 stars of the present sample in which both are well visible. The spectra are shown in order of increasing effective temperature, from top to bottom, then from left to right. The value of the mean quadratic magnetic field ⟨Bq⟩ is indicated at the bottom of each panel, for all stars in which its line broadening effect was above the limit of detection at the achieved spectral resolution. For those stars for which both HARPS-N and CAOS spectra were obtained, the ⟨Bq⟩ value is the one determined from the higher resolution HARPS-N spectrum. The wavelengths are in the laboratory reference frame. The Zeeman patterns of the lines seen in the considered spectral range are illustrated in Fig. 6. The emission feature at λ ∼ 6336 Å in the CAOS spectrum of HD 203922 is due to an instrumental glitch. |
| In the text | |
|
Fig. 6. Zeeman patterns of the main lines observed in the spectral range covered in Fig. 5: Fe Iλ 6335.3 Å, Fe IIλ 6336.2 Å, and Fe Iλ 6336.8 Å. The amplitude of the splitting corresponds to a magnetic field strength B = 5 kG. See the caption of Fig. 3 for more details. |
| In the text | |
|
Fig. 7. Contribution of the intrinsic (left), Doppler (centre) and magnetic (right) terms to the second-order moment about their centre of the profiles of the Fe I lines analysed in the HARPS-N spectrum of BD+39 4435. The slopes of the dashed-dotted orange lines are, respectively, the coefficients a3, a1 and a2 of the least-squares fit of the measured values of RI(2)(λI) by a function of the form given in Eq. (5). The sky blue dashed line in the centre panel represents the minimum contribution of the instrumental profile and of thermal Doppler broadening to the observed line width (see text for details). In BD+39 4435, because the rotational broadening is negligibly small, this line coincides almost exactly with the a1 slope line, from which it cannot be readily distinguished. The two lines are clearly separated from each other in stars that show significant rotation, as illustrated in Figs. 8 and 9. |
| In the text | |
|
Fig. 8. Same as Fig. 7, for the HARPS-N (top) and CAOS (bottom) spectra of BD+46 570. While the magnetic broadening is unambiguously seen in the right panels for both spectra, the scatter of the individual points about the respective best fit lines reflects the better precision achievable in the determination of the value of ⟨Bq⟩ at the higher resolution of HARPS-N. A much stricter upper limit on v sin i can also be set from the latter, but the picture is confused by crosstalk between the intrinsic and Doppler contributions to the line width in the analysis of the CAOS spectrum (see text for details). |
| In the text | |
|
Fig. 9. Same as Fig. 7, for SALT-HRS spectra of HD 90131 (at HJD 2460127.224) and HD 171420. The magnetic broadening is unambiguously seen in the former but its contribution is at most marginally significant in the latter. Conversely, HD 171420 shows definite rotational broadening, but the Doppler-like term in HD 90131 hardly exceeds the combined contributions of the intrinsic profile width and the thermal broadening. |
| In the text | |
|
Fig. 10. Comparison of the values of the mean magnetic field modulus ⟨B⟩ and the mean quadratic magnetic field ⟨Bq⟩ derived at individual epochs for the eight stars of this study in which the magnetically split components of the Fe IIλ 6149 Å line are resolved. Each of these stars is identified by a different symbol/colour combination, as indicated in the figure legend. The dashed-dotted red line, whose slope is 1.28, represents the relation between ⟨Bq⟩ and ⟨B⟩, as derived by Mathys (2017) (see text for details). |
| In the text | |
|
Fig. 11. Distribution of the phase-averaged magnetic field strength B0 for the long-period Ap stars of Table 1 of Paper I, of Table A.1 of Paper II, of Tables 1–3 of Paper III, and for which new ⟨B⟩ or ⟨Bq⟩ determinations were obtained in this study. The green, sky blue and orange parts of the histogram corresponds to the stars for which measurements of the mean magnetic field modulus or of the mean quadratic magnetic field are available; for the remaining stars (black part of the histogram), a lower limit of B0 was inferred from the existing mean longitudinal magnetic field measurements. Orange identifies the stars for which the ⟨B⟩ and ⟨Bq⟩ measurements of this paper were used. Green distinguishes the known ssrAp stars that were not identified as ssrAp star candidates on the basis of our TESS-based photometric survey. Sky blue is used for the previously confirmed ssrAp star candidates identified with TESS with ⟨B⟩ and ⟨Bq⟩ values from earlier studies. |
| In the text | |
|
Fig. 12. Same as Fig. 11 but using the relation B0 = 3.86 ⟨Bz⟩rms to compute the values of B0 for those stars for which the only magnetic field moment that has been determined until now is the mean longitudinal field. These stars are still represented by the black parts of the histogram; the meaning of the other colours is unchanged. |
| In the text | |
|
Fig. A.1. Portion of the spectrum of 5 sharp-lined ssrAp star candidates. The wavelengths are in the laboratory reference frame. |
| In the text | |
|
Fig. A.2. Portion of the spectrum of 5 sharp-lined ssrAp star candidates. The wavelengths are in the laboratory reference frame. |
| In the text | |
|
Fig. A.3. Portion of the spectrum of 5 sharp-lined ssrAp star candidates. The wavelengths are in the laboratory reference frame. |
| In the text | |
|
Fig. A.4. Portion of the spectrum of 5 sharp-lined ssrAp star candidates. The wavelengths are in the laboratory reference frame. |
| In the text | |
|
Fig. A.5. Portion of the spectrum of 5 sharp-lined ssrAp star candidates. The wavelengths are in the laboratory reference frame. |
| In the text | |
|
Fig. A.6. TIC 73765625 (HD 90131). Top: The light curve of the S45-46 SAP data. The visible variations are plausibly instrumental. Bottom: The amplitude spectrum of the S45-46 SAP data showing two low-frequency peaks, both of which are plausibly instrumental. |
| In the text | |
|
Fig. A.7. TIC 77128654 (HD 97127). Top: The light curve of the S45-46 SAP data without editing the data. The instrumental excursions in S46 are evident. S22 and S49 suffer similar excursions. This is not uncommon in the SAP data. Middle: The S45-46 SAP data after the larger instrumental excursions are filtered out. Bottom: The amplitude spectrum of the edited S45-46 SAP data showing two low-frequency peaks, both of which are plausibly instrumental. |
| In the text | |
|
Fig. A.8. Synthetic spectrum of the SB2 star HD 97132, for selected wavelength ranges. The thin solid black line is the observed spectrum; the thick solid red line is the synthetic spectrum for the combination of the two components. The synthetic spectra of each individual component is represented by the thin dashed blue and red lines. The ions responsible for the fitted transitions are identified in the Kurucz notation (Kurucz & Peytremann 1975). |
| In the text | |
|
Fig. A.9. TIC 124988213 (HD 44979). Top: The light curve of the S6-7 SAP data. Bottom: The amplitude spectrum of the S6-7 SAP data. All variations are plausibly instrumental. |
| In the text | |
|
Fig. A.10. TIC 163801263 (HD 203922). Top: The light curve of the S55 SAP data. Bottom: The amplitude spectrum of the S55 SAP data. The low frequency peak has a period of ∼22 d. It could be the rotation period, or it could be instrumental. |
| In the text | |
|
Fig. A.11. TIC 165446000 (BD+39 4435). Top: The light curve of the S15 SAP data. Bottom: The amplitude spectrum of the S15 SAP data. The low frequency peak has a period of ∼23 d. This could be rotation period, or it could be instrumental. Its similarity to that of TIC 163801263 above suggests an instrumental origin. |
| In the text | |
|
Fig. A.12. TIC 170419024 (HD 151860). The SAP light curves for Sectors 12 and 39 are phased with Prot = 100 d. This is simply to show what the problems are with the data and to indicate that if there is rotational variability, it is consistent with a ssrAp star. There is no claim that 100 d may be the period, or even close to it. |
| In the text | |
|
Fig. A.13. TIC 298197561 (HD 340577). There are four sectors of SAP data plotted here, S14, 15, 41, and 55. Here they have been phased with a rotation period of |
| In the text | |
|
Fig. A.14. Mean longitudinal magnetic field measurements of HD 17330 against date, from the Special Astrophysical Observatory team (see text for specific references). Except for two discrepant values, little variability is seen, except perhaps for a small long-term trend. |
| In the text | |
|
Fig. A.15. TIC 301946105 (HD 7410). This shows the light curve of the S17 SAP data phased with the rotation period found by Bernhard et al. (2020) of |
| In the text | |
|
Fig. A.16. TIC 347202840 (HD 236298). Sectors 17 and 24 SAP data. Those have been phased with a rotation period of Prot = 24.3 d after some zero-point adjustments have been made. It is clear that there are further instrumental zero point shifts. |
| In the text | |
|
Fig. A.17. TIC 352787151 (BD +35 5094). S17 SAP data. Those have been phased with a rotation period of |
| In the text | |
|
Fig. A.18. TIC 403625657 (HD 11187). The SAP light curve for S18. The variations are not periodic and do not look rotational. They are plausibly instrumental in origin. |
| In the text | |
Current usage metrics show cumulative count of Article Views (full-text article views including HTML views, PDF and ePub downloads, according to the available data) and Abstracts Views on Vision4Press platform.
Data correspond to usage on the plateform after 2015. The current usage metrics is available 48-96 hours after online publication and is updated daily on week days.
Initial download of the metrics may take a while.