Fig. 8.
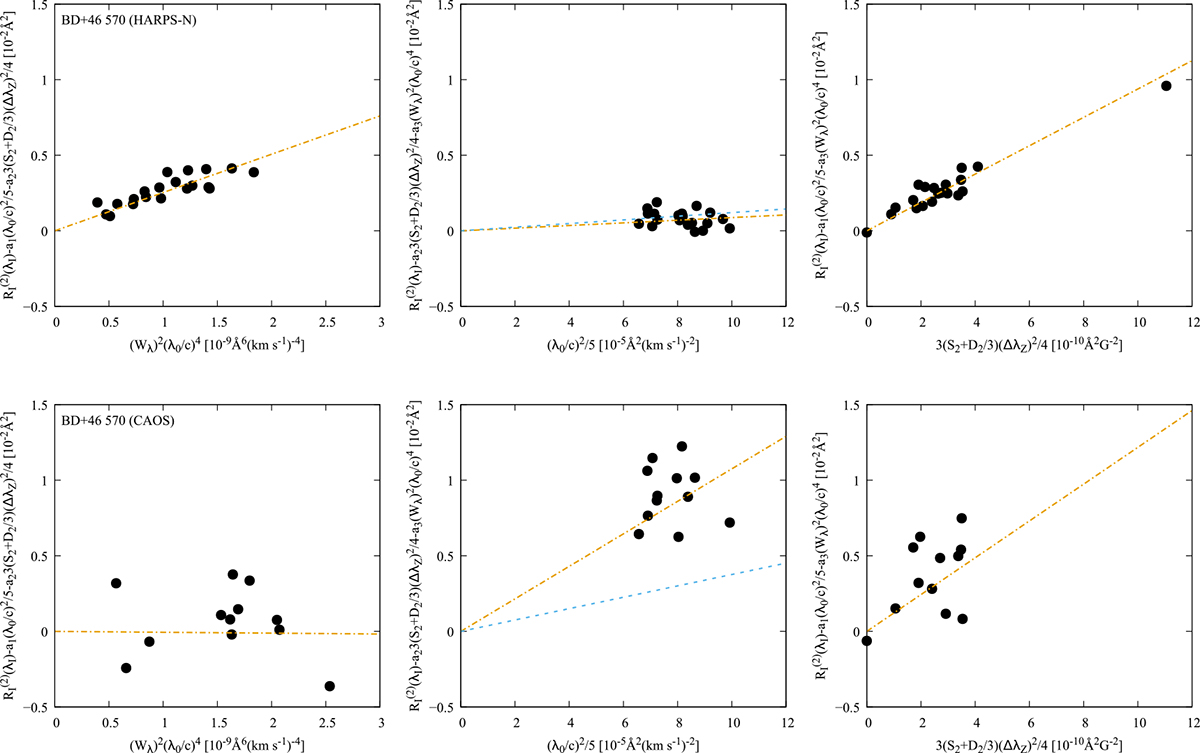
Download original image
Same as Fig. 7, for the HARPS-N (top) and CAOS (bottom) spectra of BD+46 570. While the magnetic broadening is unambiguously seen in the right panels for both spectra, the scatter of the individual points about the respective best fit lines reflects the better precision achievable in the determination of the value of ⟨Bq⟩ at the higher resolution of HARPS-N. A much stricter upper limit on v sin i can also be set from the latter, but the picture is confused by crosstalk between the intrinsic and Doppler contributions to the line width in the analysis of the CAOS spectrum (see text for details).
Current usage metrics show cumulative count of Article Views (full-text article views including HTML views, PDF and ePub downloads, according to the available data) and Abstracts Views on Vision4Press platform.
Data correspond to usage on the plateform after 2015. The current usage metrics is available 48-96 hours after online publication and is updated daily on week days.
Initial download of the metrics may take a while.