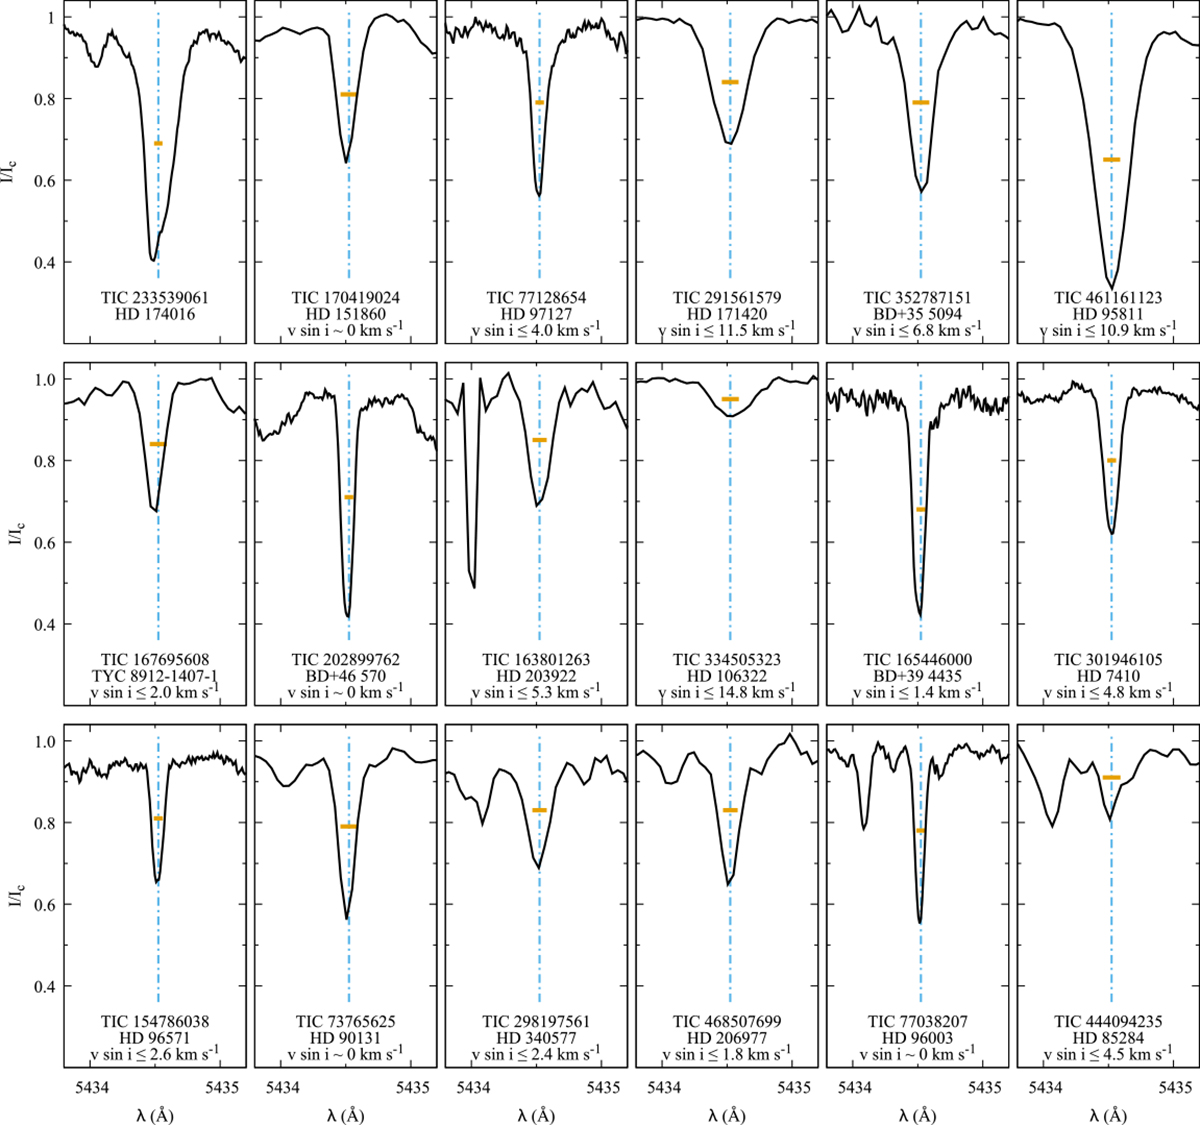
Fig. 4.
Download original image
Profile of the magnetically insensitive Fe Iλ 5434.5 Å line as observed in the 18 stars of the present sample in which it is visible. The spectra are shown in order of increasing effective temperature, from left to right, then from top to bottom. The orange horizontal line at approximate mid-depth of each profile represents the estimated contribution of the instrumental profile and of thermal Doppler broadening to the line full width. An upper limit of v sin i, as given in Table A.1, is indicated at the bottom of each panel; v sin i ∼ 0 km s−1 means that the rotational broadening is below the detection limit at the achieved spectral resolution. The upper limit of v sin i was not determined for HD 174016 since it is a SB2 system for which the lines of the two components cannot be separated. For those stars for which both HARPS-N and CAOS spectra were obtained, the v sin i constraint is the one determined from the higher resolution HARPS-N spectrum. The wavelengths are in the laboratory reference frame. The deep, narrow feature at λ ∼ 5434 Å in the CAOS spectrum of TIC 163801263 is due to an instrumental glitch.
Current usage metrics show cumulative count of Article Views (full-text article views including HTML views, PDF and ePub downloads, according to the available data) and Abstracts Views on Vision4Press platform.
Data correspond to usage on the plateform after 2015. The current usage metrics is available 48-96 hours after online publication and is updated daily on week days.
Initial download of the metrics may take a while.