Fig. 5.
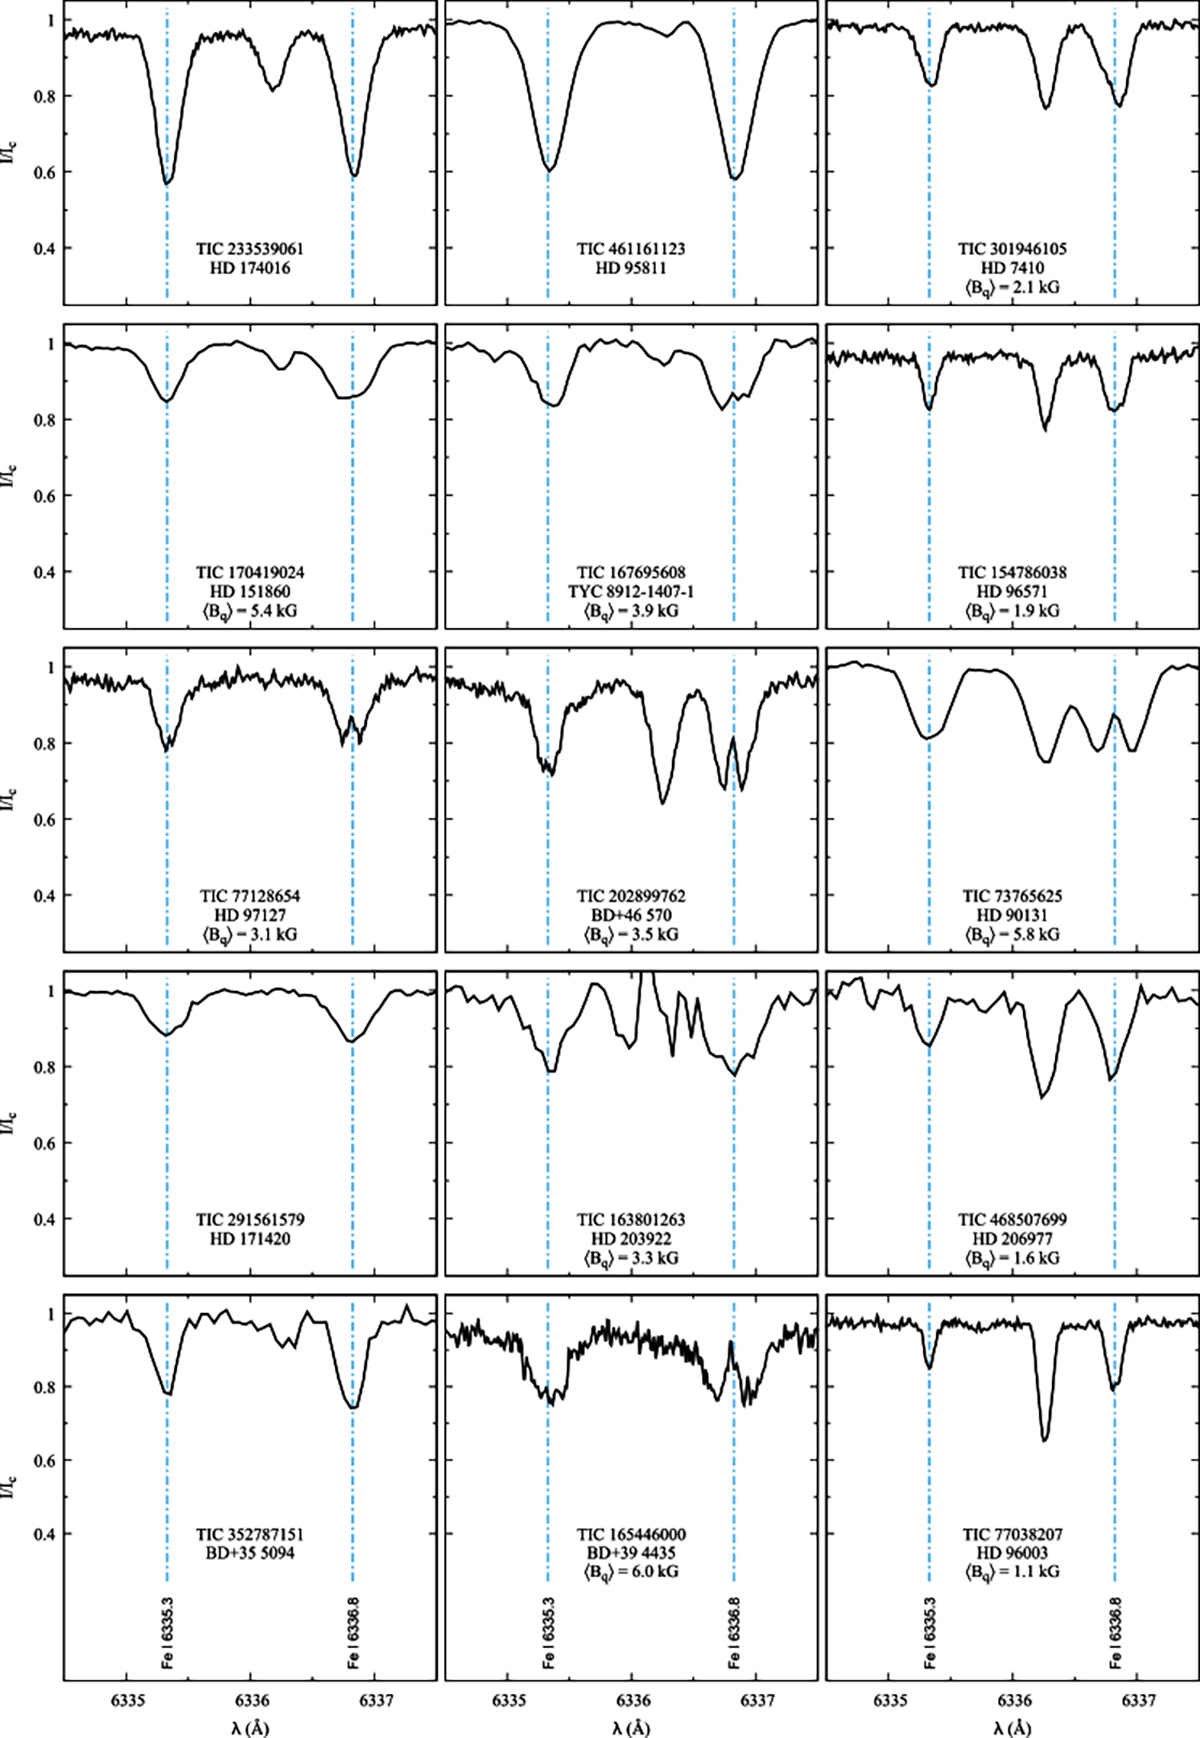
Download original image
Comparison of the profiles of the Fe Iλ 6335.3 Å and λ 6336.8 Å lines as observed in the 15 stars of the present sample in which both are well visible. The spectra are shown in order of increasing effective temperature, from top to bottom, then from left to right. The value of the mean quadratic magnetic field ⟨Bq⟩ is indicated at the bottom of each panel, for all stars in which its line broadening effect was above the limit of detection at the achieved spectral resolution. For those stars for which both HARPS-N and CAOS spectra were obtained, the ⟨Bq⟩ value is the one determined from the higher resolution HARPS-N spectrum. The wavelengths are in the laboratory reference frame. The Zeeman patterns of the lines seen in the considered spectral range are illustrated in Fig. 6. The emission feature at λ ∼ 6336 Å in the CAOS spectrum of HD 203922 is due to an instrumental glitch.
Current usage metrics show cumulative count of Article Views (full-text article views including HTML views, PDF and ePub downloads, according to the available data) and Abstracts Views on Vision4Press platform.
Data correspond to usage on the plateform after 2015. The current usage metrics is available 48-96 hours after online publication and is updated daily on week days.
Initial download of the metrics may take a while.