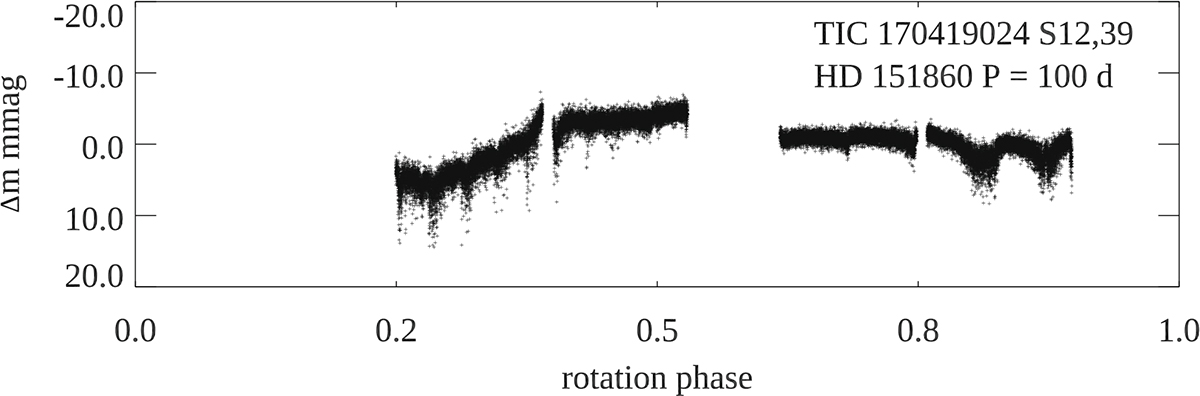
Fig. A.12.
Download original image
TIC 170419024 (HD 151860). The SAP light curves for Sectors 12 and 39 are phased with Prot = 100 d. This is simply to show what the problems are with the data and to indicate that if there is rotational variability, it is consistent with a ssrAp star. There is no claim that 100 d may be the period, or even close to it.
Current usage metrics show cumulative count of Article Views (full-text article views including HTML views, PDF and ePub downloads, according to the available data) and Abstracts Views on Vision4Press platform.
Data correspond to usage on the plateform after 2015. The current usage metrics is available 48-96 hours after online publication and is updated daily on week days.
Initial download of the metrics may take a while.