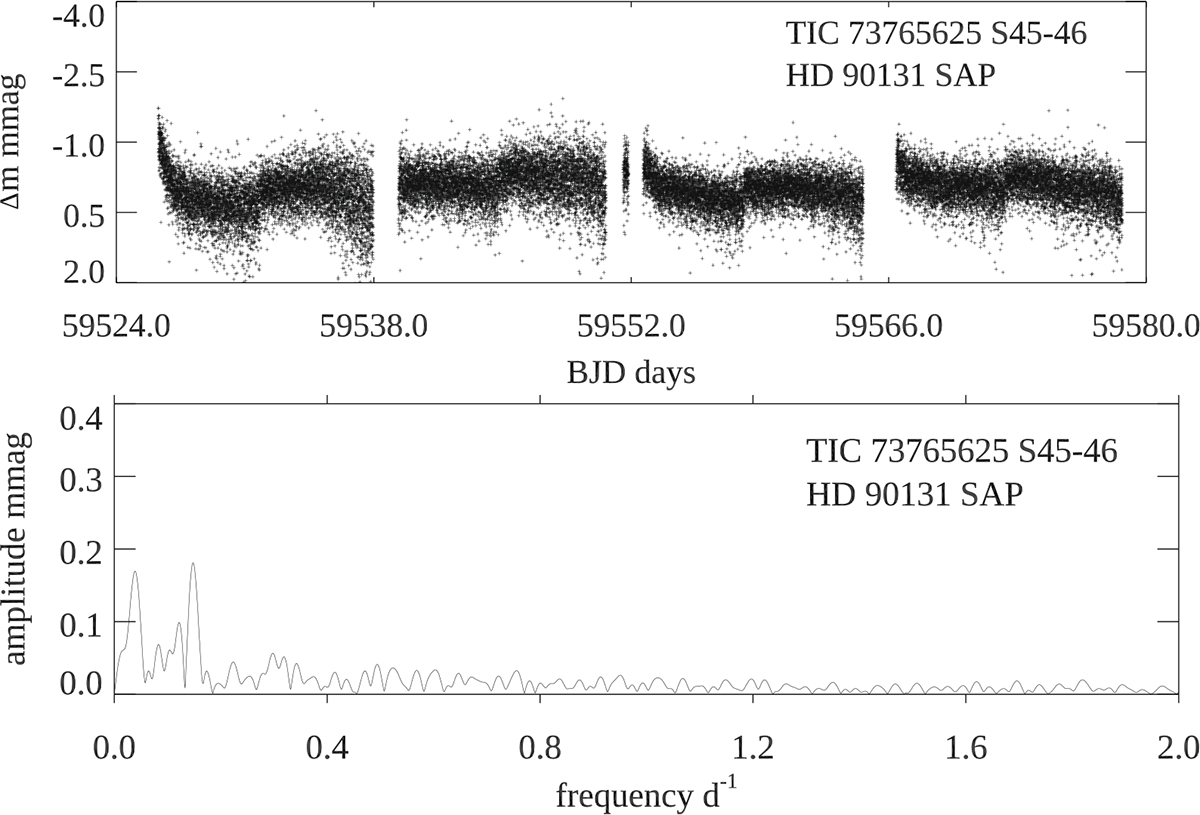
Fig. A.6.
Download original image
TIC 73765625 (HD 90131). Top: The light curve of the S45-46 SAP data. The visible variations are plausibly instrumental. Bottom: The amplitude spectrum of the S45-46 SAP data showing two low-frequency peaks, both of which are plausibly instrumental.
Current usage metrics show cumulative count of Article Views (full-text article views including HTML views, PDF and ePub downloads, according to the available data) and Abstracts Views on Vision4Press platform.
Data correspond to usage on the plateform after 2015. The current usage metrics is available 48-96 hours after online publication and is updated daily on week days.
Initial download of the metrics may take a while.