Fig. A.13.
Download original image
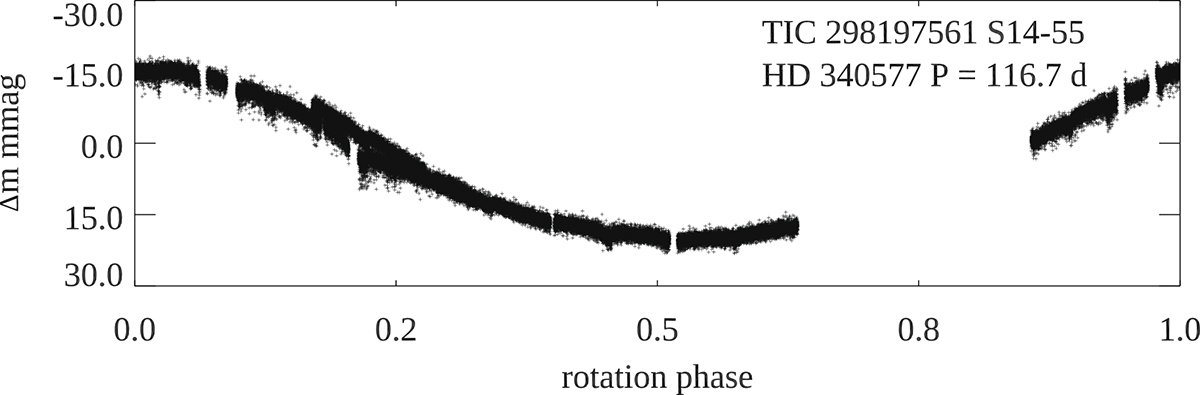
TIC 298197561 (HD 340577). There are four sectors of SAP data plotted here, S14, 15, 41, and 55. Here they have been phased with a rotation period of ![]() (Hümmerich et al. 2016) after some zero-point adjustments up to 0.01 mag have been made among the sectors.
(Hümmerich et al. 2016) after some zero-point adjustments up to 0.01 mag have been made among the sectors.
Current usage metrics show cumulative count of Article Views (full-text article views including HTML views, PDF and ePub downloads, according to the available data) and Abstracts Views on Vision4Press platform.
Data correspond to usage on the plateform after 2015. The current usage metrics is available 48-96 hours after online publication and is updated daily on week days.
Initial download of the metrics may take a while.