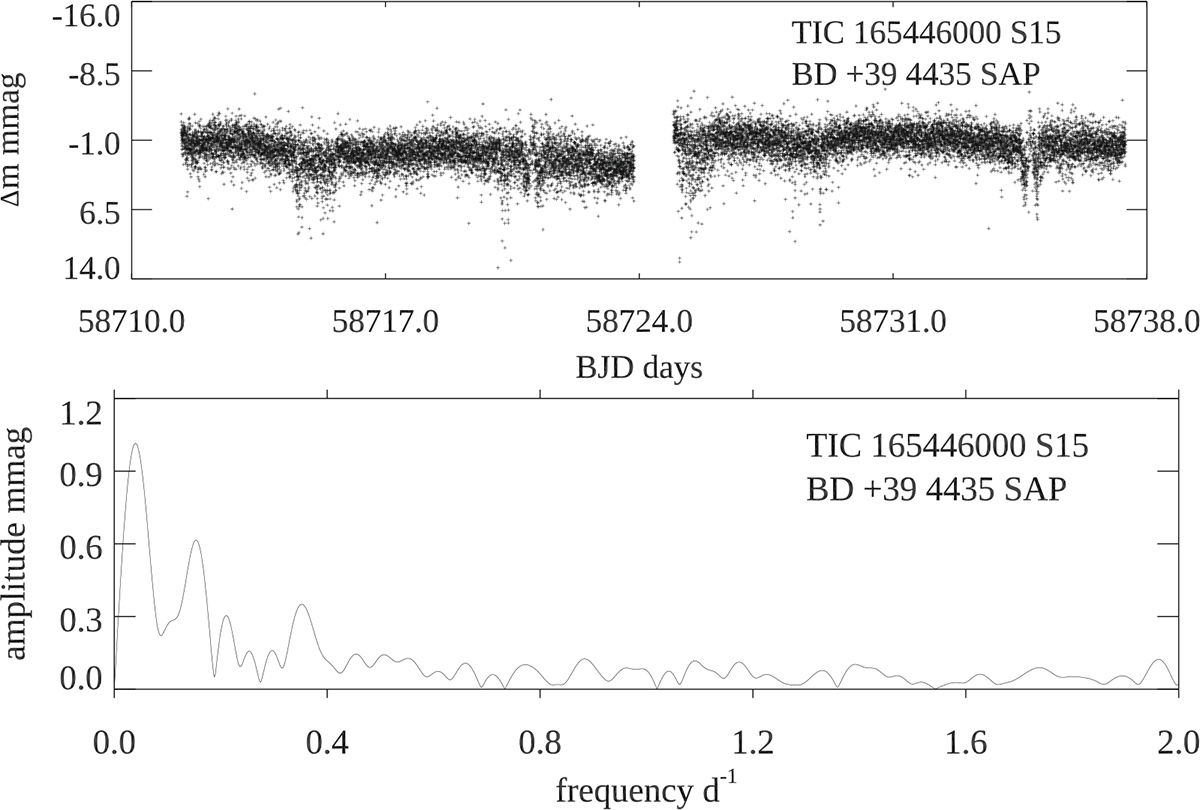
Fig. A.11.
Download original image
TIC 165446000 (BD+39 4435). Top: The light curve of the S15 SAP data. Bottom: The amplitude spectrum of the S15 SAP data. The low frequency peak has a period of ∼23 d. This could be rotation period, or it could be instrumental. Its similarity to that of TIC 163801263 above suggests an instrumental origin.
Current usage metrics show cumulative count of Article Views (full-text article views including HTML views, PDF and ePub downloads, according to the available data) and Abstracts Views on Vision4Press platform.
Data correspond to usage on the plateform after 2015. The current usage metrics is available 48-96 hours after online publication and is updated daily on week days.
Initial download of the metrics may take a while.