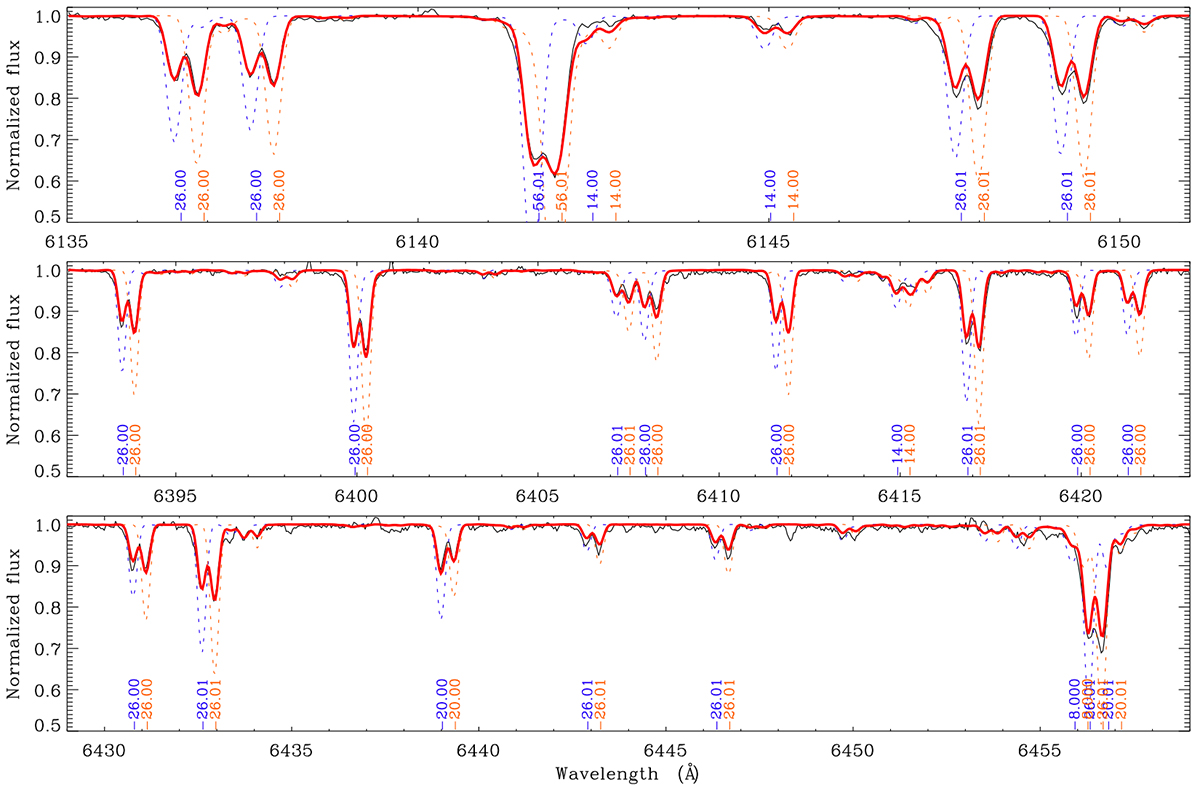
Fig. A.8.
Download original image
Synthetic spectrum of the SB2 star HD 97132, for selected wavelength ranges. The thin solid black line is the observed spectrum; the thick solid red line is the synthetic spectrum for the combination of the two components. The synthetic spectra of each individual component is represented by the thin dashed blue and red lines. The ions responsible for the fitted transitions are identified in the Kurucz notation (Kurucz & Peytremann 1975).
Current usage metrics show cumulative count of Article Views (full-text article views including HTML views, PDF and ePub downloads, according to the available data) and Abstracts Views on Vision4Press platform.
Data correspond to usage on the plateform after 2015. The current usage metrics is available 48-96 hours after online publication and is updated daily on week days.
Initial download of the metrics may take a while.