Fig. 3.
Download original image
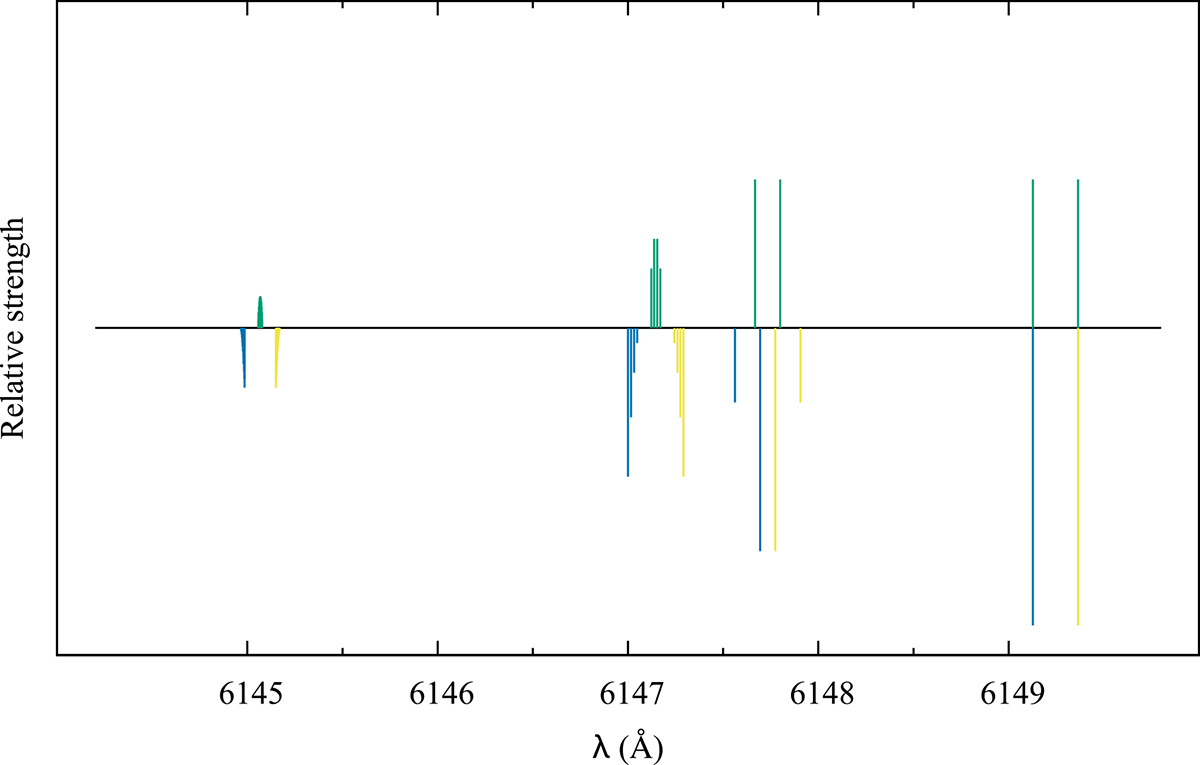
Zeeman patterns of the main lines observed in the spectral range covered in Fig. 2: Nd IIIλ 6145.1 Å, Cr IIλ 6147.1 Å, Fe IIλ 6147.7 Å, and Fe IIλ 6149.2 Å. The amplitude of the splitting corresponds to a magnetic field strength B = 5 kG. The length of each vertical bar is proportional to the relative strength of the corresponding line component. The π components appear above the horizontal line (in green), the σ+ and σ− components below it (in blue and yellow respectively).
Current usage metrics show cumulative count of Article Views (full-text article views including HTML views, PDF and ePub downloads, according to the available data) and Abstracts Views on Vision4Press platform.
Data correspond to usage on the plateform after 2015. The current usage metrics is available 48-96 hours after online publication and is updated daily on week days.
Initial download of the metrics may take a while.