| Issue |
A&A
Volume 690, October 2024
|
|
|---|---|---|
| Article Number | A272 | |
| Number of page(s) | 14 | |
| Section | Astrophysical processes | |
| DOI | https://doi.org/10.1051/0004-6361/202450467 | |
| Published online | 15 October 2024 | |
Protostellar spin-up and fast rotator formation through binary star formation
1
Heidelberg Institute for Theoretical Studies, Schloß-Wolfsbrunnenweg 35, 69118 Heidelberg, Germany
2
Research School of Astronomy and Astrophysics, Australian National University, Canberra, ACT 2611, Australia
3
Australian Research Council Centre of Excellence in All Sky Astrophysics (ASTRO3D), Canberra, ACT 2611, Australia
4
Department of Physics, University of North Florida, 1 UNF Dr, Jacksonville, FL 32224, USA
Received:
22
April
2024
Accepted:
24
August
2024
Context. Many fast-rotating stars (rotation periods of < 2 days) are found to be unresolved binaries with separations of tens of AU. This correlation between fast rotators and binarity leads to the question of whether the formation of binary stars inherently produces fast rotators.
Aims. Our goal is to understand the spin evolution of protostars and whether the formation of companions plays a role in spinning up stars.
Methods. We used magneto-hydrodynamic simulations to study the formation of multiple star systems from turbulent and non-turbulent protostellar cores. We tracked the angular momentum accreted by individual star and inner disc systems by using a sink (star) particle technique. We ran a resolution study to extrapolate protostellar properties.
Results. We find in all simulations that the primary star can experience a spin-up event correlated with the formation of companions, namely fragmentation into binaries or higher-order systems. The primary star can spin up by up to 84% of its pre-fragmentation angular momentum and by up to 18% of its pre-fragmentation mass-specific angular momentum. The mechanism for the spin-up is gravitational disc instabilities in the circumstellar disc around the primary star, which leads to the accretion of material with high specific angular momentum. The simulations that experience the strongest disc instabilities fragment to form companions. Simulations with weaker spin-up events experience disc instabilities triggered by a companion flyby, and the disc instability in these cases typically does not produce further fragments (i.e. they remain binary systems).
Conclusions. The primary star in multiple star systems can end up with a higher spin than single stars. This is because gravitational instabilities in the circumstellar disc around the primary star can trigger a spin-up event. In the strongest spin-up events, the instability is likely to cause disc fragmentation and the formation of companions. This spin-up mechanism, coupled with shorter disc lifetimes due to truncated circumstellar discs (and thus short spin-down times), may help produce fast rotators.
Key words: methods: numerical / binaries: general / circumstellar matter / stars: formation / stars: protostars / stars: rotation
© The Authors 2024
 Open Access article, published by EDP Sciences, under the terms of the Creative Commons Attribution License (https://creativecommons.org/licenses/by/4.0), which permits unrestricted use, distribution, and reproduction in any medium, provided the original work is properly cited.
This article is published in open access under the Subscribe to Open model. Subscribe to A&A to support open access publication.
1. Introduction
During the early star formation process (Class 0/1), a protostar will accrete mass from its surrounding circumstellar disc. With the inflow of the material onto the protostar, it will also accrete angular momentum. The resulting rotational velocity can increase by any amount up to the break-up velocity, which is defined as the Keplerian velocity at the stellar surface. The initial spin of the protostar is therefore set by the angular momentum of the accreted gas, as well as the interactions between the star and circumstellar disc.
While protostars spin up due to both contraction and accretion, they are also expected to spin down later in their protostellar evolution, due to disc-locking with the circumstellar disc (Königl 1991). Observations of stellar spins in various star-forming regions < 4 Myr (ages when circumstellar discs are still present) find that stars do spin down slowly, however, there is a significant spread in rotation rates at all ages (Rebull et al. 2004). The difference in the angular velocity between the protostar and the inner disc leads to angular momentum being removed from the protostar, slowing down its rotation. The presence of a disc is, therefore, crucial to the spin-down process.
Models that explore the evolution of stellar rotation over a period of up to 1 Gyr after formation find that shorter disc lifetimes can explain the evolution of fast rotators (Eggenberger et al. 2012; Gallet & Bouvier 2013, 2015), as a shorter period of disc-locking will remove less angular momentum. Observations also support the relation between disc lifetime and rotation rates, with disc-bearing pre-main-sequence stars consistently having longer rotation periods (3 − 10 days) than disc-less pre-main-sequence stars (1 − 7 days), (Edwards et al. 1993; Cieza & Baliber 2007; Affer et al. 2013; Kounkel et al. 2023). The observations imply that fast disc dispersal halts the spin-down phase.
An origin of fast disc dispersal can be the presence of a companion, which truncates the circumstellar disc (Kraus et al. 2016; Kuruwita et al. 2018), thus leading to short disc lifetimes and spin-down times. This potential relationship between binary and fast rotator formation has been discussed in the literature, with Stauffer (1994) suggesting binary stars with orbital periods of ten to tens of years are likely to be fast rotators because, due to disc truncation by a companion, there is less or no disc-regulated spin evolution.
Early observational surveys investigating the relationship between the presence of companions and spin evolution for binaries with separations from 10 − 1000 astronomical units (AU) found no significant relationship (Bouvier et al. 1997); however, these observations looked at the 100 Myr Pleiades, which is very evolved. More recent observations of younger stars find that many fast rotators (period of < 2 days) are found to be in binary star systems with an unseen companion at separations of tens of AU, and this can be observed both in evolved systems and in those that have ages of < 1 Myr (Daher et al. 2022; Kounkel et al. 2023).
While shortened disc lifetimes increase the chances of fast rotator formation, this cannot be the sole factor driving the excess in angular momentum in these stars, as binaries that can retain their discs for ∼5 Myr are still somehow able to eventually spin up. Nor do these models explain the initial rotation period distribution of the stars that have been modelled. What sets the initial spin of a star is still an open question.
Previous simulations of binary star formation have found that the amount of angular momentum that is transported via outflows is less efficient in young binary star systems (with separations of a few tens of AU). This can lead to more angular momentum remaining in the star-disc system (Kuruwita et al. 2017), giving the first hint of the role of multiplicity in the evolution of angular momentum in young stars.
In this paper, we directly investigate how protostars obtain their initial spin, and whether fragmentation plays a role in spinning up stars. In Sect. 2 we describe the simulations used and the sink particle model that allows us to track the spin of the protostars. In Sect. 3 we present the results of our simulations and determine a mechanism for spinning up a protostar. In Sect. 4 we discuss the plausibility of our mechanisms based on comparison with observations. In Sect. 5 we discuss the limitations of the work and the impact of missing physics. In Sect. 6 we summarise the conclusions of this study.
2. Method
We used the adaptive mesh refinement (AMR) code FLASH (Fryxell et al. 2000; Dubey et al. 2008) to integrate the compressible ideal magneto-hydrodynamic (MHD) equations. We used the HLL3R Riemann solver for ideal MHD (Waagan et al. 2011). The gravitational interactions of the gas were calculated using a tree-based Poisson solver (Wünsch et al. 2018).
2.1. Equation of state
We used a piece-wise polytropic equation of state,

which describes the relationship between the thermal gas pressure (Pth) and density (ρ), where K is the polytropic coefficient and Γ is the polytropic index. The coefficient K is given by the isothermal sound speed squared. In our simulations, the sound speed is initially set to cs = 2 × 104 cm s−1 for a gas temperature of ∼11 K with mean molecular weight of 2.3 mH, where mH is the mass of a hydrogen atom. K is then subsequently computed, such that P is a continuous function of ρ. For our simulations Γ is defined as
The values of Γ were approximated based on radiation-hydrodynamical simulations of molecular-core collapse by Masunaga & Inutsuka (2000). These values describe the gas behaviour during the initial isothermal collapse of the molecular core, adiabatic heating of the first core, the H2 dissociation during the second collapse into the second core, and the return to adiabatic heating.
2.2. Adaptive mesh refinement (AMR)
The Jeans length must be resolved with at least four grid cells to avoid artificial fragmentation (Truelove et al. 1997). However, it is recommended that the Jeans length be resolved with at least 30 grid cells to resolve the twisting and amplification of the magnetic field, and the turbulent motions on the Jeans scale (Federrath et al. 2011). In our simulations, the Jeans length is resolved with at least 32 grid cells. This Jeans refinement criterion applies to all but the highest level of the AMR hierarchy. On the maximum level of refinement, the formation of sink (star) particles may be triggered, which is discussed next.
2.3. Sink particles
2.3.1. Sink particle formation
In our simulations, the formation of a protostar is signalled by the formation of a sink particle (Federrath et al. 2010a, 2014). If a cell exceeds the density threshold, derived from the Jeans length, given by
it may collapse into a point-mass sink particle (subject to additional checks; see below).
For a gas volume with a central cell that exceeds ρsink to form a sink particle, the gas volume must also meet the following criteria described in Federrath et al. (2010a):
-
Be on the highest level of AMR.
-
Not be within the accretion radius (rsink) of an existing sink particle (see Sect. 2.3.2).
-
The velocity field must be converging from all directions (vr < 0).
-
Have a central gravitational potential minimum.
-
Be bound (|Egrav|> Eth + Ekin + Emag).
-
Be Jeans-unstable.
If these criteria are met for a volume with radius rsink = 2.5Δx, where Δx is the cell length on the highest AMR level, centred on the cell exceeding ρsink, then a sink particle is created.
Once a sink particle is formed, a second-order leapfrog integrator is used to update the positions of sink particles using a time step based on the velocity and acceleration of the sink particle. A sub-cycling method is implemented to prevent artificial precession of the sink particles in eccentric orbits. Details on the sub-cycling method can be found in Federrath et al. (2010a), highlighting that this method is necessary to accurately calculate sink particle orbits.
2.3.2. Sink particle accretion model
As the simulations evolve, sink particles that form can accrete mass and momentum. A sink particle can accrete mass if a cell exceeds the density threshold ρsink while within the accretion radius rsink of a sink particle. If the mass is bound and collapses towards the sink particle, it will be accreted onto the sink particle; as such, the mass, momentum and angular momentum are conserved (Federrath et al. 2010a, 2014). It is with this model that we can track how much angular momentum the protostars will accrete.
The gravitational binding energy of a parcel of gas alone does not predict whether the gas will be accreted onto the star. Gas is accreted onto a sink particle only if it is bound and collapsing towards the particle (i.e. vr < 0). The fraction of mass Δmi to be accreted from cell i with density ρi and volume Vi is Δmi = (ρi − ρsink)Vi.
Within the control volume  of a sink particle, we calculated the mass, centre of mass (c.o.m.), momentum, and angular momentum of the material to be accreted:
The mass Δmi is then removed from each cell and added to the sink particle quantities are updated with the accreted amount. We refer the reader to Federrath et al. (2014) for details on the sink particle module.
Throughout the simulations, we can track how the spin of the sink particles evolves, and we used this property to gain insight into the origin of fast rotators.
2.4. Simulation setup
Our simulations are initialised in a three-dimensional computational domain of Lbox = 1.2 × 1017 cm (∼8000 AU) along each side of the Cartesian domain. We used 12 levels of refinement (Lref) of the AMR grid, resulting in a minimum cell size of 1.95 AU when fully refined. At this resolution, the accretion radius of the sink particles is 4.9 AU. We conducted a resolution study on one of the simulations (see Sect. 4.2) to determine how the sink particle properties depend on resolution, allowing us to extrapolate to the properties of a protostar with radius r = 2 R⊙.
Our simulations begin with a spherical cloud of mass 1 M⊙, and radius ∼3300 AU placed in the centre of the simulation domain, which is initially given solid body rotation. We ran a parameter study with varying initial cloud rotation and turbulence levels. The rotation is defined as values of Ωtff (see Banerjee & Pudritz 2006; Machida et al. 2008) from 0.20 to 0.35, where Ω is the angular frequency, and tff is the freefall time of the cloud. A higher Ωtff value indicates a higher initial rotation rate. An initial turbulent velocity field is imposed on top of the solid body rotation. We performed runs without turbulence and with a typical level of turbulence of Mach number 0.2, which corresponds to a velocity dispersion of 0.04 km s−1. For details on the implementation of turbulence, we refer the reader to Federrath et al. (2010b) and Kuruwita & Federrath (2019).
An initially uniform magnetic field of 100 μG is threaded through the cloud in the z-direction. This gives a mass-to-flux ratio of (M/Φ)/(M/Φ)crit = 5.2 where the critical mass-to-flux ratio is 487 g cm−2 G−1 as defined in Mouschovias & Spitzer (1976). This value makes the protostellar core magnetically super-critical, such that it will collapse under its own gravity.
To prevent the cloud from expanding rapidly due to internal gas pressure, the spherical cloud is initialised in pressure equilibrium with the surrounding gas material. This is achieved by giving the surrounding material a gas density of ρ0/100 with a temperature 100 times higher than the cloud temperature.
3. Results
Our simulations evolved for at most 10 000 yr after the first sink particle (hereafter referred to as the primary star) is formed. The entire suite of simulations used approximately a million compute core hours. The number of sink particles produced by the end of each simulation is summarised in Table 1. Projection plots of the density at various times are shown in Figs. 1 and 2 for the non-turbulent and turbulent cases, respectively. In Fig. 1, where the primary star first forms, the density distribution of the gas is rotationally symmetric, and smooth. For the simulation with the lowest initial spin in the top row, we see that a single large circumstellar disc forms around the primary, and companions then form within this disc. For the higher initial spin simulations, a dense ring quickly forms, which then fragments into multiple stars with initial separations of ∼100 AU. After fragmentation, there are complex dynamics that cluster the stars into different groups, forming circum-binary and -trinary discs. For the turbulent simulations shown in Fig. 2, we see that when the primary star first forms, the initial turbulent velocity field creates non-axisymmetric density perturbations. The lowest initial spin simulations form a large circumstellar disc, which then fragments, similar to the non-turbulent case. For the higher initial spin simulations, an extended circumstellar disc forms, which is in contrast to the ring formed in the non-turbulent simulations. The initial turbulence velocity field smears out what would be a ring into an extended low-density disc. In the turbulent simulations, which form many sink particles, the dynamics seen in the high initial spin non-turbulent simulations are also present here.
Number of stars formed by 10 000 yr after primary star formation in each simulation.
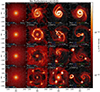 |
Fig. 1. Projections of the density over 200 AU thick slices at different times, for the non-turbulent simulations. The rows from top to bottom show simulations from low to high initial spin (Ωtff = 0.20 to 0.35). The time since the formation of the primary star is annotated in the top left of each panel. The columns are the simulations at time 0, 3333, 6666 and 10 000 yr after the first protostar forms. The sink particles are annotated with coloured crosses, and their masses are annotated at the bottom of each panel. The vector field shows the integrated velocity field, and the streamlines show the magnetic field. |
The mass evolution of the sink particles in all simulations is shown in Fig. 3. We find that the primary star shows an initial rapid growth in mass over the first ∼1500 yr before plateauing. In most simulations, the primary star also experiences an increased growth period later on (around 4000 − 5000 yr), which coincides with the formation of companions.
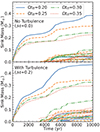 |
Fig. 3. Mass of the sink particles since the formation of the primary star for simulations without turbulence (top) and with turbulence (bottom). The initial spin of the simulations is indicated in the legend. Each line shows the mass of an individual sink particle. |
Before the second mass growth phase, the initial turbulence of the simulation does not directly affect the primary star mass anymore. However, after the second mass growth phase, we find that the amount of turbulence has some effect on the primary star, with the final primary mass being larger in the simulations with initial turbulence. The initial spin of the protostellar cloud shows a significant difference in the mass evolution of the primary stars, with the lower spin simulations resulting in more massive primary stars. For the ℳ = 0.0, the final primary mass of the Ωtff = 0.20 simulation is approximately 70% larger than the final primary mass of the Ωtff = 0.35 simulation. In the ℳ = 0.2, the primary in the lowest spin simulation is approximately 62% larger than the primary in the highest spin simulation. This may be because the surrounding gas in the higher initial spin simulations must lose significantly more angular momentum to fall within the accretion radius of the primary star.
3.1. Protostellar spin
While the sink particles accrete mass throughout the simulations, they also accrete angular momentum. In Fig. 4 the total angular momentum of the individual sink particles is shown. In all simulations, we see that the primary star experiences an initial growth in angular momentum and then plateaus. In most of the simulations, we also see a second phase of angular momentum growth, which coincides with the formation of companions. The angular momentum evolution of the sink particles is similar evolution to their mass evolution. This is not surprising, given that angular momentum is directly proportional to the mass. We therefore also present the mass-specific angular momentum (h) in Fig. 5. In this figure, we see that the specific angular momentum of the primary stars grows significantly over the first 1−2 thousand years, and plateaus. In some cases, we see a steady decrease after the initial mass accretion event. This indicates that after the initial growth, the gas that is being accreted is low in angular momentum, thus reducing the sink particle’s specific angular momentum.
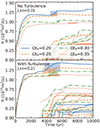 |
Fig. 5. Same as Fig. 3, but for the mass-specific angular momentum accreted by the sink particles. The highlighted regions indicate the first spin-up event after the formation of companions. |
In most of the simulations, we see the specific angular momentum of the primary stars increase at approximately the same time as the formation of companions occurs, after ∼3000 yr. This increase indicates that the primary stars are accreting high angular momentum material that then increases the specific angular momentum of the sink particle. From the specific angular momentum evolution, we identified the first significant spin-up event by eye. These spin-up events are highlighted by the shaded region in Fig. 5.
We measured the increase in angular momentum and specific angular momentum of the primary star caused by companion formation using

where Lpre and hpre are the absolute and specific angular momentum, respectively, of the primary star measured at 500 yr before the formation of the first companion. Lpost and hpost are the maximum absolute and specific momentum, respectively, measured in the primary star, in the highlighted regions of Fig. 5. The measured spin-up is shown in Fig. 6. In this figure, we see that the turbulent simulations consistently produce stronger spin-up events, with an increase of over 70% in the total angular momentum, and high spin-up percentages in the specific angular momentum (up to 18%). Across all simulations, we see that there is a trend in that the simulations with low initial spin produce stronger spin-up events than the simulations with higher initial spin. The trend is parallel between the non-turbulent and turbulent simulations, implying that turbulent discs generally lead to higher angular momentum accretion. The trend in specific angular momentum is not parallel between the non-turbulent and turbulent simulations and instead converges at higher initial cloud spin.
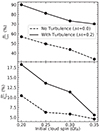 |
Fig. 6. Measured spin-up calculated relative to the angular momentum (ΔL; top) and specific angular momentum (Δh; bottom) of the primary star at 500 yr before the formation of the secondary companion, and the peak momentum in the highlighted regions in Fig. 5. |
The angular momentum accreted onto the sink particles does not directly translate to the angular momentum that would be accreted onto the protostar. The sink particles in the simulations have accretion radii of 4.9 AU and therefore represent the protostar and inner disc system together. The spin of the protostar is sensitive to the fraction of mass and angular momentum that the star accretes from the inner disc, and what is lost via jets. In the resolution study presented in Sect. 4.2, we explain that it is not possible to resolve down to the protostellar surface while achieving a sufficiently long evolution of these systems. However, our chosen resolution sufficiently some of the disc winds and converges on a consistent sink particle angular momentum evolution before companion formation.
For the rest of this paper, we assume that the higher angular momentum in the sink particle translates to higher angular momentum in the protostar. If we take a sphere with solid body rotation, the rotational period is given by

where r is the radius and h is the mass-specific angular momentum of the sphere. For our simulations 4πr2/5 = constant and with the assumptions we made, the specific angular momentum of the protostar is proportional to the specific angular momentum of the sink particle (h⋆ ∝ hsink), and therefore

Using this relationship we derive that the post spin-up event period (Ppost) can be defined as, Ppost = Ppre(hpre/hpost), where Ppre is the period of the primary star before the spin-up event. From our simulations we find that a single spin-up event can increase the specific angular momentum by up to 18%, and therefore Ppost = Ppre(1/1.18)∼0.85 Ppre. Therefore, a spin-up event of the magnitude measured in our strongest simulation can reduce the stellar rotation rate by around 15%.
3.2. Mechanism for primary star spin-up
We have demonstrated that the primary star in our simulations often experiences a spin-up event after the formation of companions. We aim to understand the mechanisms that trigger a spin-up event by investigating the stability of the disc material near the primary star during a spin-up event. In particular, we look at the simulations that show the strongest and weakest spin-up events, which are the turbulent Ωtff = 0.20 and non-turbulent Ωtff = 0.35 simulations, respectively.
We determine the stability of material around the primary by calculating the magnetic Toomre Q parameter (Forgan et al. 2017). This is an extension of the classic Toomre Q (Toomre 1964) to include support from magnetic fields within a disc against collapse. The Toomre Q for a parcel of gas in a near Keplerian disc is calculated as

where cs is the sound speed, Ω is the angular frequency (the tangential velocity divided by the radius, the same used in Sect. 2), G is the gravitational constant, and Σ is the gas surface density of the disc. The surface density in our simulations is derived from projections calculated over 200 AU thick slices, the same as those shown in Figs. 1 and 2. A parcel of gas is considered to be stable if Q ≫ 1, and unstable and prone to collapse if Q ≪ 1. The magnetic Toomre Q is calculated by multiplying the Toomre Q by a scaling factor,
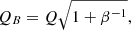
where β is the plasma beta of the gas parcel. This β factor arises from modifying the sound speed by adding the magnetic pressure to the thermal pressure (e.g. Federrath & Klessen 2012; Forgan et al. 2017).
The resulting magnetic Toomre Q distributions are shown in Figs. 7 and 8, for the strongest and weakest spin-up cases, respectively. For the strongest spin-up event (Fig. 7), we see that the spin-up begins before the formation of companions. In the first panel (i.e. 1000 yr before the event starts) we see that the primary star hosts a large circumstellar disc of radius ∼100 AU. The inner disc is very stable (Q ∼ 10), but the outer disc is marginally unstable (Q ∼ 1). This instability then grows to form strongly unstable spiral arms, making the inner disc unstable as well in the subsequent evolution. This triggers the spin-up event, funnelling material onto the primary star. From the strongly unstable spiral arms, companions from via fragmentation. After fragmentation, the spin-up event continues until the dense gas has been accreted, or redistributed, and a companion spins up and stabilises the circumstellar disc around the primary star.
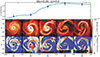 |
Fig. 7. Evolution of simulation with the strongest spin-up event. Top: Specific angular momentum of the primary around the spin-up event highlighted in Fig. 5 for the turbulent Ωtff = 0.20 simulation. The points on the curve are the times that are shown in the projections below. The second and fourth points are the beginning and end of the spin-up event, and the third point is the middle of the spin-up. Middle and bottom: Density projections (calculated in the same way as in Fig. 1) and the magnetic Toomre Q, respectively, at the times indicated by the points in the top panel. |
For the weakest spin-up event (Fig. 8) we see that many low-mass companions already exist before the spin-up event begins. These companions formed from the ring fragmentation at large separations (> 100 AU), described at the beginning of Sect. 3. Before the spin-up event, the primary star hosts a circumstellar disc of radius ∼50 AU, which is marginally unstable (Q ∼ 1). The spin-up event is triggered when the northern companion travels towards the primary, triggering a spiral arm, which is marginally unstable. The triggering of spiral arms due to interactions with a companion or flybys has been documented in previous star formation simulations (Kuruwita et al. 2020; Pfalzner & Govind 2021; Cuello et al. 2023). If the angular velocity of the flyby or companion star is lower than the angular velocity of the outer disc, material in the outer disc can be slowed down, and begin migrating inwards through the circumstellar disc, forming a spiral arm. In this scenario, angular momentum is transferred from the orbit to the circumstellar disc, and then onto the primary star (Kuruwita et al. 2020).
A second spiral arm is also triggered by another companion during the spin-up event, which may contribute to further spin-up of the primary star. The spin-up event ends when one of the companions has migrated inwards, spinning up and stabilising the circumstellar disc around the primary star.
4. Discussion
This work investigates the relation between binary and multiple star formation and the possible formation of fast rotators. To this end, we carried out simulations of a protostellar core collapse with varying initial conditions and observed spin-up events in the primary star to varying degrees.
4.1. The observed spin-up events in combination with disc lifetimes
After looking in detail at the strongest and weakest spin-up events, we determined that gravitational instabilities in the disc around the primary star trigger the spin-up event. The origin of these instabilities can be from within the disc itself, as seen in the strong spin-up case (see Fig. 7), or due to interactions with a companion, as seen in the weakest spin-up case (see Fig. 8). Thus, the discs that would produce the strongest spin-up events would also be prone to disc fragmentation, as seen in our strongest spin-up case. This may then contribute to the observations of many fast rotators having nearby (possibly undetected) companions. These companions may have formed from the strong spin-up event, which led to fragmentation.
While these spin-up events alone may not be sufficient to explain fast rotator formation, when coupled with shortened disc lifetimes, due to disc truncation by companions, this may provide a more compelling scenario for fast rotator formation. As observed in Fig. 5, after the spin-up event, in some cases the primary star spin would decrease slowly over an extended period. This is due to the primary accreting low-specific angular momentum material, thus reducing the spin. The effect of this slow spin-down can be reduced by shortened disc lifetimes.
Protostars are thought to experience a period of spin-down due to disc-locking soon after formation (Königl 1991). The presence of a circumstellar disc is necessary for disc-locking, therefore, the lifetime of the disc can also play a role in determining the spin of the star. This is the conclusion that is drawn from the analytical models in Gallet & Bouvier (2013, 2015), which found that shorter disc lifetimes around fast rotators allowed for more accurate modelling of the long-term evolution (1000 Myr after birth) of fast rotators. Circumstellar discs in binaries tend to be truncated if a companion is nearby, as seen here and in simulations by other groups (Artymowicz & Lubow 1994). Disc truncation by nearby companions is also suggested in observations of weaker millimetre flux, as well as direct imaging (Harris et al. 2012; Cox et al. 2017). The circumstellar disc truncation is likely to lead to shorter disc lifetimes (Kraus et al. 2012; Kuruwita et al. 2018), which may play a role in halting the spin-down time that protostars in binaries have, allowing the stars to maintain higher rotation rates for longer times. External photo-evaporation can also contribute to shortening disc lifetimes (Roquette et al. 2021), which would be enhanced in the clustered environments where multiple star systems form.
While shorter disc lifetimes are likely to play a role in the observed fast-rotator evolution, the models of Gallet & Bouvier (2013) set the initial rotation rate of their slow and fast rotators at birth. What sets this initial rotation is still in question, and our work suggests that disc fragmentation and interactions with companions may be a viable mechanism to increase the initial rotation of a star in its early evolution.
4.2. Resolution study to derive protostellar properties
Throughout this work, we used a sink particle method to study how protostars accrete angular momentum. While we have frequently referred to the sink particles as stars, the particle is actually modelling a combination of the star and inner disc, because it has an accretion radius of 4.9 AU. It is currently not possible to run these simulations for a long evolutionary time and resolve the stellar surface at the same time, due to the prohibitively high computational cost. We instead ran a resolution study on the simulation that showed the strongest spin-up event, to understand the dependence of the sink particle properties on resolution.
In this resolution study, we compared simulations with sink particle accretion radii of Rsink = 19.6, 9.8, 4.9, 2.4, 1.2 AU. The resulting accreted mass, total angular momentum (L), and specific angular momentum (h) of the sink particles are shown in Fig. 9. The rotation period of the sink particle is calculated using Eq. (6).
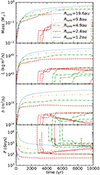 |
Fig. 9. Time evolution of the sink particle mass (top), angular momentum (second panel), mass-specific angular momentum (third panel), and rotation period (bottom) of the sink particles, comparing simulations with sink particle radii of 19.6 AU (dotted blue), 9.8 AU (dash-dot-dot orange), 4.9 AU (dash-dotted green), 2.4 AU (dashed red), and 1.2 AU (solid purple line). |
In all the panels of Fig. 9, we see that the mass, momentum and specific angular momentum of the primary star decrease with increasing resolution. This is because, as the accretion radius decreases, more mass remains in the gas near the sink particle in the inner disc, rather than being accreted onto the sink particle. With higher-resolution simulations, we can better resolve the high-velocity jet and wind-launching region near the protostar. The jets carry away mass and angular momentum from the circumstellar disc, reducing the mass and angular momentum accretion rate onto the star, as seen in the simulations before the formation of companions at around 2500 yr.
The angular momentum that is accreted onto a sink particle is directly proportional to the sink particle radius because angular momentum is proportional to r × v. The maximum radius that a sink particle can accrete from is defined by the accretion radius: a larger sink particle radius means more accreted angular momentum.
The resulting rotation period is directly proportional to the sink particle accretion radius and specific angular momentum as demonstrated in Eq. (6), showing Psink ∝ rsink2/hsink. Thus, with higher resolution (lower rsink), the rotation period of the sink particle decreases. The rotation periods that we can directly resolve with these simulations are orders of magnitude larger than the 2 days threshold that defines fast rotators (Kounkel et al. 2023).
Based on the trends found in this resolution study, we derived the relationships between the measured quantities and the resolution (parameterised by Rsink). We show the primary star’s mass, momentum, specific angular momentum, and rotation period, against the sink particle accretion radius in Fig. 10. We measured the primary star properties by taking the average of the minimum and maximum values between 1500 yr < t < 2500 yr (cf., Fig. 9). The period of 1500 yr < t < 2500 yr was chosen because the quantities are beginning to plateau in this time window, and companions have not formed yet, as we want to avoid companion formation interfering with a clean resolution study. The primary star values are plotted in blue in Fig. 10. The final values of the Rsink = 1.2 AU simulation are also plotted in grey as lower and upper limits (depending on the quantity in each panel), even though it has not reached 1500 yr. The intervals between the quantities in all the other simulations (Rsink > 1.2 AU) are relatively even, suggesting a power-law relationship between the quantity and the resolution. We used the curvefit function in the python package scipy to derive power-law fits to quantify the relationship, which are shown in orange in Fig. 10 and annotated in the top left of each panel. The values from the Rsink = 1.2 AU were not included in the fitting.
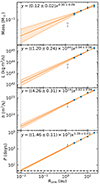 |
Fig. 10. Resolution study showing the primary star mass (top), angular momentum (second panel), mass-specific angular momentum (third panel), and rotation period (bottom) as a function of Rsink. For each of the blue data points, the error bars are the minimum and maximum values measures between 1500 yr < t < 2500 yr, and the point is the average of these. The orange line shows the derived power-law relationships and the transparent region shows the spread in the fit. The derived fit and error are annotated in the top left of each panel. The grey points show the quantities of the Rsink = 1.2 AU simulation, which has not reached 1500 yr and is therefore excluded from the fitting (only upper or lower limits are indicated). The vertical dashed line marks Rsink = 2 R⊙ ∼ 10−2 AU, and the horizontal dashed line in the bottom panel shows the 2 day threshold that defines fast rotators (Kounkel et al. 2023). |
We extended the derived power laws down to resolutions where the sink particle radius would be 2 R⊙, which is annotated by the vertical dotted grey line. We see that at Rsink = 2 R⊙ ∼ 10−2 AU, the rotation period of the sink particle would be < 10 days, which is consistent with observations. The dashed line in the bottom panel of Fig. 10 indicates the 2 day threshold that defines fast rotators, and we see that the extrapolation based on our resolution study reaches this limit. The comparison is made before companion formation, which we have shown triggers spin-up events within the primary star; therefore, at resolutions where the stellar surface is resolved and there is companion formation, the rotation period is expected to be even shorter.
Based on the extrapolations shown in Fig. 10, we calculated what fraction of a sink particle quantity would reside in a protostar of radius r = 2 R⊙ for all simulations. The lower and upper limits of these fractions are summarised in Table 2. We used these fractions to derive the properties of the primary star in our simulations. We see that, due to the large uncertainties in the accretion efficiencies, there is significant spread and overlap in the derived periods of the primary star, (see the bottom panel of Fig. 11). Despite the uncertainties, we see that the spread of periods of the simulations with stronger spin-up events (Ωtff = 0.20) are smaller with a low mean period, compared to the simulations with the weakest spin-up events (Ωtff = 0.35). In the bottom panel of Fig. 11, we mark the 2 day threshold used to define fast rotators, and we see that the mean rotation period of our simulation with the strongest spin-up passes this threshold after its spin-up event.
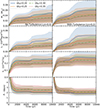 |
Fig. 11. Derived protostellar mass (top), angular momentum (second row), specific angular momentum (third row), and rotation period (bottom) for the non-turbulent (left) and turbulent simulations (right). The shaded regions are estimated upper and lower bounds of the quantity based on the resolution study, using accretion fractions summarised in Table 2. The solid lines are the means of the upper and lower bounds. The horizontal black line at 2 days highlights the boundary between fast rotators and non-fast rotators (Kounkel et al. 2023). |
5. Limitations and caveats
5.1. Numerical resolution
As discussed in Sect. 4.2, the chosen resolution in our simulations does not resolve the inner circumstellar disc where jets and high-velocity outflows are launched. These mechanisms are important for regulating the mass and angular momentum that is accreted onto the protostar.
To understand the effect of resolution on the initial spin-up of stars, we carried out a resolution study on the turbulent Ωtff = 0.20 simulation, which is presented in Sect. 4.2. In this study, we find that the formation of companions happens earlier in higher-resolution simulations than in lower-resolution simulations. This is likely because the small-scale turbulent modes are better resolved with higher resolution, and if fragmentation starts here, then the instability can grow faster if better resolved early on.
From the resolution study, we also observe that the rotation period of the sink particles measured after their initial spin-up during the protostellar collapse, but before the formation of companions, decreases with resolution. In Fig. 10, we extrapolated what the sink particle period would be at resolutions where the protostellar surface is resolved (Rsink ∼ 2 R⊙; Federrath et al. (2014)), and determined that this is well within observed rotation rates (< 10 days).
Another effect of resolution and finite numerical precision is that asymmetries can be introduced into symmetric setups. The simulation with Ωtff = 0.20 and no turbulence was intended to be a single-star simulation. This is a symmetric setup that should produce a single star as seen in previous works (Federrath et al. 2014; Kuruwita et al. 2017; Gerrard et al. 2019); however, those works only ran the simulations for at most 3000 yr. In this work, we pushed this simulation to 10 000 yr. A result of this is that, due to finite numerical precision and despite the initially symmetric setup, asymmetries are introduced that are amplified. This then leads to fragmentation later in the simulations.
However, we argue that before fragmentation, the systems are appropriate approximations of a single-star system. This is why we compared the spin of the primary star before and after companion formation. In most simulations, the primary star’s evolution in mass, angular momentum, and specific angular momentum is relatively steady before companion formation. Thus, as long as the companion(s) has/have not formed yet, the primary star’s evolution does not show evidence of spin-up.
5.2. Grid refinement
The initial conditions for the non-turbulent simulations are inherently symmetric, however, asymmetries can grow due to numerical round-off errors. Some of these round-off errors can be introduced where the AMR grid refines. In the case of the high-spin, non-turbulent simulations, the formation of a ring is physical, because it is a natural consequence of the high initial angular momentum of the protostellar cloud. However, the ring fragmentation is seeded by the grid noise, which is aligned with the grid. In this sense, the non-turbulence simulations are less reliable in what happens concerning fragmentation. However, despite the numerical seed of fragmentation, further asymmetries develop, and the system ‘forgets’ its initial conditions and evolves more realistically. The impact of the grid refinement on fragmentation is not seen in the turbulent simulations, as the fragmentation is seeded by physical perturbations in that case.
5.3. Radiation feedback
Radiation feedback is important for various aspects of star formation; for example, it heats gas, thus stabilise it against collapse or fragmentation, and it changes the ionisation fractions, which set the coupling between gas and magnetic fields (Wünsch 2024). Our simulations do not explicitly calculate radiative transfer; however, our equation of state accounts for some of the radiative effects on the local cell scale (see Sect. 2).
Most numerical work simulating radiation feedback has focused on massive star formation (Cunningham et al. 2011; Harries et al. 2017; Kuiper & Hosokawa 2018; Mignon-Risse et al. 2023). The consensus is that radiative feedback tends to reduce the formation of higher-order multiples, by reducing providing thermal support against fragmentation during massive star formation (Offner & Arce 2014; Rosen et al. 2019).
Radiation hydrodynamic simulations of low-mass protostellar collapse find that the initial collapse into a protostar is prolonged by radiative thermal support (Ahmad et al. 2023). However, if the protostellar core is massive enough, the inward pressure of the gravitational collapse can easily overwhelm the outward radiation pressure (Vaytet & Haugbølle 2017; Bhandare et al. 2018),
After the initial collapse of a protostellar core into a protostar, radiation feedback from the central star on the circumstellar disc will stabilise the disc against fragmentation (Bate 2012). Hydrodynamic simulations including radiation feedback have found that the primary star mass is higher because fragments are not forming from the over-densities and are instead being accreted onto the primary star, (Offner & Arce 2014). Accounting for thermal support in the creation of sink particles from over-densities in a circumstellar disc may be important for preventing artificial fragmentation. This is because over-densities that form can later be destroyed by shear turbulent motions within the disc (Oliva & Kuiper 2020). Bate (2012) conclude that the main physical processes involved in determining the properties of multiple stellar systems are gravity and gas dynamics.
Radiation smoothed particle hydrodynamic simulations of stellar flybys and triggered sub-stellar companion formation work carried out by Cadman et al. (2022). The authors find that flybys at separations of 100 < r < 400 AU could make a marginally stable circumstellar disc fragment, which is a similar conclusion to our results. The simulations of Cadman et al. (2022), however, neglect magnetic fields. The inclusion of both radiation and magnetism would likely lead to stronger support against gravitational collapse, limiting fragmentation.
Works combining radiation and magnetohydrodynamics (RMHD) looking at protostellar collapse have been carried out, but often struggle to progress beyond the first 2000 yr after protostar formation. RMHD simulations find that the radius of the first protostellar core is larger with radiation (Tomida et al. 2010). RMHD simulations find that magnetism and thermal forces both contribute to the launching of outflows (Bate et al. 2014), affecting the efficiency of mass and momentum lost in outflows. Simulations with radiation and non-ideal MHD will be discussed in Sect. 5.4.
The inclusion of radiative feedback in our simulations would reduce the amount of fragmentation observed. Stronger gravitational instabilities would be required for the simulated circumstellar discs to fragment. Our simulation with the largest spin-up event showed a strong gravitationally unstable spiral arm formed that fragmented. With radiation, the instability may last longer, leading to a longer and stronger spin-up event before fragmentation is triggered.
5.4. Non-ideal MHD effects and resolving outflows
Our simulations use ideal MHD; however, it is known that various non-ideal MHD effects begin to affect evolution on disc scales. The non-ideal effects of Ohmic resistivity, the Hall effect and ambipolar diffusion are important on scales ∼1.5, 2 − 3, and ≥3 scale heights, respectively (Wardle 2007; Salmeron & Wardle 2008; Königl & Salmeron 2011; Tomida et al. 2015; Marchand et al. 2016). Farther from the disc, the surface layers of discs are expected to be ionised by stellar radiation in the FUV and the ideal MHD limit is a reasonable approximation (Perez-Becker & Chiang 2011; Nolan et al. 2017).
A common problem with ideal MHD has been that angular momentum is too efficiently removed from collapsing protostellar cores, suppressing the formation of large circumstellar discs. This has been called the ‘magnetic braking catastrophe’. Non-ideal MHD provides a solution to this by changing the strength of coupling between the magnetic fields and gas based on ionisation fractions (Wurster et al. 2016).
Simulations with ambipolar diffusion find that magnetically driven outflows are weakened due to the diffusion (Masson et al. 2016). While our simulations do no explicitly calculate ambipolar diffusion, there is numerical diffusion, which has been argued to reproduce the effect of ambipolar diffusion at large scale-heights (Hennebelle & Inutsuka 2019). Simulations with Ohmic resistivity, which is most important in the mid-plane of circumstellar discs, find that because angular momentum is not efficiently removed, the disc surface density increases and gravitational instabilities form (Machida & Basu 2019).
Many simulations combining ambipolar diffusion and Ohmic resistivity continue to find the angular momentum removal via jets and outflows are weakened, helping in the creation of larger circumstellar discs (Dapp et al. 2012; Vaytet et al. 2018; Higuchi et al. 2019; Marchand et al. 2020). Simulations of the Hall effect confirm that the orientation of the rotation and magnetic field influences the size of discs formed (Zhao et al. 2021).
When all three non-ideal effects are simulated, it is difficult to determine which effects dominate in various scenarios. (Wurster et al. 2021) argues that the Hall effect has the greatest influence on disc formation and outflow efficiencies, but other work finds that dust distributions can influence whether the magnetic couple of ambipolar diffusion or the Hall effect dominates gas dynamics (Marchand et al. 2020; Zhao et al. 2021). While simulations of Ohmic diffusion find that gravitationally unstable discs form more easily, the inclusion of the other non-ideal effects may stabilise discs (Tu et al. 2024).
The overall conclusion is that non-ideal MHD effects reduce angular momentum removal efficiencies via jets and outflows, and help with the formation of large circumstellar discs. Because larger more massive discs are formed with non-ideal MHD, this increases the number of binary and multiple stars formed via disc fragmentation (Wurster et al. 2017). Therefore, the inclusion of non-ideal effects in our simulation may aid fragmentation, which is at odds with the impact of radiation feedback, which we concluded at the end of Sect. 5.3.
Non-ideal MHD effects are sensitive to the ionisation fraction of the gas, and radiation plays a role in setting these fractions; therefore, combining non-ideal MHD and radiative feedback is important to building a complete physical model of protostellar core collapse. Simulations aiming to combine some non-ideal effects and radiation find that while radiation pressure can contribute to outflows, jets and outflows are dominated by magnetism (Commerçon et al. 2022). The degree of ionisation influences outflow speeds (Wurster et al. 2018), but overall non-ideal effects reduce angular momentum removal (Tomida et al. 2015).
The inclusion of non-ideal effects in our simulations would weaken the angular momentum loss via outflows, leading to higher angular momentum being accreted onto the sink particles. However, due to resolution limits, we only resolved the low-velocity components, and we do not expect the observed sink-particle spin evolution to differ significantly with non-ideal MHD. The calculated protostellar rotation periods are significantly more sensitive to the assumption of mass and momentum accretion from the inner disc onto the protostar.
6. Summary and conclusion
In this study we investigated whether the formation of binary and multiple-star systems inherently leads to the formation of fast-rotating stars. This was inspired by observations suggesting that many fast rotators are expected to have a nearby, low-mass, unseen companion. We used MHD simulations of the collapse and fragmentation of turbulent and non-turbulent protostellar cores to shed light on this subject. We used a sink particle method to study the spin evolution of the stars that form. We find that in all simulations there is significant spin-up in the primary star, which is correlated with the formation of companions (Fig. 5). We further find that turbulent simulations produce stronger spin-up events than simulations without turbulence (Fig. 6). Upon further inspection, we identified two mechanisms that lead to these spin-up events:
Strong gravitational instability in a disc leading to fragmentation. In the simulation with the strongest observed spin-up event (18% increase in specific angular momentum, as quantified in Fig. 6) we find that the event begins before the formation of companions. The spin-up event is triggered by a strongly unstable perturbation (as quantified by Toomre Q) in the circumstellar disc, which creates spiral arms that funnel a large amount of specific angular momentum onto the primary star. Companions are eventually formed via the fragmentation of the unstable spiral arms within the disc, which slows down the spin-up event (Fig. 7).
Stellar flybys triggering a weaker gravitational instability. In the simulation with the weakest observed spin-up event (5% increase in specific angular momentum, as quantified in Fig. 6), we find that many companions always form at large separations. The spin-up event is triggered when one of these companions flies by the primary star, perturbing the marginally Toomre Q stable circumstellar disc and triggering the formation of a spiral arm, which spins up the primary star. Further fragmentation is not triggered in this scenario; however, the flyby companion settles into a lower separation orbit (Fig. 8).
Protostellar properties. We derived protostellar parameters from the sink particle data of the primary stars based on a resolution study (Fig. 9). We find that the simulations with the strongest spin-up events have lower period ranges, entering the fast rotator regime (Fig. 10).
Overall, we conclude that there is a causal relationship between strong spin-up events and the formation of nearby companions via disc fragmentation. The formation of nearby companions can also lead to truncated circumstellar discs and shorter spin-down times. The combination of strong spin-up events creating companions and disc truncation by these companions can explain why many fast rotators have unresolved nearby low-mass companions.
Acknowledgments
RLK acknowledges funding from the Klaus Tschira Foundation. C.F. acknowledges funding by the Australian Research Council (Discovery Projects grant DP230102280), and the Australia-Germany Joint Research Cooperation Scheme (UA-DAAD). C.F. further acknowledges high-performance computing resources provided by the Leibniz Rechenzentrum and the Gauss Centre for Supercomputing (grants pr32lo, pr48pi and GCS Large-scale project 10391), the Australian National Computational Infrastructure (grant ek9) and the Pawsey Supercomputing Centre (project pawsey0810) in the framework of the National Computational Merit Allocation Scheme and the ANU Merit Allocation Scheme. yt (Turk et al. 2011) was used to help visualise and analyse these simulations. The simulation software, FLASH, was in part developed by the Flash Centre for Computational Science at the University of Chicago and the Department of Physics and Astronomy at the University of Rochester.
References
- Affer, L., Micela, G., Favata, F., Flaccomio, E., & Bouvier, J. 2013, MNRAS, 430, 1433 [Google Scholar]
- Ahmad, A., González, M., Hennebelle, P., & Commerçon, B. 2023, A&A, 680, A23 [NASA ADS] [CrossRef] [EDP Sciences] [Google Scholar]
- Artymowicz, P., & Lubow, S. H. 1994, ApJ, 421, 651 [Google Scholar]
- Banerjee, R., & Pudritz, R. E. 2006, ApJ, 641, 949 [NASA ADS] [CrossRef] [Google Scholar]
- Bate, M. R. 2012, MNRAS, 419, 3115 [NASA ADS] [CrossRef] [Google Scholar]
- Bate, M. R., Tricco, T. S., & Price, D. J. 2014, MNRAS, 437, 77 [NASA ADS] [CrossRef] [Google Scholar]
- Bhandare, A., Kuiper, R., Henning, T., et al. 2018, A&A, 618, A95 [NASA ADS] [CrossRef] [EDP Sciences] [Google Scholar]
- Bouvier, J., Rigaut, F., & Nadeau, D. 1997, A&A, 323, 139 [NASA ADS] [Google Scholar]
- Cadman, J., Hall, C., Fontanive, C., & Rice, K. 2022, MNRAS, 511, 457 [NASA ADS] [CrossRef] [Google Scholar]
- Cieza, L., & Baliber, N. 2007, ApJ, 671, 605 [NASA ADS] [CrossRef] [Google Scholar]
- Commerçon, B., González, M., Mignon-Risse, R., Hennebelle, P., & Vaytet, N. 2022, A&A, 658, A52 [NASA ADS] [CrossRef] [EDP Sciences] [Google Scholar]
- Cox, E. G., Harris, R. J., Looney, L. W., et al. 2017, ApJ, 851, 83 [Google Scholar]
- Cuello, N., Ménard, F., & Price, D. J. 2023, Eur. Phys. J. Plus, 138, 11 [NASA ADS] [CrossRef] [Google Scholar]
- Cunningham, A. J., Klein, R. I., Krumholz, M. R., & McKee, C. F. 2011, ApJ, 740, 107 [NASA ADS] [CrossRef] [Google Scholar]
- Daher, C. M., Badenes, C., Tayar, J., et al. 2022, MNRAS, 512, 2051 [NASA ADS] [CrossRef] [Google Scholar]
- Dapp, W. B., Basu, S., & Kunz, M. W. 2012, A&A, 541, A35 [NASA ADS] [CrossRef] [EDP Sciences] [Google Scholar]
- Dubey, A., Fisher, R., Graziani, C., et al. 2008, ASP Conf. Ser., 385, 145 [NASA ADS] [Google Scholar]
- Edwards, S., Strom, S. E., Hartigan, P., et al. 1993, AJ, 106, 372 [NASA ADS] [CrossRef] [Google Scholar]
- Eggenberger, P., Haemmerlé, L., Meynet, G., & Maeder, A. 2012, A&A, 539, A70 [NASA ADS] [CrossRef] [EDP Sciences] [Google Scholar]
- Federrath, C., & Klessen, R. S. 2012, ApJ, 761, 156 [Google Scholar]
- Federrath, C., Banerjee, R., Clark, P. C., & Klessen, R. S. 2010a, ApJ, 713, 269 [NASA ADS] [CrossRef] [Google Scholar]
- Federrath, C., Roman-Duval, J., Klessen, R. S., Schmidt, W., & Low, M.-M. M. 2010b, A&A, 512, A81 [NASA ADS] [CrossRef] [EDP Sciences] [Google Scholar]
- Federrath, C., Banerjee, R., Seifried, D., Clark, P. C., & Klessen, R. S. 2011, IAU Symp., 270, 425 [NASA ADS] [Google Scholar]
- Federrath, C., Schrön, M., Banerjee, R., & Klessen, R. S. 2014, ApJ, 790, 128 [NASA ADS] [CrossRef] [Google Scholar]
- Forgan, D., Price, D. J., & Bonnell, I. 2017, MNRAS, 466, 3406 [NASA ADS] [CrossRef] [Google Scholar]
- Fryxell, B., Olson, K., Ricker, P., et al. 2000, ApJS, 131, 273 [Google Scholar]
- Gallet, F., & Bouvier, J. 2013, A&A, 556, A36 [NASA ADS] [CrossRef] [EDP Sciences] [Google Scholar]
- Gallet, F., & Bouvier, J. 2015, A&A, 577, A98 [NASA ADS] [CrossRef] [EDP Sciences] [Google Scholar]
- Gerrard, I. A., Federrath, C., & Kuruwita, R. 2019, MNRAS, 485, 5532 [CrossRef] [Google Scholar]
- Harries, T. J., Douglas, T. A., & Ali, A. 2017, MNRAS, 471, 4111 [NASA ADS] [CrossRef] [Google Scholar]
- Harris, R. J., Andrews, S. M., Wilner, D. J., & Kraus, A. L. 2012, ApJ, 751, 115 [Google Scholar]
- Hennebelle, P., & Inutsuka, S.-I. 2019, Front. Astron. Space Sci., 6, 5 [NASA ADS] [CrossRef] [Google Scholar]
- Higuchi, K., Machida, M. N., & Susa, H. 2019, MNRAS, 486, 3741 [NASA ADS] [CrossRef] [Google Scholar]
- Königl, A. 1991, ApJ, 370, L39 [CrossRef] [Google Scholar]
- Königl, A., & Salmeron, R. 2011, The Effects of Large-Scale Magnetic Fields on Disk Formation and Evolution, Physical Processes in Circumstellar Disks around Young Stars (Chicago: University of Chicago Press) [Google Scholar]
- Kounkel, M., Stassun, K. G., Hillenbrand, L. A., et al. 2023, AJ, 165, 182 [NASA ADS] [CrossRef] [Google Scholar]
- Kraus, A. L., Ireland, M. J., Hillenbrand, L. A., & Martinache, F. 2012, ApJ, 745, 19 [Google Scholar]
- Kraus, A. L., Ireland, M. J., Huber, D., Mann, A. W., & Dupuy, T. J. 2016, AJ, 152, 8 [NASA ADS] [CrossRef] [Google Scholar]
- Kuiper, R., & Hosokawa, T. 2018, A&A, 616, A101 [NASA ADS] [CrossRef] [EDP Sciences] [Google Scholar]
- Kuruwita, R. L., & Federrath, C. 2019, MNRAS, 486, 3647 [NASA ADS] [CrossRef] [Google Scholar]
- Kuruwita, R. L., Federrath, C., & Ireland, M. 2017, MNRAS, 470, 1626 [NASA ADS] [CrossRef] [Google Scholar]
- Kuruwita, R. L., Ireland, M., Rizzuto, A., Bento, J., & Federrath, C. 2018, MNRAS, 480, 5099 [NASA ADS] [CrossRef] [Google Scholar]
- Kuruwita, R. L., Federrath, C., & Haugbølle, T. 2020, A&A, 641, A59 [NASA ADS] [CrossRef] [EDP Sciences] [Google Scholar]
- Machida, M. N., & Basu, S. 2019, ApJ, 876, 149 [CrossRef] [Google Scholar]
- Machida, M. N., Inutsuka, S.-I., & Matsumoto, T. 2008, ApJ, 676, 1088 [CrossRef] [Google Scholar]
- Marchand, P., Masson, J., Chabrier, G., et al. 2016, A&A, 592, A18 [NASA ADS] [CrossRef] [EDP Sciences] [Google Scholar]
- Marchand, P., Tomida, K., Tanaka, K. E. I., Commerçon, B., & Chabrier, G. 2020, ApJ, 900, 180 [CrossRef] [Google Scholar]
- Masson, J., Chabrier, G., Hennebelle, P., Vaytet, N., & Commerçon, B. 2016, A&A, 587, A32 [NASA ADS] [CrossRef] [EDP Sciences] [Google Scholar]
- Masunaga, H., & Inutsuka, S.-I. 2000, ApJ, 531, 350 [NASA ADS] [CrossRef] [Google Scholar]
- Mignon-Risse, R., Oliva, A., González, M., Kuiper, R., & Commerçon, B. 2023, A&A, 672, A88 [NASA ADS] [CrossRef] [EDP Sciences] [Google Scholar]
- Mouschovias, T. C., & Spitzer, L. 1976, ApJ, 210, 326 [NASA ADS] [CrossRef] [Google Scholar]
- Nolan, C. A., Salmeron, R., Federrath, C., Bicknell, G. V., & Sutherland, R. S. 2017, MNRAS, 471, 1488 [NASA ADS] [CrossRef] [Google Scholar]
- Offner, S. S. R., & Arce, H. G. 2014, ApJ, 784, 61 [NASA ADS] [CrossRef] [Google Scholar]
- Oliva, G. A., & Kuiper, R. 2020, A&A, 644, A41 [NASA ADS] [CrossRef] [EDP Sciences] [Google Scholar]
- Perez-Becker, D., & Chiang, E. 2011, ApJ, 735, 8 [Google Scholar]
- Pfalzner, S., & Govind, A. 2021, ApJ, 921, 90 [NASA ADS] [CrossRef] [Google Scholar]
- Rebull, L. M., Wolff, S. C., & Strom, S. E. 2004, AJ, 127, 1029 [Google Scholar]
- Roquette, J., Matt, S. P., Winter, A. J., Amard, L., & Stasevic, S. 2021, MNRAS, 508, 3710 [NASA ADS] [CrossRef] [Google Scholar]
- Rosen, A. L., Li, P. S., Zhang, Q., & Burkhart, B. 2019, ApJ, 887, 108 [NASA ADS] [CrossRef] [Google Scholar]
- Salmeron, R., & Wardle, M. 2008, MNRAS, 388, 1223 [NASA ADS] [Google Scholar]
- Stauffer, J. 1994, ASP Conf. Ser., 64, 163 [NASA ADS] [Google Scholar]
- Tomida, K., Tomisaka, K., Matsumoto, T., et al. 2010, ApJ, 714, L58 [NASA ADS] [CrossRef] [Google Scholar]
- Tomida, K., Okuzumi, S., & Machida, M. N. 2015, ApJ, 801, 117 [Google Scholar]
- Toomre, A. 1964, ApJ, 139, 1217 [Google Scholar]
- Truelove, J. K., Klein, R. I., McKee, C. F., et al. 1997, ApJ, 489, L179 [CrossRef] [Google Scholar]
- Tu, Y., Li, Z.-Y., Lam, K. H., Tomida, K., & Hsu, C.-Y. 2024, MNRAS, 527, 10131 [Google Scholar]
- Turk, M. J., Smith, B. D., Oishi, J. S., et al. 2011, ApJS, 192, 9 [NASA ADS] [CrossRef] [Google Scholar]
- Vaytet, N., & Haugbølle, T. 2017, A&A, 598, A116 [NASA ADS] [CrossRef] [EDP Sciences] [Google Scholar]
- Vaytet, N., Commerçon, B., Masson, J., González, M., & Chabrier, G. 2018, A&A, 615, A5 [NASA ADS] [CrossRef] [EDP Sciences] [Google Scholar]
- Waagan, K., Federrath, C., & Klingenberg, C. 2011, J. Comput. Phys., 230, 3331 [NASA ADS] [CrossRef] [Google Scholar]
- Wardle, M. 2007, Astrophys. Space Sci., 311, 35 [NASA ADS] [CrossRef] [Google Scholar]
- Wünsch, R. 2024, Front. Astron. Space Sci., 11 [Google Scholar]
- Wünsch, R., Walch, S., Dinnbier, F., & Whitworth, A. 2018, MNRAS, 475, 3393 [CrossRef] [Google Scholar]
- Wurster, J., Price, D. J., & Bate, M. R. 2016, MNRAS, 457, 1037 [Google Scholar]
- Wurster, J., Price, D. J., & Bate, M. R. 2017, MNRAS, 466, 1788 [NASA ADS] [CrossRef] [Google Scholar]
- Wurster, J., Bate, M. R., & Price, D. J. 2018, MNRAS, 475, 1859 [NASA ADS] [CrossRef] [Google Scholar]
- Wurster, J., Bate, M. R., & Bonnell, I. A. 2021, MNRAS, 507, 2354 [NASA ADS] [CrossRef] [Google Scholar]
- Zhao, B., Caselli, P., Li, Z.-Y., et al. 2021, MNRAS, 505, 5142 [NASA ADS] [CrossRef] [Google Scholar]
All Tables
Number of stars formed by 10 000 yr after primary star formation in each simulation.
All Figures
|
Fig. 1. Projections of the density over 200 AU thick slices at different times, for the non-turbulent simulations. The rows from top to bottom show simulations from low to high initial spin (Ωtff = 0.20 to 0.35). The time since the formation of the primary star is annotated in the top left of each panel. The columns are the simulations at time 0, 3333, 6666 and 10 000 yr after the first protostar forms. The sink particles are annotated with coloured crosses, and their masses are annotated at the bottom of each panel. The vector field shows the integrated velocity field, and the streamlines show the magnetic field. |
| In the text | |
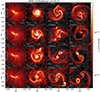 |
Fig. 2. Same as Fig. 1, but for the simulations with turbulence (Mach number ℳ = 0.2). |
| In the text | |
|
Fig. 3. Mass of the sink particles since the formation of the primary star for simulations without turbulence (top) and with turbulence (bottom). The initial spin of the simulations is indicated in the legend. Each line shows the mass of an individual sink particle. |
| In the text | |
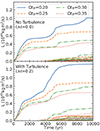 |
Fig. 4. Same as Fig. 3, but for the total angular momentum accreted by the sink particles. |
| In the text | |
|
Fig. 5. Same as Fig. 3, but for the mass-specific angular momentum accreted by the sink particles. The highlighted regions indicate the first spin-up event after the formation of companions. |
| In the text | |
|
Fig. 6. Measured spin-up calculated relative to the angular momentum (ΔL; top) and specific angular momentum (Δh; bottom) of the primary star at 500 yr before the formation of the secondary companion, and the peak momentum in the highlighted regions in Fig. 5. |
| In the text | |
|
Fig. 7. Evolution of simulation with the strongest spin-up event. Top: Specific angular momentum of the primary around the spin-up event highlighted in Fig. 5 for the turbulent Ωtff = 0.20 simulation. The points on the curve are the times that are shown in the projections below. The second and fourth points are the beginning and end of the spin-up event, and the third point is the middle of the spin-up. Middle and bottom: Density projections (calculated in the same way as in Fig. 1) and the magnetic Toomre Q, respectively, at the times indicated by the points in the top panel. |
| In the text | |
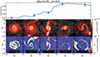 |
Fig. 8. Same as Fig. 7, but for the non-turbulent Ωtff = 0.35 simulation. |
| In the text | |
|
Fig. 9. Time evolution of the sink particle mass (top), angular momentum (second panel), mass-specific angular momentum (third panel), and rotation period (bottom) of the sink particles, comparing simulations with sink particle radii of 19.6 AU (dotted blue), 9.8 AU (dash-dot-dot orange), 4.9 AU (dash-dotted green), 2.4 AU (dashed red), and 1.2 AU (solid purple line). |
| In the text | |
|
Fig. 10. Resolution study showing the primary star mass (top), angular momentum (second panel), mass-specific angular momentum (third panel), and rotation period (bottom) as a function of Rsink. For each of the blue data points, the error bars are the minimum and maximum values measures between 1500 yr < t < 2500 yr, and the point is the average of these. The orange line shows the derived power-law relationships and the transparent region shows the spread in the fit. The derived fit and error are annotated in the top left of each panel. The grey points show the quantities of the Rsink = 1.2 AU simulation, which has not reached 1500 yr and is therefore excluded from the fitting (only upper or lower limits are indicated). The vertical dashed line marks Rsink = 2 R⊙ ∼ 10−2 AU, and the horizontal dashed line in the bottom panel shows the 2 day threshold that defines fast rotators (Kounkel et al. 2023). |
| In the text | |
|
Fig. 11. Derived protostellar mass (top), angular momentum (second row), specific angular momentum (third row), and rotation period (bottom) for the non-turbulent (left) and turbulent simulations (right). The shaded regions are estimated upper and lower bounds of the quantity based on the resolution study, using accretion fractions summarised in Table 2. The solid lines are the means of the upper and lower bounds. The horizontal black line at 2 days highlights the boundary between fast rotators and non-fast rotators (Kounkel et al. 2023). |
| In the text | |
Current usage metrics show cumulative count of Article Views (full-text article views including HTML views, PDF and ePub downloads, according to the available data) and Abstracts Views on Vision4Press platform.
Data correspond to usage on the plateform after 2015. The current usage metrics is available 48-96 hours after online publication and is updated daily on week days.
Initial download of the metrics may take a while.