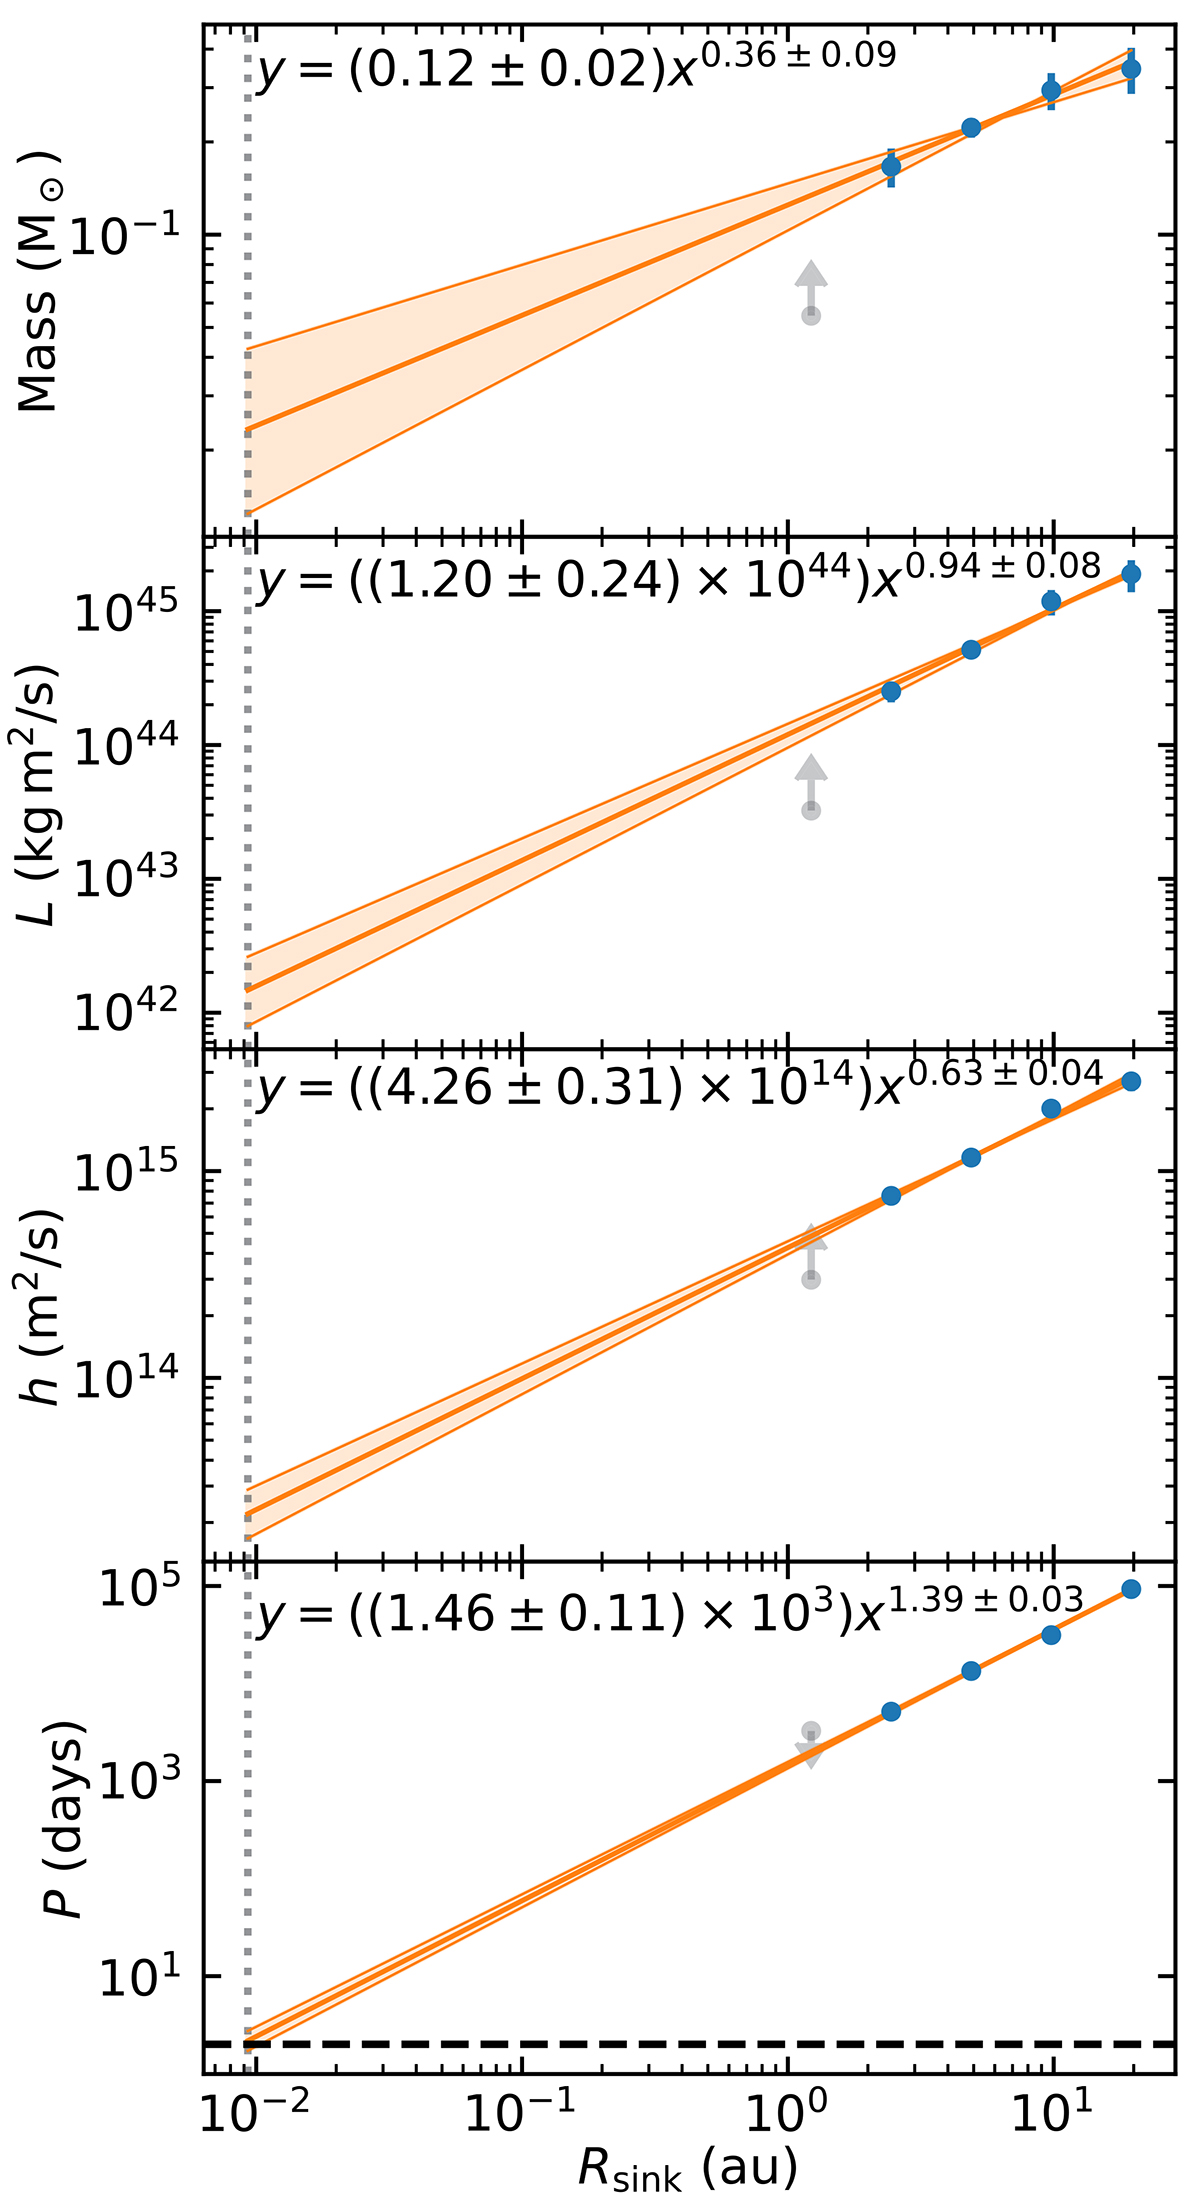
Fig. 10.
Download original image
Resolution study showing the primary star mass (top), angular momentum (second panel), mass-specific angular momentum (third panel), and rotation period (bottom) as a function of Rsink. For each of the blue data points, the error bars are the minimum and maximum values measures between 1500 yr < t < 2500 yr, and the point is the average of these. The orange line shows the derived power-law relationships and the transparent region shows the spread in the fit. The derived fit and error are annotated in the top left of each panel. The grey points show the quantities of the Rsink = 1.2 AU simulation, which has not reached 1500 yr and is therefore excluded from the fitting (only upper or lower limits are indicated). The vertical dashed line marks Rsink = 2 R⊙ ∼ 10−2 AU, and the horizontal dashed line in the bottom panel shows the 2 day threshold that defines fast rotators (Kounkel et al. 2023).
Current usage metrics show cumulative count of Article Views (full-text article views including HTML views, PDF and ePub downloads, according to the available data) and Abstracts Views on Vision4Press platform.
Data correspond to usage on the plateform after 2015. The current usage metrics is available 48-96 hours after online publication and is updated daily on week days.
Initial download of the metrics may take a while.