Fig. 7.
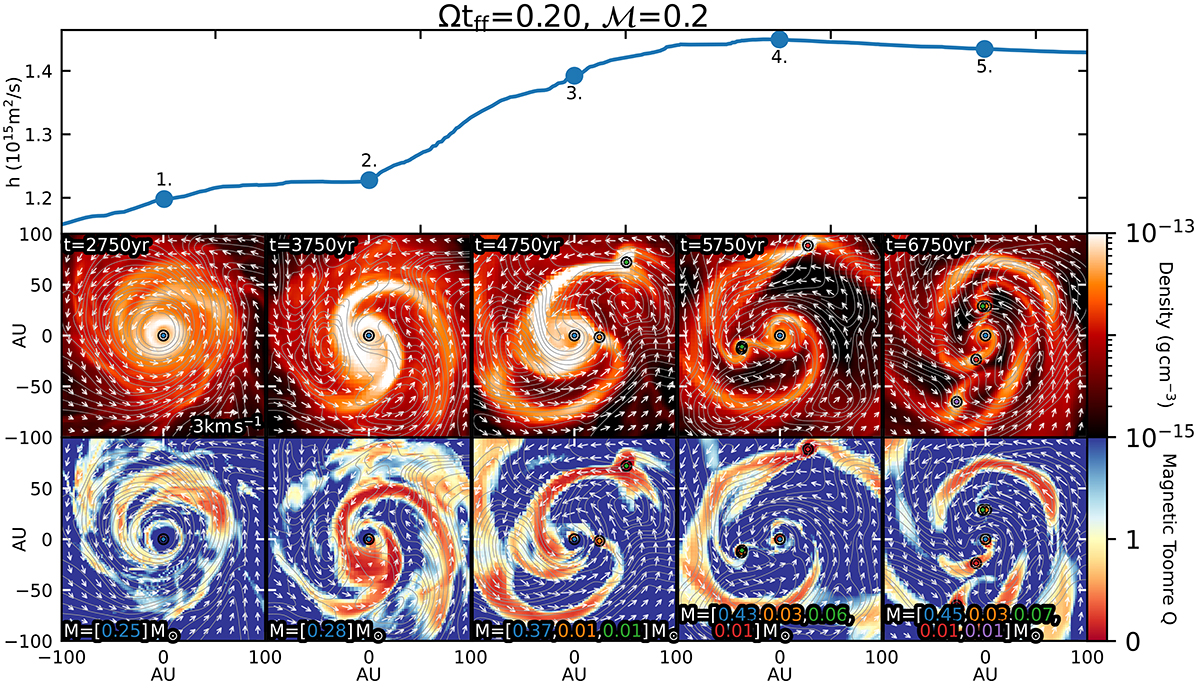
Download original image
Evolution of simulation with the strongest spin-up event. Top: Specific angular momentum of the primary around the spin-up event highlighted in Fig. 5 for the turbulent Ωtff = 0.20 simulation. The points on the curve are the times that are shown in the projections below. The second and fourth points are the beginning and end of the spin-up event, and the third point is the middle of the spin-up. Middle and bottom: Density projections (calculated in the same way as in Fig. 1) and the magnetic Toomre Q, respectively, at the times indicated by the points in the top panel.
Current usage metrics show cumulative count of Article Views (full-text article views including HTML views, PDF and ePub downloads, according to the available data) and Abstracts Views on Vision4Press platform.
Data correspond to usage on the plateform after 2015. The current usage metrics is available 48-96 hours after online publication and is updated daily on week days.
Initial download of the metrics may take a while.