Fig. 1.
Download original image
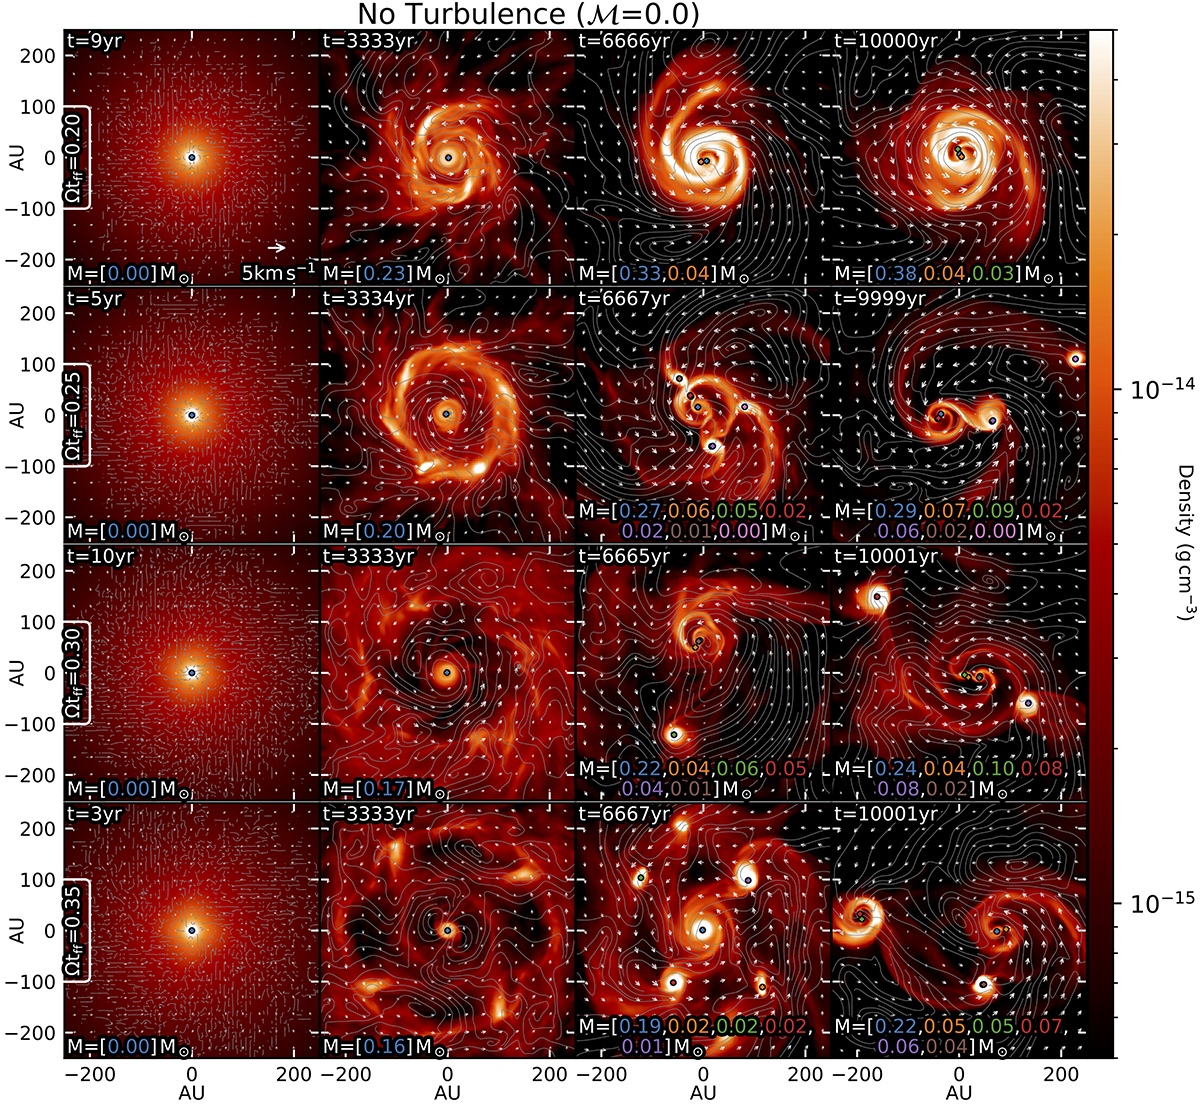
Projections of the density over 200 AU thick slices at different times, for the non-turbulent simulations. The rows from top to bottom show simulations from low to high initial spin (Ωtff = 0.20 to 0.35). The time since the formation of the primary star is annotated in the top left of each panel. The columns are the simulations at time 0, 3333, 6666 and 10 000 yr after the first protostar forms. The sink particles are annotated with coloured crosses, and their masses are annotated at the bottom of each panel. The vector field shows the integrated velocity field, and the streamlines show the magnetic field.
Current usage metrics show cumulative count of Article Views (full-text article views including HTML views, PDF and ePub downloads, according to the available data) and Abstracts Views on Vision4Press platform.
Data correspond to usage on the plateform after 2015. The current usage metrics is available 48-96 hours after online publication and is updated daily on week days.
Initial download of the metrics may take a while.