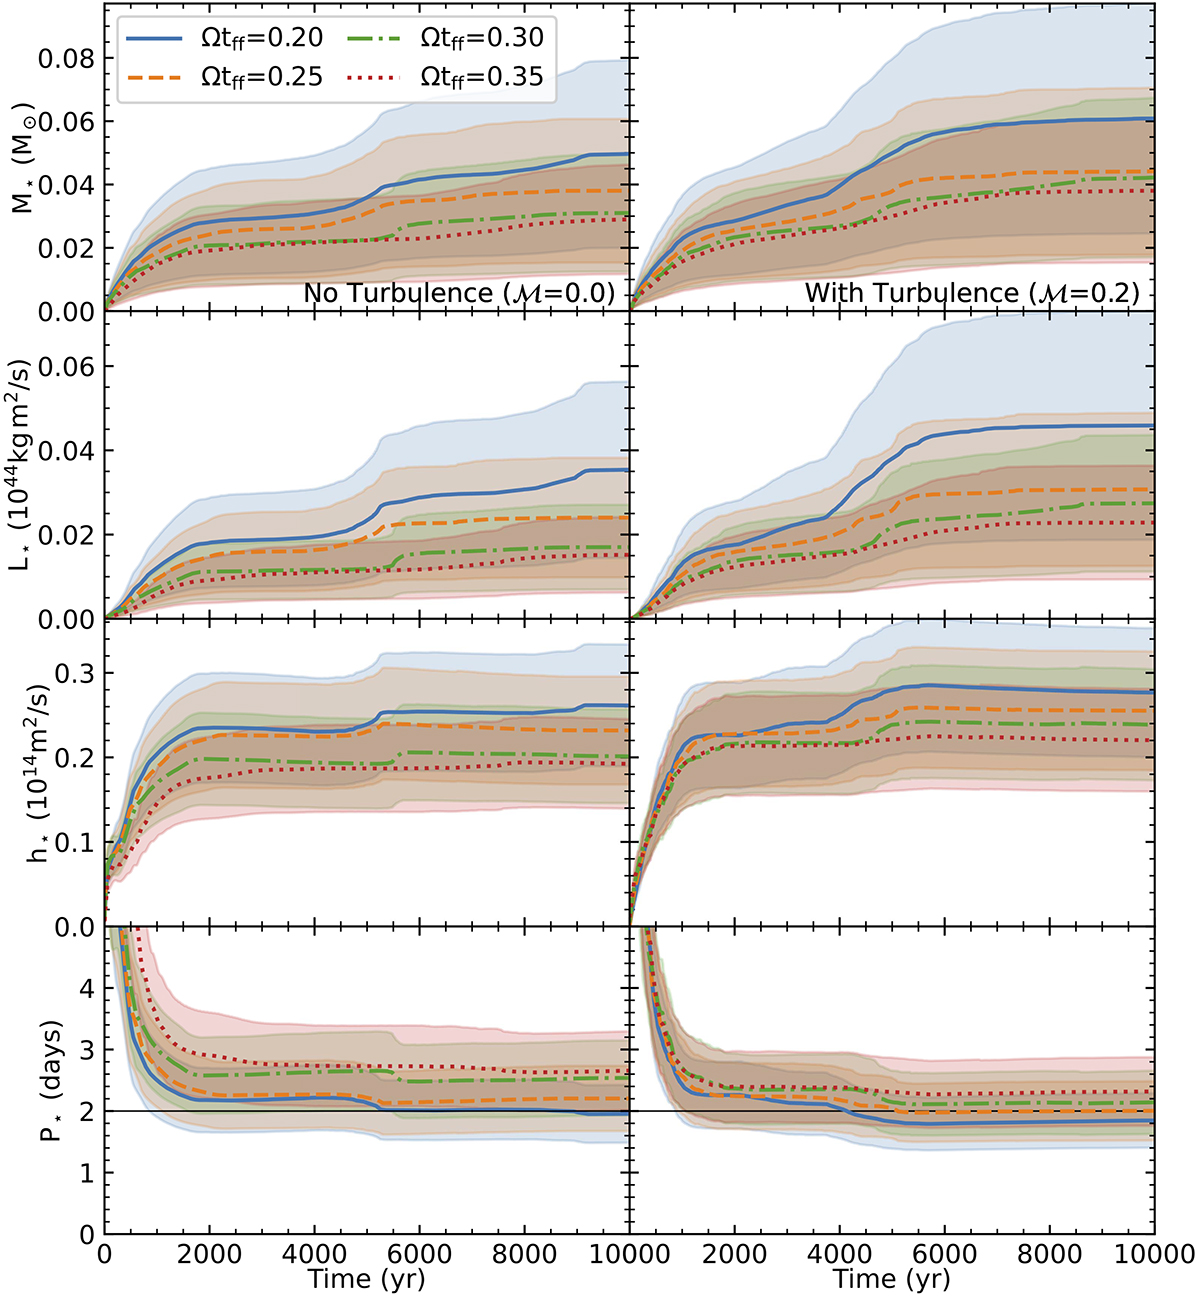
Fig. 11.
Download original image
Derived protostellar mass (top), angular momentum (second row), specific angular momentum (third row), and rotation period (bottom) for the non-turbulent (left) and turbulent simulations (right). The shaded regions are estimated upper and lower bounds of the quantity based on the resolution study, using accretion fractions summarised in Table 2. The solid lines are the means of the upper and lower bounds. The horizontal black line at 2 days highlights the boundary between fast rotators and non-fast rotators (Kounkel et al. 2023).
Current usage metrics show cumulative count of Article Views (full-text article views including HTML views, PDF and ePub downloads, according to the available data) and Abstracts Views on Vision4Press platform.
Data correspond to usage on the plateform after 2015. The current usage metrics is available 48-96 hours after online publication and is updated daily on week days.
Initial download of the metrics may take a while.