| Issue |
A&A
Volume 689, September 2024
|
|
|---|---|---|
| Article Number | A352 | |
| Number of page(s) | 13 | |
| Section | Interstellar and circumstellar matter | |
| DOI | https://doi.org/10.1051/0004-6361/202449943 | |
| Published online | 24 September 2024 | |
SDSS-V Local Volume Mapper (LVM): A glimpse into Orion
1
Astronomisches Rechen-Institut, Zentrum für Astronomie der Universität Heidelberg,
Mönchhofstraße 12-14,
69120
Heidelberg,
Germany
2
Observatories of the Carnegie Institution for Science,
813 Santa Barbara Street,
Pasadena,
CA
91101,
USA
3
Departamento de Astronomía, Universidad de Chile,
Camino del Observatorio 1515, Las Condes,
Santiago,
Chile
4
McDonald Observatory, The University of Texas at Austin,
1 University Station,
Austin,
TX
78712-0259,
USA
5
Department of Physics, University of North Florida,
1 UNF Dr.
Jacksonville
FL
32224,
USA
6
Universidad Nacional Autónoma de México, Instituto de Astronomía,
AP 106,
Ensenada
22800,
BC,
Mexico
7
Center for Astrophysics and Space Astronomy, University of Colorado,
389 UCB,
Boulder,
CO
80309-0389,
USA
8
Departamento de Astronomía, Universidad de Concepción, Casilla
160-C,
Concepción,
Chile
9
Franco-Chilean Laboratory for Astronomy,
IRL 3386, CNRS and Universidad de Chile,
Santiago,
Chile
10
Max-Planck-Institut für Astronomie,
Königstuhl 17,
69117,
Heidelberg,
Germany
11
Apache Point Observatory and New Mexico State University,
PO Box 59,
Sunspot,
NM
88349-0059,
USA
12
Department of Physics and Astronomy, University of Utah,
115 S. 1400 E.,
Salt Lake City,
UT
84112,
USA
13
European Southern Observatory,
Avenida Alonso de Cordoba 3107, Casilla 19,
Santiago
19001,
Chile
14
Chinese Academy of Sciences South America Center for Astronomy, National Astronomical Observatories, CAS,
Beijing
100101,
China
15
Instituto de Astronomía, Universidad Católica del Norte,
Av. Angamos 0610,
Antofagasta,
Chile
16
Department of Astronomy, California Institute of Technology,
Pasadena,
CA
91125,
USA
17
Universidad Nacional Autónoma de México, Instituto de Astronomía,
AP 70-264,
CDMX 04510,
Mexico
18
Harvard-Smithsonian Center for Astrophysics,
Cambridge,
MA
02138,
USA
19
Instituto de Estudios Astrofísicos, Facultad de Ingeniería y Ciencias, Universidad Diego Portales,
Av. Ejército Libertador 441,
Santiago,
Chile
20
Space Telescope Science Institute,
3700 San Martin Drive,
Baltimore,
MD
21218,
USA
21
Steward Observatory, University of Arizona,
933 N. Cherry Ave.,
Tucson,
AZ
85721-0065,
USA
22
Canadian Institute for Theoretical Astrophysics (CITA), University of Toronto,
60 St George St,
Toronto,
ON M5S 3H8,
Canada
23
Department of Physics, Colorado College,
Colorado Springs,
CO
80903,
USA
24
Homer L. Dodge Department of Physics and Astronomy, University of Oklahoma,
Norman,
OK
73019,
USA
25
Department of Astronomy, University of Washington,
Seattle,
WA,
98195,
USA
26
Center for Astrophysics and Space Sciences, Department of Physics, University of California, San Diego,
9500 Gilman Drive,
La Jolla,
CA
92093,
USA
27
Department of Astronomy, University of Illinois,
Urbana,
IL
61801,
USA
Received:
11
March
2024
Accepted:
21
July
2024
Abstract
Context. The Orion Molecular Cloud complex, one of the nearest (D = 406 pc) and most extensively studied massive star-forming regions, is ideal for constraining the physics of stellar feedback, but its ~12 deg diameter on the sky requires a dedicated approach to mapping ionized gas structures within and around the nebula.
Aims. The Sloan Digital Sky Survey (SDSS-V) Local Volume Mapper (LVM) is a new optical integral field unit (IFU) that will map the ionized gas within the Milky Way and Local Group galaxies, covering 4300 deg2 of the sky with the new LVM Instrument (LMV-I).
Methods. We showcase optical emission line maps from LVM covering 12 deg2 inside of the Orion belt region, with 195 000 individual spectra combined to produce images at 0.07 pc (35.3″) resolution. This is the largest IFU map made (to date) of the Milky Way, and contains well-known nebulae (the Horsehead Nebula, Flame Nebula, IC 434, and IC 432), as well as ionized interfaces with the neighboring dense Orion B molecular cloud.
Results. We resolve the ionization structure of each nebula, and map the increase in both the [S II]/Hα and [N II]/Hα line ratios at the outskirts of nebulae and along the ionization front with Orion B. [O III] line emission is only spatially resolved within the center of the Flame Nebula and IC 434, and our ~0.1 pc scale line ratio diagrams show how variations in these diagnostics are lost as we move from the resolved to the integrated view of each nebula. We detect ionized gas emission associated with the dusty bow wave driven ahead of the star σ Orionis, where the stellar wind interacts with the ambient interstellar medium. The Horsehead Nebula is seen as a dark occlusion of the bright surrounding photo-disassociation region. This small glimpse into Orion only hints at the rich science that will be enabled by the LVM.
Key words: ISM: clouds / ISM: general / HII regions / local insterstellar matter
Corresponding author; This email address is being protected from spambots. You need JavaScript enabled to view it.
© The Authors 2024
 Open Access article, published by EDP Sciences, under the terms of the Creative Commons Attribution License (https://creativecommons.org/licenses/by/4.0), which permits unrestricted use, distribution, and reproduction in any medium, provided the original work is properly cited.
This article is published in open access under the Subscribe to Open model. This email address is being protected from spambots. You need JavaScript enabled to view it. to support open access publication.
1 Introduction
The Orion Complex is one of the largest and best studied star-forming regions in the Solar neighborhood, hosting also one of the most nearby OB associations (see Bally 2008; O’Dell et al. 2011; Bouy & Alves 2015, and references therein). Renowned for its striking ionized nebulae, dense molecular clouds and a rich population of young star clusters at distinct stages of early evolution (Megeath et al. 2016; Stutz & Gould 2016; Furlan et al. 2016), it provides an unparalleled laboratory for studying the physics of star formation. Given its proximity (406 pc; Menten et al. 2007; Kounkel et al. 2018; Binder & Povich 2018), the Orion region has historically served as a test bed for theories of the sub-parsec scale interplay between gas, dust, and young massive stars (Barnard 1894; Sharpless 1952; O’Dell & Hubbard 1965; Becklin & Neugebauer 1967; Zuckerman 1973; Tielens & Hollenbach 1985; Genzel & Stutzki 1989; O’Dell et al. 2003, 2023).
Given its wide ~ 12 deg diameter on the sky, modern studies have developed a comprehensive view across the entire region through rich multi-wavelength survey efforts. Molecular gas surveys have established a detailed view of multiple molecular lines across the bright cloud complexes (Wilson et al. 2005; Kong et al. 2018; Stanke et al. 2022). Dust mapping via stellar extinction was pioneered in the Orion region, tracing the 3D structures in the region (Lombardi et al. 2011; Schlafly et al. 2015; Leike et al. 2020; Foley et al. 2023; Edenhofer et al. 2024). Near to far-infrared surveys with space based instrumentation like the Spitzer, Herschel, and WISE observatories (Megeath et al. 2012, 2016; Stutz et al. 2013), and ground based facilities (e.g., Hernández et al. 2014; Meingast et al. 2016; Briceño et al. 2019; Großschedl et al. 2019) have built complete samples of young embedded protostars, tracking the earliest phases of star formation. Deep near-infrared and optical imaging surveys by Hubble have produced definitive studies of the stellar cluster, cataloging the stars, brown dwarfs, and planets (Robberto et al. 2013, 2020). With the advent of Gaia and other ongoing stellar spectroscopic surveys (e.g., SDSS-IV APOGEE, Majewski et al. 2017; Jönsson et al. 2020) we have recently been able to develop rich datasets cataloging stars in the region, providing robust measurements of stellar distances, spectral types, and group kinematics (Stutz & Gould 2016; Fang et al. 2017; Kounkel et al. 2018; Cottle et al. 2018; Zari et al. 2019; Bailer-Jones et al. 2021a).
Studies of the ionized gas in the region have been somewhat more limited, due to the challenge of carrying out continuum subtraction of bright (1st and 2nd magnitude) stars. Low angular resolution coverage of Hα emission was achieved with the ~1 deg Wisconsin H-alpha Mapper (WHAM) Sky survey (WHAM; Haffner et al. 1999, 2003), and a sharper ~1 arcmin view obtained with the Southern H-alpha Sky Survey Atlas (SHASSA; Gaustad et al. 2001), with both surveys offering a general view of the large-scale features. The exception is the Orion Nebula (M42), including the Huygens region (Huygens 1659) and ionizing Orion Nebula Cluster, that historically has been extensively studied (O’Dell & Hubbard 1965; Peimbert & Torres-Peimbert 1977; Baldwin et al. 1991; Esteban et al. 2004; Simón-Díaz et al. 2006; Blagrave et al. 2007; Méndez-Delgado et al. 2021). Optical integral field unit (IFU) spectroscopic maps would provide a natural link to the existing rich datasets, but existing instruments with wide field of view (e.g., ~1 arcmin with PPAK, VIRUS-P, MUSE) are inefficient when surveying such a large area of the sky. Small areas of Orion have been mapped by previous instruments (e.g., Sánchez et al. 2007; Mesa-Delgado et al. 2011; Weilbacher et al. 2015; McLeod et al. 2016; O’Dell et al. 2017; Fang et al. 2021), but have generally focused on the bright areas of the Huygens region.
As part of SDSS-V (Kollmeier et al. 2017), the LVM Instrument (LVM-I) has been designed as a survey telescope that can achieve a contiguous optical IFU survey of the Milky Way (MW) and Local Group targets (Drory et al. 2024). The instrument is designed to reach sub-pc scales in the MW, and 10 pc scales in the Magellanic Clouds. This effort to map the ionized gas and resolve individual Galactic nebulae has natural close ties to the ongoing efforts from SDSS-IV/APOGEE and SDSS-V/MWM to characterize OB stars in the galaxy (Roman-Lopes et al. 2018, 2020a,b; Borissova et al. 2019; Ramírez-Preciado et al. 2020; Medina et al. 2021; Zari et al. 2021; Román-Zúñiga et al. 2023). LVM will map Orion out to a radius of 6.5 deg (Figure 1), starting from the geometric center of Barnard’s Loop, north of M42 (which contains the Huygens region and is ionized by the Orion Nebula Cluster).
In this paper, we show a first glimpse into Orion, with our early survey tiles covering a 4.3 deg = 30 pc diameter region (assuming a distance of 406 pc; Kounkel et al. 2018) containing iconic Galactic nebular sources associated with the Orion B molecular cloud, such as the Horsehead Nebula and the Flame Nebula, in regions impacted by bright O-type stars including Alnitak (ζ Ori) and σ Ori. We provide an overview of the data in Section 2. We then explore the wealth of science enabled by the LVM in Milky Way star-forming regions by mapping the nebular conditions (Section 3), relating the ionizing sources to the ionized gas (Section 4), and charting the interfaces with dense molecular clouds (Section 5) using early LVM observations of the Orion region. At the end, we conclude in Section 6. Throughout this paper we use the following notation: [O III] to refer to [O III]λ5007, [N II] to refer to [N II]λ6583, [S II] to refer to [S II]λ6717+[S II]λ6731, and [S III] to refer to [S III]λ9531.
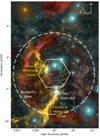 |
Fig. 1 Coverage of Orion. The glimpse into Orion provided by LVM in this work (solid white line) covers a large area in the Orion Constellation, including two of the three belt stars, but does not include M42. The ultimate goal of LVM is to achieve complete coverage (dashed white line) of the extended ionized bubble, with sparser coverage extending out to a radius of 19.5 degrees. Relevant large-scale features and regions are labeled for reference. The optical image is based on astrophotography, courtesy of Rogelio Bernal Andreo. Overplotted in yellow is the dust opacity map derived from Herschel and Planck data (Lombardi et al. 2014). |
2 Data
The LVM-I is a stable, wide field IFU telescope built and operated at Las Campanas Observatory (LCO1) by SDSS-V. It consists of four 16 cm telescopes, each equipped with bundles of fibers 35.3″ diameter in size, which are fed to three DESI spectrographs (R ~ 4000, 3700–9800 Å; Perruchot et al. 2018). The LVM-I was designed to efficiently survey the Milky Way and Local Group galaxies, and a detailed description of the science motivation and technical strategy are given in Drory et al. (2024). The science data is obtained using a single telescope equipped with a 1801 fiber bundle, covering a ~30 arcmin diameter hexagonal field of view. Through the use of a microlens-array, the total fill factor of these fibers is 83%. The three additional telescopes enable simultaneous observation of spectrophotometric stars and sky fields. Data reduction is carried out via a pipeline that extracts and calibrates all spectra to produce wavelength and flux calibrated row-stacked spectra (Drory et al. 2024), removing the instrumental signatures from the data following the prescriptions described in Sánchez (2006). Our sky subtraction algorithm is still under development; it is carried out by modeling and extrapolating the sky from the sky field positions to the science field. However, given our focus in this work on bright lines bluewards of 7000 Å the sky contamination is in most cases negligible. Our procedure of only carrying out Milky Way observations at high shadow height effectively limits the amount of geocoronal Hα emission present in our spectra (Drory et al. 2024).
The final LVM survey of the Orion Nebula will eventually cover a 6.5 deg circular radius area on the sky, beyond which is planned a sparse grid of locations that have a 1/5th filling factor in order to map the Orion-Eridanus super-bubble out to a maximum radius of 19.5°. In this paper, we show results from the first 108 positions observed for the survey (‘tiles’), covering a radius of ~2 deg. These tiles were observed over 17 nights, comprising a total of almost 195 000 spectra. While dithers will be applied to recover emission falling in the gaps between fibers when observing some targets with the LVM (e.g., the Magellanic Clouds), no dithering is planned as part of the Milky Way survey, and so no dithering was performed for this set of observations (Drory et al. 2024). Assuming a distance of 406 pc (Kounkel et al. 2018), the 35.3″ fibers yield spaxel diameters of 0.07 pc and total diameter for the field of view of ~30 pc.
For each spectrum (Figure 2), we assumed a simple linear baseline and fit single Gaussians to a set of bright emission lines ([O II]λ3727, Hβ, [O III]λ5007, Hα, [N II]λ6583, [S II]λλ6717, 6731, [S III]λ9531), to obtain integrated line fluxes and line kinematics. This was sufficient given the low integrated stellar background contribution for a vast majority of the fibers. In addition, we also measured the flux by integrating the spectrum in a 6 Å window centered on each line, subtracting the local continuum. While the resulting values are in very good agreement for these two methods, the maps obtained by simple integration were shallower and less affected by artifacts still present in the current version of the data, which can sometimes lead to imperfect line fits. Therefore, we use the integrated fluxes for all line ratio analysis in this paper, while the fitting results are used when we consider the ionized gas kinematics. We carried out image reconstruction following Shephard’s method (Sánchez et al. 2012), a very simple and robust tessellation-free method to interpolate scattered data. A small number of individual dead fibers and fibers with low throughput were also masked, and interpolated over.
Our Data Analysis Pipeline (currently under development) will handle this more precisely with a strategy designed for Resolved Stellar Populations (RSPs; Drory et al. 2024). As individual bright stars are contained within single 35.3″ LVM fibers, including saturated 2nd and 4th magnitude stars ζ Ori and σ Ori, they are not pronounced within our maps but can be seen as anomalous/masked values. With the LVM-I, we achieve a line-spread-function with σins ≃ 30 km s−1 (R ≃ 4000 at 6563 Å), and for high signal-to-noise regions are able to centroid Hα to within 5 km s−1. However, due to ongoing developments in the data reduction pipeline, we do not yet obtain uniform measurements from pointing to pointing, making it challenging to produce kinematic maps covering the full field of view, and as a result we present only limited results related to the emission line kinematics in this work.
The bulk of our analysis focuses on line ratios close in wavelength, such that reddening due to dust is negligible. When computing line ratios with wide separations ([S III]/[S II]) and extinction corrected Hα fluxes, we used the pyneb tool (Luridiana et al. 2015) to deredden all fluxes based on the observed Hα/Hβ line ratio and assuming case B recombination with Hα/Hβ=2.86. We also assumed RV = 5.5 (Mathis & Wallenhorst 1981; Blagrave et al. 2007), and a Cardelli et al. (1989) extinction law, and qualitatively our results do not change if we instead used RV = 3.1 as is commonly assumed for more diffuse regions (Savage & Mathis 1979). Although we adopted a fixed value for Hα/Hβ, the theoretical value of this ratio is dependent on electron temperature and electron density (Osterbrock & Ferland 2006), and future work with LVM data will explore adapting the case-B line ratio to the local conditions (as measured directly in the LVM data), along with using additional lines from the Balmer and Paschen series. These considerations do not significantly change the conclusions of this paper.
Upon close inspection, artifacts and offsets are apparent (e.g. small vertical stripes in the [N II]/Hα maps, individual fibers with poor stellar continuum corrections in zoomed-in maps), particularly when comparing data between LVM neighboring pointings (e.g., in Hα/Hβ maps). These are mainly due to current limitations in the data reduction and flux calibration, and ongoing work on the data reduction pipeline will improve these issues. As this paper mainly considered line ratios for lines close in wavelength, this has minimal impact on the results presented in this paper. When constructing line ratio maps, we minimized noise by applying a simple mask for all emission fainter than 1×10⁻¹⁷ erg s−1 cm−2 arcsec−2, approximately our 5σ detection limit (Drory et al. 2024).
Figure 3 shows our first glimpse into Orion with the LVM. It combines line emission from Hα (orange), [S II] (blue), and [O III] (magenta), which fill the cavity that has been carved in the surrounding dense gas (traced by WISE 12μm emission in yellow; Meisner & Finkbeiner 2014; Román-Zúñiga et al. 2023). The high ionization [O III] emission highlights individual photoionized bubbles within a sea of wispy, filamentary nebulosity. The iconic Horsehead nebula stands out against the vertical stripe of bright emission associated with the photodisassociation region (PDR) at the interface to the neighboring molecular cloud Orion B (L1630; Lynds 1962). Individual dense cometary globules are also seen dissolving as they are irradiated by the bright ionizing sources in these nebulae. From the Hα morphology we see channels where radiation is able to escape and power the diffuse ionized gas (DIG), and it is clear that our symmetric modeling of H II regions as simple spherical systems is not what is commonly found in nature (Shields 1990; Whitmore et al. 2011).
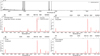 |
Fig. 2 Sample LVM spectra. A full single fiber spectrum (top panel) demonstrates our full wavelength coverage from 3700–9800 Å, with the strongest emission line regions highlighted in grey. The lower panels highlight line emission from these narrow wavelength ranges, where Hβ, [OIII], [NII], Hα, and [SII] line emission is visible. A single fiber one the σOri bow wave (center left, red line) shows no evidence of line broadening or multiple kinematic components, but clear enhanced Balmer and [OIII] emission compared to a neighboring spaxel (black), and an enhanced [OIII]/Hβ line ratio compared to the integrated spectrum from IC 434. An integrated spectrum from IC 432 (bottom left) reveals no strong [OIII] emission but pronounced Balmer emission, consistent with photoionization by a B-type star. The Flame Nebula integrated spectrum (bottom right) shows nearly equal emission in both [SII] lines, indicating high electron densities. |
3 Nebular conditions
This IFU view into Orion provides access to multiple optical emission lines, which are commonly used to diagnose the physical conditions (temperature, density, chemical abundances) of the gas (Pagel et al. 1979; Baldwin et al. 1981; Vilchez & Pagel 1988; Kewley et al. 2019). In this work, we focus on properties inferred from the brightest emission lines, specifically Hβ, [O III]λ5007, Hα, [N II]λ6583, [S II]λλ6717,6731, and [S III]λ9531. All of these are sufficiently removed from atmospheric sky lines and telluric absorption to provide robust flux measurements even with our currently preliminary correction for these factors. Fainter lines, such as auroral and recombination lines used to derive the electron temperature of the ionized gas, are also commonly detected in LVM targets and will be the focus of upcoming work.
As is seen in Figure 3, emission lines from different ions emit brightly in different parts of the nebula (as labeled in Figure 4), tracing the different ionization layers of the gas. In Hα emission (Figure 4, top left), three photoionized nebulae become apparent in relation to the ionizing O and B-type stars (queried from SIMBAD). The large IC 434, centered on the star σ Ori, covers approximately 10 pc by 15 pc across the field of view. The bright Flame Nebula (NGC 2024) is more compact (~3 pc diameter), and marked by a pronounced vertical dust lane and centered on an embedded young stellar cluster (Bik et al. 2003). The smaller (~1 pc diameter) and fainter nebula IC 432 has been reported as a reflection nebula (Magakian 2003) (however see Section 4.2), and is the only compact ionized region centered on a B-type star.
3.1 Mapping the ionization structure
To explore in more detail the structure of these nebulae, we consider combinations of line ratios that diagnose changes in ionization conditions, and are close enough in wavelength that extinction corrections do not need to be applied. The ([S II]λ6717+[S II]λ6731)/Hα (hereafter: [S II]/Hα) and [N II]λ6583/Hα (hereafter: [N II]/Hα) line ratios (Figure 4, top center and top right) are fairly uniform across the Flame Nebula and IC 432, but show increasing values in the outskirts of IC 434. This is indicative of a resolved ionization structure where the central cavity is filled with highly ionized gas, and a low-ionization outer shell that emits brightly in [N II] and [S II]. This radial structure is straightforward to model in one dimension by photoionization codes (e.g., CLOUDY; Ferland et al. 2017), however our two-dimensional view uncovers the elliptical morphology of this bubble. The eastern edge of IC 434 shows high [S II]/Hα and [N II]/Hα line ratios, and coincides with the PDR separating IC 434 from the molecular cloud Orion B (see Section 5). Increased [S II]/Hα and [N II]/Hα structures are commonly found in regions dominated by the Warm Ionized Medium (WIM) in the Milky Way, and may be what we are detecting in the north and south-west edges of the map (Haffner et al. 2009).
The inner, high-ionization zone of IC 434 is detected in [O III], and shows increased [O III]λ5007/Hβ (hereafter: [O III]/Hβ) line ratios towards the center of the nebula (Figure 4, bottom right). The more spherical appearance of [O III]/Hβ, centered on σ Ori, could indicate an increased homogeneity in the physical conditions at the interior of the nebula. High [O III]/Hβ is also detected to each side of the dust-lane in the Flame nebula, where the dust extinction is less severe.
This dust contribution can be directly mapped through two different line diagnostics. Under the assumption that the dust is located in the foreground along the line of sight, then using the Balmer decrement (Hα/Hβ; Figure 4, bottom right), we see high values at the location of the Flame Nebula and to the east, corresponding to the location of the molecular cloud Orion B. Assuming a Cardelli et al. (1989) reddening law and RV = 5.5 this corresponds to AV = 3–5 mag in this region. Using the [S II]λ6717/[S II]λ6731 density diagnostic (Figure 4, bottom center), we also see clear evidence for increased gas density concentrated around the Flame Nebula. Here, low values of [S II]λ6717/[S II]λ6731 indicate high densities, with a value of 1 corresponding to densities of 103 cm−3, and a value larger than 1.4 indicating low densities below 100 cm−3 (Draine 2011). In comparison, IC 434 and IC 432 show lower dust concentrations in both the Balmer decrement and the [S II] density ratio, although distance estimates to the ionizing stars place them inside the Orion Molecular Cloud (Schaefer et al. 2016; Bailer-Jones et al. 2021a), suggesting a lower concentration of dense gas and dust around these sites and less than 1 mag extinction in the V-band.
These 0.1 pc scale tracers of the dust distribution provide a novel counterpart to the recent work mapping the 3D dust distribution in Orion (e.g., Foley et al. 2023). By placing synthetic ionized gas parcels at varying distances and velocities with respect to the existing 3D dust distribution models, it should be possible to compare mock observations with observed LVM line emission and line ratios. Variable levels of extinction should enable us to more precisely locate gas at both near and far distances along a single line of sight, and reconstruct the 3D ionized gas temperature and density structures, with the ultimate goal of refining our multi-phase reconstruction of the entire large-scale Orion region. This reconstruction is quite challenging, with different geometric and kinematic orientations able to produce degenerate solutions, however extensive modeling and the use of many more emission lines beyond those from the Balmer decrement should provide a path towards unifying state of the art 3D dust maps with an understanding of 3D gas structures using the LVM.
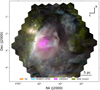 |
Fig. 3 Our glimpse into Orion with LVM. 108 tiles cover 4 deg × 4 deg (30 pc × 30 pc), producing a total of almost 195 000 spectra. Colors show different emission lines (Hα: orange, [S II]6717+6731: light blue, [O III]5007: magenta) trace the ionization structure of the nebula, and carve a bubble into surrounding dense gas (WISE 12 μm: yellow). The ionized gas emission traces wispy, filamentary structures and dusty eroding clouds and clumps. The iconic Horsehead Nebula sits at the bright filamentary ionization front and photo-disassociation region between the central ionized nebula IC 434 and the dark neighboring molecular cloud Orion B to the east, while channels for escaping radiation are apparent in the north. |
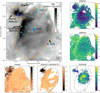 |
Fig. 4 Line emission and line ratios mapped across 20 pc×20 pc of the Orion belt region. Top left: Hα line emission is prominent within IC 434, the flame Nebula, and IC 432. Star symbols mark all individual ionizing O-type (blue) and B-type (cyan) stars, and dashed lines show the approximate boundaries of each nebula. Missing individual pixels are masked fibers with bright stars where our simplistic stellar continuum fitting was insufficient. Top center and right: [S II]/Hα and [N II]/Hα line ratio maps increase at the outskirts of IC 434 and the Flame nebulae. Bottom left: dust extinction via the Balmer decrement increases along the extent of the neighboring Orion B molecular cloud, and peaks at the young embedded Flame Nebula. Bottom center: the increased dust concentration in the Flame Nebula is particularly pronounced in the [S II]λ6717/[S II]λ6731 line ratio, which traces changes in gas density. Bottom right: [O III]/Hβ line ratios can only be mapped in the centers of IC 434 and the Flame Nebula. Higher values towards the center of IC 434 reflect the changing ionizing structure of the nebula, with more highly ionized oxygen found closer to the ionizing source. |
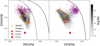 |
Fig. 5 Diagnostic line ratios (left: [O III]/Hβ vs. [N II]/Hα; right: [O III]/Hβ vs. [S II]/Hα) for all pixels with significant detections in all lines. The curves shown from Kewley et al. (2001) (solid) and Kauffmann et al. (2003) (dashed) are commonly used (in integrated and kpc regions) to distinguish photoionized gas from gas ionized by harder ionizing sources. Requiring the detection of [O III] this diagnostic is limited to the areas of the Flame Nebula and the center of NGC 434 (see Figure 4), as well as to regions consistent with photoionization. Integrated results for IC 434 (triangle), IC 432 (square), and the Flame Nebula (circle) are overplotted, as well as integrated measurements from WHAM for single O-star powered Milky Way H II regions (orange) and extragalactic PHANGS H II regions with matched Hα luminosity (purple). Error bars are included, but are typically smaller than the marker size. |
3.2 Comparing the resolved and integrated views
With the LVM, we will build up a sample of hundreds of H II regions where we can explore correlations between resolved and unresolved line ratios, as well as their associations with individual ionizing sources. Combining multiple line ratios into diagnostic diagrams (e.g., BPT diagrams; Baldwin et al. 1981, Veilleux & Osterbrock 1987) can provide insight into the physical conditions of ionized gas, and are a common metric used for distinguishing photoionized gas from gas ionized by harder radiation fields (e.g., active galactic nuclei or shocks) in extragalactic studies. In both the [O III]/Hβ vs. [N II]/Hα diagram (Figure 5, left) and the [O III]/Hβ vs. [S II]/Hα (Figure 5, right), we plot the distribution of pixels in our field. Note that by requiring the detection of [O III] for these diagrams, we limit the coverage to the center of IC 434 and the Flame Nebula (see Figure 4), both of which appear consistent with pure photoionization from O and/or early B-type stars. The small number of points with slightly higher [S II]/Hα correspond to the filamentary bar at the southern end of the full map (Figure 3), which is ~20 pc north of M42 and the Trapezium star cluster, and could reflect changes in the radiation field for gas closer to this very intensive ionizing source.
To guide the eye, we also show the curve from Kewley et al. (2001), based on photoionization models of integrated H II regions, and the curve from Kauffmann et al. (2003), based on empirical kpc scale measurements of galaxies. Physical interpretation of these lines in the context of resolved H II regions is not straightforward (for a more extensive discussion see Sánchez 2020), and in this sub-pc resolved regime should mainly be used for context and to guide the eye. However, these diagrams provide a novel counterpart to models. In a recent study focused on 3D fractal modeling single star H II regions (Jin et al. 2022), the scattering of pixels on these diagrams arose from density variations within the nebula. However, as is also seen in our observations, they still found a correlated curved trend which follows the trend of the Kewley et al. (2001) line, revealing that while density variations may increase scatter in this relation, to first order the underlying ionization parameter and metallicity still determine the line ratios.
Integrating over the entire nebulae (ellipses in Figure 4), we summed all spectra within the boundaries of IC 434, IC 432, and the Flame Nebula (Figure 2) after masking the bright O and B stars (denoted as cyan and blue stars on Figure 4) and then performed Gaussian fits to the resulting strong emission lines. This approach is equivalent to weighting the integrated line flux by the intensity, such that the integrated line ratios do not necessarily follow the peak of the distribution when looking at the resolved maps (red points, Figure 5). The integrated [O III]/Hβ values in IC 434 and the Flame Nebula do match reasonably well with the distribution, as that emission is centrally concentrated and peaks in the brightest regions. However, both [N II]/Hα and [S II]/Hα have somewhat higher values, because most of the bright emission from [N II] and [S II] is located in the outer shell of the nebula. The compact IC 432, photoionized by a B-type star, is an outlier and sits at very low [O III]/Hβ, as is expected given its softer ionizing spectrum.
We compare these regions with extragalactic H II regions drawn from the PHANGS (Physics at High Angular resolution in Nearby GalaxieS) nebular catalog (Groves et al. 2023), selecting only those H II regions that have similar Hα luminosities to what we measure for IC 434 and the Flame Nebula (~1 × 1036 erg s−1). These are some of the faintest regions in the PHANGS catalog, making up less than 2% of the catalog, and as a result these H II regions have a strong selection bias against low [O III]/Hβ values due to S/N limitations on [O III]. Extragalactic H II region searches do not routinely recover these individual O-star H II regions, and in fact at the 100 pc scales achieved by the PHANGS survey, regions such as this would not easily be distinguished from the neighboring bright M42 region.
Integrated Milky Way H II regions were also observed as part of the Wisconsin H-Alpha Mapper (WHAM) survey (Haffner et al. 2003). These regions, associated with individual O-type stars (Madsen et al. 2006), are overplotted in orange, with all line ratios converted from photon flux ratios to energy flux ratios. As WHAM only reports the [S II]λ6717 line, we assume ![Mathematical equation: $\[\left[\mathrm{S}\small{{~\text {II }}}\right] \lambda 6731=\frac{1}{1.45} {\times}\left[\mathrm{S}~\small{{\text {II }}}\right] \lambda 6717\]$](/articles/aa/full_html/2024/09/aa49943-24/aa49943-24-eq1.png) , which is true if the gas is in the low density limit (ne < 100 cm−3). If the density is higher (ne ~ 1000 cm−3), the line intensity ratio could be a factor of ~2 higher (Osterbrock & Ferland 2006). The WHAM Milky Way H II regions generally agree very well with the range of line ratios observed in our data, with all regions sitting at high [O III]/Hβ line ratios associated with very early O-type stars (O4-O6), and hence harder ionizing radiation.
, which is true if the gas is in the low density limit (ne < 100 cm−3). If the density is higher (ne ~ 1000 cm−3), the line intensity ratio could be a factor of ~2 higher (Osterbrock & Ferland 2006). The WHAM Milky Way H II regions generally agree very well with the range of line ratios observed in our data, with all regions sitting at high [O III]/Hβ line ratios associated with very early O-type stars (O4-O6), and hence harder ionizing radiation.
By focusing only on the [S II]/Hα and [N II]/Hα diagnostics, we are not limited by the faint [O III] line and can achieve a more comprehensive view of conditions across our field of view. We observe a general correlation between these two diagnostics (Figure 6), and compare with simple models derived in Madsen et al. (2006) for understanding the ionization sources powering diffuse ionized gas in the Galaxy. These models hold when you can assume that the N+/N is constant (i.e., N++ and N0 are not dominant), which we expect to be the case in most of our map as [O III] is only detected in the center of IC 434 and the Flame Nebula. Madsen et al. (2006) found that the relative variations between [S II]/Hα and [N II]/Hα can be explained by variations in the fraction of singly ionized sulphur (S+/S). In our LVM map we find that values ranging from 20 to 75% are well able to explain our data. We span a fairly narrow range in [N II]/Hα, which in the Madsen et al. (2006) model would correspond to an electron temperature of 6000–8000 K (not included in Figure 6) and consistent with what is expected in Orion (Wilson et al. 2015). Different sub-structures are visible in the distribution, and are associated with different nebular regions. Colorcoding the binned 2D histogram by the median extinction corrected Hα intensity (Figure 6, center), we see the points at high [N II]/Hα and lower [S II]/Hα correspond to the bright Flame Nebula, and are associated with fairly low S+/S as most of the sulfur is likely present as S++. This is consistent with a high abundance of O++ in this young region, as is also mapped directly by the bright [O III] intensity (Figure 3). The central cavity of IC 434 is also apparent in these diagrams, particularly when color-coding the binned 2D histogram by the median extinction corrected [S III]/[S II] line ratio (Figure 6, right). It stands out with high [S III]/[S II], in good agreement with the modeled low S+/S as there is clearly a high fraction of S++ present, and is in contrast to the outer regions of the nebula where higher values of [N II]/Hα, [S II]/Hα, and lower values of [S III]/[S II] are seen. Integrated Milky Way H II regions (IC 434: triangle, IC 432: square, Flame Nebula: circle, WHAM: orange points) exhibit significantly lower S+/S values than extragalactic H II regions with similar Hα luminosity (PHANGS: purple points). This could reflect a systematic bias in these faint extra-galactic regions, as on ~100 pc scales it remains challenging to fully separate DIG emission from H II regions, and could artificially elevate the [S II]/Hα line ratios and hence appear as an overall higher S+/S abundance.
 |
Fig. 6 [S II]/Hα as a function of [N II]/Hα for pixels across the map (left). Considering the line emissivity models of Madsen et al. (2006) (navy lines), we see how line ratios are expected to change as a function of S+/S (dashed). We color-code this 2D histogram distribution by the median extinction corrected Hα intensity (center) and the median extinction corrected [S III]/[S II] line ratio (right). We see that regions predicting lower S+ abundances are well matched to regions with high S++ abundances, as traced by [S III]/[S II]. The Flame Nebula stands out, with high [N II]/Hα but low [S II]/Hα line ratios, and high Hα intensities. Integrated Milky Way H II regions (IC 434: triangle, IC 432: square, Flame Nebula: circle, WHAM: orange points) exhibit low S+/S values as much of the sulfur is ionized to S++. Extragalactic H II regions at matched Hα luminosity (PHANGS: purple points) illustrate the challenges of separating H II regions from the DIG on ~100 pc scales, biasing diagnostic line ratios. |
4 Ionized gas and their ionizing stars
Compared to extragalactic studies, the two-dimensional resolved emission line maps obtained with the LVM provide the unique opportunity to directly link ionized nebulae to the individual stars powering individual bubbles. On the Hα image in Figure 4, we overlay all cataloged O and B-type stars. The three O-type stars present in the field are ζ Ori and σ Ori −wo of the brightest stars in the sky−, plus one heavily embedded O-type star (IRS2b, the fainter companion of IRS2) at the center of the Flame nebula that was only detected with infrared spectroscopy (Bik et al. 2003). IC 432 also has a clear correspondence with a single B-type star. Below, we discuss the relation between stars and gas for each of these objects.
4.1 σ Orionis
Given the ~10 pc diameter of IC 434 and the relatively weak stellar wind (Najarro et al. 2011), it is estimated that σ Ori alone is unable to have driven the bubble we see (Ochsendorf & Tielens 2015). The system is kinematically associated with stars in the spatially and kinematically identified Orion C stellar complex (Kounkel et al. 2018), which contains sub-groups with median ages of 5–7 Myr. This, along with the high proper motions measured for σ Ori (Perryman et al. 1997), have led to the suggestion that σ Ori has moved over its lifetime from the bubble edge into the cavity, where it illuminates IC 434 and continues to approach the eastern Orion B molecular cloud, L1630 (Ochsendorf & Tielens 2015).
This motion through the ionized cavity is evinced by the leading infrared-bright arc visible at ~0.1 pc distance from the star in infrared wavelengths (Caballero 2008). If a star is moving supersonically with respect to the local gas, a wave forms at the location where the wind and ambient ISM interact and sweep up material (van Buren et al. 1990; Mac Low et al. 1991; Henney & Arthur 2019a). Ochsendorf et al. (2014) carried out a detailed study of the infrared emission associated with this wave, modeling the dust grain properties associated with this dust structure and the physics of the wind-ISM interaction, demonstrating how such data can be used to constrain the dust grain size distribution and composition.
We report here corresponding Hα and [O III] features associated with this wave (Figure 7), which exhibits high [O III]/Hα line ratios (Figure 2), and which could not be resolved in existing Hα imaging from the Southern H-Alpha Sky Survey Atlas (SHASSA; Gaustad et al. 2001). We see no corresponding change in the [S II] intensity, or any change in the [S II] density ratio that might suggest the presence of high (>100 cm−3) density gas, at the location of the wave. We also see no evidence for broadened line emission or double-peaked spectral line shapes, typical expansion or outflow signatures (Figure 2). The association of Hα and [O III] emission with this leading wave suggests that what we observe is a bow wave (containing both dust and gas), and not a gas-free dust wave, information that can be used for modeling the wind strength from this star (Henney & Arthur 2019b). The optical bow wave is in good agreement with the direction of motion of the star, as indicated by the white arrow.
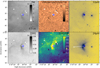 |
Fig. 7 σ Orionis (blue star), the central ionizing source of IC 434, and its bow wave. The star system consists of a close binary of spectral type O9.5V and B0.5V with a third massive companion (Simón-Díaz et al. 2011), and is moving eastward through the nebula in agreement with the arc direction (white arrow, representing 0.1 Myr of travel time; Perryman et al. 1997). Apparent in imaging in Hα (top left), [O III] (bottom left), WISE 12 μm (top right), and Herschel MIPS 24 μm (bottom right), we see the wind and radiation pressure interacting with the surrounding ISM (Ochsendorf et al. 2014). We further report increased [O III]/Hβ emission (bottom center) but no increase in the gas density as traced by the [S II] line ratio (top center). |
4.2 IC 432
Classified in Magakian (2003) and SIMBAD as a reflection nebula, where light from a nearby star is reflected by dust grains, we observe that IC 432 also exhibits strong, extended (~1 pc diameter) line emission (Figure 8). This emission is slightly offset from the blue reflected light, and is well centered on HD 37776 (V901 Ori). This star is classified as a magnetic chemically peculiar (helium-strong) star of spectral type B2V (Thompson & Landstreet 1985; Mikulášek et al. 2008; Kochukhov et al. 2011). It is the only B-type star in our field that is clearly associated with its own ionized nebula, perhaps due to its proximity to the nearby dense Orion B molecular cloud L1630. However it appears to be distinct from the dense cloud, as is apparent by its relatively low optical extinction in the Balmer decrement maps (Figure 8, bottom left), and exhibits significantly lower density as judged by the [S II] density diagnostic (Figure 4, bottom center). In BPT diagnostics (Figure 5), its line ratios appear consistent with photoionization and lie close to the O star dominated nebulae IC 434 and Flame Nebula.
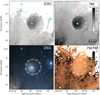 |
Fig. 8 Line emission and optical images of IC 432. Cataloged as a reflection nebula, is revealed to also exhibit extended line emission in multiple lines, including [O II] and Hα (top row). The bright, blue reflection nebula is also seen to the east in optical Digitized Sky Surveys (DSS) red and blue imaging (bottom left), however, there is relatively low extinction inferred via the Balmer decrement (Hα/Hβ, bottom right). The central star, HD 37776 (cyan), is a magnetic chemically peculiar (helium-strong) star of spectral type B2V (Thompson & Landstreet 1985). |
4.3 Flame Nebula (NGC 2024)
The Flame Nebula hosts the youngest population of young stellar objects (YSOs) in the Orion cloud (Meyer 1996; Levine et al. 2006), and is heavily embedded (AV ~ 30 mag; Lenorzer et al. 2004). van Terwisga et al. (2020) identified two young populations embedded within the nebula by characterizing their protoplanetary disk systems, finding an eastern population with ages of ~0.5 Myr and a western population with ages 1 Myr (see also Stutz et al. 2013). The central ionizing source, associated with the infrared source IRS2b (the fainter component of the famous IRS2), has been classified with K band spectroscopy as having a spectral type O8 V (Bik et al. 2003; Kandori et al. 2007). It is also seen in scattered light in a less extincted part of the nebula (Burgh et al. 2012). From our maps of the dust reddening and [S II] density diagnostic (Figure 4), it is clear that this region is the most heavily embedded. With a relatively smooth [S II]λ6717/[S II]λ6731 line ratio of ~1.0 this corresponds to gas densities of almost 1000 cm−3 (Osterbrock & Ferland 2006), and supports the assumption that this is a ionization-bounded nebula (Bik et al. 2003).
4.4 Alnitak (ζ Orionis)
The third known O-type star in our field is Alnitak, a belt star associated with the 2nd magnitude ζ Orionis system. This is composed of a close binary containing an O supergiant star and a B-type star (spectral types O9.5 Iab and B0.5 IV), and a wide B-type companion (Hummel et al. 2013). ζ Ori is an interesting case as it has no obvious ionized gas associated with it. Located (in projection) between the Flame Nebula and IC 434, it also has a wide range of distances reported in the literature. From Hipparcos a parallax distance of ![Mathematical equation: $\[225_{-27}^{+38}\]$](/articles/aa/full_html/2024/09/aa49943-24/aa49943-24-eq2.png) pc was reported (van Leeuwen 2007), placing it over 100 pc closer to us than the Orion C group (Kounkel et al. 2018). Too bright for Gaia, Hummel et al. (2013) used spectroscopy of the lower mass stars in the triple system to infer a photometric distance of 387 ± 54 pc. Given its radial velocity information, this places the star in good agreement with the Orion D group (Kounkel et al. 2018), which exhibits generally older ages ~5 Myr. Hummel et al. (2013) also find an age of 7 Myr for the lower mass component of the system, so it is possible this star has already dispersed or migrated away from its natal cloud. Given the projected separation from the Orion B molecular cloud, it seems likely that ionizing radiation from this source is able to propagate widely into the surrounding region and contribute more broadly to the diffuse ionized emission observed in the map. δ Ori, another O type star associated with the Orion D complex and located ~5 pc north of our map, has also been noted as having no clear H II region associated (Reynolds & Ogden 1979).
pc was reported (van Leeuwen 2007), placing it over 100 pc closer to us than the Orion C group (Kounkel et al. 2018). Too bright for Gaia, Hummel et al. (2013) used spectroscopy of the lower mass stars in the triple system to infer a photometric distance of 387 ± 54 pc. Given its radial velocity information, this places the star in good agreement with the Orion D group (Kounkel et al. 2018), which exhibits generally older ages ~5 Myr. Hummel et al. (2013) also find an age of 7 Myr for the lower mass component of the system, so it is possible this star has already dispersed or migrated away from its natal cloud. Given the projected separation from the Orion B molecular cloud, it seems likely that ionizing radiation from this source is able to propagate widely into the surrounding region and contribute more broadly to the diffuse ionized emission observed in the map. δ Ori, another O type star associated with the Orion D complex and located ~5 pc north of our map, has also been noted as having no clear H II region associated (Reynolds & Ogden 1979).
5 Interfaces with dense clouds
These prominent ionized nebulae are adjacent to the Orion B molecular cloud (L1630), which is located directly to the east of IC 434. At the interface between the H II region and the dense molecular cloud, the UV radiation from the young massive stars sustaining the ionized nebulae impinge upon the molecular gas (Hollenbach & Tielens 1999). This marks boundaries between ionized, atomic, and molecular gas phases, resulting in a pronounced ionization front and PDR. While this ionization front is seen prominently as a linear filament, bright in [S II]/Hα and [N II]/Hα (Figure 4), that extends from north to south at the eastern boundary of IC 434, pillars and other features reflecting individual inhomogeneities in the original dense material are also apparent.
The Horsehead nebula (Barnard 33) represents one of the best known examples of these pillar-type aggregations, and has been extensively studied in this context of understanding how stellar feedback impacts the physics of molecular gas and dust in these transition regions (Pety et al. 2005; Habart et al. 2005), and the general role of UV photons in setting the chemistry and temperature structures in the ISM.
In Figure 9 we show how sharply the Hα emission traces the edge of the ionization front, with the Horsehead itself appearing as a low intensity inclusion into the IC 434 nebula. The contours delineated by our Hα map match with high precision the sharp edges visible in the WISE 12μm PAH sensitive bands, along with the atomic and ionized gas at the surface of the PDR traced by [C II] 158 μm emission (Pabst et al. 2017) and the dense molecular gas that remains embedded in 12CO(1–0) imaging (Pety et al. 2017). The Horsehead is seen in projection against the ionization front, which is marked by a strong increase in [S II]/Hα and [N II]/Hα line ratios, that sit nearer to the western ionizing source than the PAH-rich PDR and subsequent remaining dense molecular material. While a less striking example of this geometry than the better-studied Orion Bar, this region experiences a more modest UV radiation field that may be more representative of Galactic and extragalactic star-forming regions (Hernández-Vera et al. 2023).
The edge of the molecular cloud also marks the location of a photo-evaporative flow (Henney et al. 2005), where the radiation from σ Ori ionizes material at the edge of the cloud, which can then accelerate and flow into the low-density bubble via a champagne flow (Tenorio-Tagle 1979). This is seen in the wispy Hα streaks oriented perpendicular to the PDR at the plane parallel surface near the Horsehead Nebula (Figure 9, top left). As these motions, seen in projection, are largely in the plane of the sky we do not see any clear kinematic evidence for this flow in our Hα line kinematics within our instrumental limits of 5 km s−1 (in projection).
A final set of objects visible in our ionized gas map are individual cold clumps and cometary globules (Planck Collaboration XXVIII 2016; Könyves et al. 2020). A few are prominently seen at the edges of IC 434 (Figure 3), with tails approximately oriented radially away from the central ionizing star σ Ori. These structures resemble comet-like formations similar to the photo-evaporating protoplanetary discs (proplyds) observed in various ionized nebulae (O’Dell et al. 1993; Mesa-Delgado et al. 2016; Méndez-Delgado et al. 2022). We zoom in onto one of those objects, Ori I-2 (Mookerjea & Sandell 2009), just to demonstrate variations in optical emission line properties that can be seen in some of these objects (Figure 10). Line ratios show systematically lower values, and tentative kinematic differences are also seen in Hα emission tracing the ~4 pc long tail, with ~10 km s−1 lower velocities compared to the surrounding gas. This source has been proposed as an example of triggered star formation, and the tail is clearly associated with an overdensity of B-type stars, and additional YSOs are identified in the dense globule (Alcalá et al. 2008).
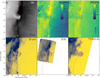 |
Fig. 9 Comparing ionized gas with dense gas and dust in the Horsehead Nebula. In Hα (top left), we see the filamentary photo-evaporation flow that streams out from the PDR towards the west. The Horsehead sits in projection against the vertically oriented PDR, where we see increased [S II]/Hα and [N II]/Hα (top center and left) in the ionization front. Hα contours (red) mirror the dust features unveiled in PAH-rich WISE 12 μm imaging (bottom left), atomic/ionized gas highlighted by [C II] imaging (bottom center, Pabst et al. 2017) and molecular gas seen in 12CO(1–0) (bottom right; Pety et al. 2017). |
6 Conclusions and outlook
The Local Volume Mapper (LVM) has begun survey operations, providing a first glimpse at the rich variety of science that will be possible by providing optical spectroscopic maps across well-studied Milky Way H II regions. By providing multiple line diagnostics, it is possible to characterize the physical conditions in the gas and relate these gas-phase diagnostics to the stellar parameters of individual ionizing sources and the surrounding dense molecular gas. This paper shows first results for a 30 pc diameter region in Orion (2 deg radius), centered on three ionized nebulae (the Flame Nebula, IC 434, and IC 432). This represents ~12% of the planned contiguous coverage across the nebula (Figure 1), based on a data reduction pipeline that is under active development and continually improving. Our conclusions can be summarized as follows:
The Hα morphology is complementary to archival multi-wavelength data, showing channels that are sculpted by ionizing photons, allowing radiation to escape into the surrounding diffuse medium.
Maps combining different line ratios are able to directly show the ionization structure of the nebulae. These can be used to infer changes in gas density and the degree of ionization. In diagnostic BPT diagrams, they can be used to track the balance of photoionization, photo-disassociation, and shocks in the ISM.
Building from the resolved to an integrated view of these nebulae, we are providing tools to connect with extragalactic studies of star-forming regions.
We highlight the potential for exciting synergies, combining ionized gas diagnostics with individual stars. Notably, in the case of IC 432, we can directly show that in addition to a reflection nebula, there is also photoionized emission associated with the central B2 spectral type star.
Multi-wavelength views link dust and dense gas with our new LVM perspectives on the ionized ISM, charting the physical conditions at the interfaces with molecular clouds.
These ~100 LVM pointings represent less than 1% of what LVM will achieve in its survey of the Milky Way, and only one of the hundreds of H II regions that the LVM will map at sub-pc resolution, providing an inspiring view towards the rich panoptic science goals of SDSS-V.
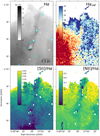 |
Fig. 10 Ori I-2, a cometary globule to the north of IC 434. Hα emission (top left) traces out a ~4 pc long tail, which also exhibits lower line ratios in [S II]/Hα (bottom left) and [N II]/Hα (bottom right). Tentative kinematic differences are also seen in Hα emission tracing the tail (top right). An overdensity of B stars (cyan) is also associated with the cometary tail. Note that the vertical stripe in the [N II]/Hα at the center of the tail is a data artifact. |
Acknowledgements
We thank the referee for their careful reading of this work and thoughtful suggestions. Funding for the Sloan Digital Sky Survey V has been provided by the Alfred P. Sloan Foundation, the Heising-Simons Foundation, the National Science Foundation, and the Participating Institutions. SDSS acknowledges support and resources from the Center for High-Performance Computing at the University of Utah. SDSS telescopes are located at Apache Point Observatory, funded by the Astrophysical Research Consortium and operated by New Mexico State University, and at Las Campanas Observatory, operated by the Carnegie Institution for Science. The SDSS web site is www.sdss.org. SDSS is managed by the Astrophysical Research Consortium for the Participating Institutions of the SDSS Collaboration, including Caltech, The Carnegie Institution for Science, Chilean National Time Allocation Committee (CNTAC) ratified researchers, The Flatiron Institute, the Gotham Participation Group, Harvard University, Heidelberg University, The Johns Hopkins University, L’Ecole polytechnique fédérale de Lausanne (EPFL), Leibniz-Institut für Astrophysik Potsdam (AIP), Max-Planck-Institut für Astronomie (MPIA Heidelberg), Max-Planck-Institut für Extraterrestrische Physik (MPE), Nanjing University, National Astronomical Observatories of China (NAOC), New Mexico State University, The Ohio State University, Pennsylvania State University, Smithsonian Astrophysical Observatory, Space Telescope Science Institute (STScI), the Stellar Astrophysics Participation Group, Universidad Nacional Autónoma de México, University of Arizona, University of Colorado Boulder, University of Illinois at Urbana-Champaign, University of Toronto, University of Utah, University of Virginia, Yale University, and Yunnan University. K.K., O.E., E.E., J.E.M.D., J.L., and N.S. gratefully acknowledge funding from the Deutsche Forschungsgemeinschaft (DFG, German Research Foundation) in the form of an Emmy Noether Research Group (grant number KR4598/2-1, PI: Kreckel) and the European Research Council’s starting grant ERC StG-101077573 (“ISM-METALS”). J.G.F-T gratefully acknowledges the grants support provided by Proyecto Fondecyt Iniciación No. 11220340, Proyecto Fondecyt Postdoc No. 3230001 (Sponsoring researcher), from the Joint Committee ESO-Government of Chile under the agreement 2021 ORP 023/2021 and 2023 ORP 062/2023. C.R-Z. acknowledges support from project UNAM-PAPIIT IG101723 G.A.B. acknowledges the support from the ANID Basal project FB210003. AS gratefully acknowledges support by the Fondecyt Regular (project code 1220610), and ANID BASAL project FB210003. This research has made use of the SIMBAD database, operated at CDS, Strasbourg, France (Wenger et al. 2000). Multicolor images generated using the PYTHON package MULTICOLORFITS (Cigan 2019). This publication makes use of data products from the Wide-field Infrared Survey Explorer, which is a joint project of the University of California, Los Angeles, and the Jet Propulsion Laboratory/California Institute of Technology, funded by the National Aeronautics and Space Administration. Based in part on observations made with the NASA/DLR Stratospheric Observatory for Infrared Astronomy (SOFIA). The Digitized Sky Surveys were produced at the Space Telescope Science Institute under U.S. Government grant NAG W-2166. The images of these surveys are based on photographic data obtained using the Oschin Schmidt Telescope on Palomar Mountain and the UK Schmidt Telescope. The plates were processed into the present compressed digital form with the permission of these institutions.
References
- Alcalá, J. M., Covino, E., & Leccia, S. 2008, ASP Conf. Ser., 4, 801 [Google Scholar]
- Bailer-Jones, C. A. L., Rybizki, J., Fouesneau, M., Demleitner, M., & Andrae, R. 2021a, AJ, 161, 147 [Google Scholar]
- Baldwin, J. A., Phillips, M. M., & Terlevich, R. 1981, PASP, 93, 5 [Google Scholar]
- Baldwin, J. A., Ferland, G. J., Martin, P. G., et al. 1991, ApJ, 374, 580 [Google Scholar]
- Bally, J. 2008, ASP Conf. Ser., 4, 459 [Google Scholar]
- Barnard, E. E. 1894, Popular Astron., 2, 151 [Google Scholar]
- Becklin, E. E., & Neugebauer, G. 1967, ApJ, 147, 799 [NASA ADS] [CrossRef] [Google Scholar]
- Bik, A., Lenorzer, A., Kaper, L., et al. 2003, A&A, 404, 249 [NASA ADS] [CrossRef] [EDP Sciences] [Google Scholar]
- Binder, B. A., & Povich, M. S. 2018, ApJ, 864, 136 [CrossRef] [Google Scholar]
- Blagrave, K. P. M., Martin, P. G., Rubin, R. H., et al. 2007, ApJ, 655, 299 [NASA ADS] [CrossRef] [Google Scholar]
- Borissova, J., Roman-Lopes, A., Covey, K., et al. 2019, AJ, 158, 46 [Google Scholar]
- Bouy, H., & Alves, J. 2015, A&A, 584, A26 [NASA ADS] [CrossRef] [EDP Sciences] [Google Scholar]
- Briceño, C., Calvet, N., Hernández, J., et al. 2019, AJ, 157, 85 [CrossRef] [Google Scholar]
- Burgh, E. B., France, K., & Snow, T. P. 2012, ApJ, 756, L6 [NASA ADS] [CrossRef] [Google Scholar]
- Caballero, J. A. 2008, MNRAS, 383, 750 [Google Scholar]
- Cardelli, J. A., Clayton, G. C., & Mathis, J. S. 1989, ApJ, 345, 245 [Google Scholar]
- Cigan, P. 2019, Astrophysics Source Code Library [record ascl:1909.002] [Google Scholar]
- Cottle, J. N., Covey, K. R., Suárez, G., et al. 2018, ApJS, 236, 27 [NASA ADS] [CrossRef] [Google Scholar]
- Draine, B. T. 2011, Physics of the Interstellar and Intergalactic Medium (Princeton: Princeton University Press) [Google Scholar]
- Drory, N., Blanc, G. A., Kreckel, K., et al. 2024, arXiv e-prints [arXiv:2405.01637] [Google Scholar]
- Edenhofer, G., Zucker, C., Frank, P., et al. 2024, A&A, 685, A82 [NASA ADS] [CrossRef] [EDP Sciences] [Google Scholar]
- Esteban, C., Peimbert, M., García-Rojas, J., et al. 2004, MNRAS, 355, 229 [NASA ADS] [CrossRef] [Google Scholar]
- Fang, M., Kim, J. S., Pascucci, I., et al. 2017, AJ, 153, 188 [NASA ADS] [CrossRef] [Google Scholar]
- Fang, M., Kim, J. S., Pascucci, I., & Apai, D. 2021, ApJ, 908, 49 [NASA ADS] [CrossRef] [Google Scholar]
- Ferland, G. J., Chatzikos, M., Guzmán, F., et al. 2017, Rev. Mexicana Astron. Astrofis., 53, 385 [Google Scholar]
- Foley, M. M., Goodman, A., Zucker, C., et al. 2023, ApJ, 947, 66 [NASA ADS] [CrossRef] [Google Scholar]
- Furlan, E., Fischer, W. J., Ali, B., et al. 2016, ApJS, 224, 5 [Google Scholar]
- Gaustad, J. E., McCullough, P. R., Rosing, W., & Van Buren, D. 2001, PASP, 113, 1326 [NASA ADS] [CrossRef] [Google Scholar]
- Genzel, R., & Stutzki, J. 1989, ARA&A, 27, 41 [NASA ADS] [CrossRef] [Google Scholar]
- Großschedl, J. E., Alves, J., Teixeira, P. S., et al. 2019, A&A, 622, A149 [NASA ADS] [CrossRef] [EDP Sciences] [Google Scholar]
- Groves, B., Kreckel, K., Santoro, F., et al. 2023, MNRAS, 520, 4902 [Google Scholar]
- Habart, E., Abergel, A., Walmsley, C. M., Teyssier, D., & Pety, J. 2005, A&A, 437, 177 [NASA ADS] [CrossRef] [EDP Sciences] [Google Scholar]
- Haffner, L. M., Reynolds, R. J., & Tufte, S. L. 1999, ApJ, 523, 223 [CrossRef] [Google Scholar]
- Haffner, L. M., Reynolds, R. J., Tufte, S. L., et al. 2003, ApJS, 149, 405 [NASA ADS] [CrossRef] [Google Scholar]
- Haffner, L. M., Dettmar, R.-J., Beckman, J. E., et al. 2009, Rev. Mod. Phys., 81, 969 [CrossRef] [Google Scholar]
- Henney, W. J., & Arthur, S. J. 2019a, MNRAS, 486, 3423 [NASA ADS] [CrossRef] [Google Scholar]
- Henney, W. J., & Arthur, S. J. 2019b, MNRAS, 489, 2142 [NASA ADS] [CrossRef] [Google Scholar]
- Henney, W. J., Arthur, S. J., & García-Díaz, M. T. 2005, ApJ, 627, 813 [NASA ADS] [CrossRef] [Google Scholar]
- Hernández, J., Calvet, N., Perez, A., et al. 2014, ApJ, 794, 36 [CrossRef] [Google Scholar]
- Hernández-Vera, C., Guzmán, V. V., Goicoechea, J. R., et al. 2023, A&A, 677, A152 [NASA ADS] [CrossRef] [EDP Sciences] [Google Scholar]
- Hollenbach, D. J., & Tielens, A. G. G. M. 1999, Rev. Mod. Phys., 71, 173 [Google Scholar]
- Hummel, C. A., Rivinius, T., Nieva, M. F., et al. 2013, A&A, 554, A52 [NASA ADS] [CrossRef] [EDP Sciences] [Google Scholar]
- Huygens, C. 1659, Systema Saturnium sive de causis mirandorum Saturni phaenomenon et comite ejus planeta novo [Google Scholar]
- Jin, Y., Kewley, L. J., & Sutherland, R. S. 2022, ApJ, 934, L8 [NASA ADS] [CrossRef] [Google Scholar]
- Jönsson, H., Holtzman, J. A., Allende Prieto, C., et al. 2020, AJ, 160, 120 [Google Scholar]
- Kandori, R., Tamura, M., Kusakabe, N., et al. 2007, PASJ, 59, 487 [NASA ADS] [Google Scholar]
- Kauffmann, G., Heckman, T. M., Tremonti, C., et al. 2003, MNRAS, 346, 1055 [Google Scholar]
- Kewley, L. J., Heisler, C. A., Dopita, M. A., & Lumsden, S. 2001, ApJS, 132, 37 [Google Scholar]
- Kewley, L. J., Nicholls, D. C., & Sutherland, R. S. 2019, ARA&A, 57, 511 [Google Scholar]
- Kochukhov, O., Lundin, A., Romanyuk, I., & Kudryavtsev, D. 2011, ApJ, 726, 24 [NASA ADS] [CrossRef] [Google Scholar]
- Kollmeier, J. A., Zasowski, G., Rix, H.-W., et al. 2017, arXiv e-prints [arXiv:1711.03234] [Google Scholar]
- Kong, S., Arce, H. G., Feddersen, J. R., et al. 2018, ApJS, 236, 25 [NASA ADS] [CrossRef] [Google Scholar]
- Könyves, V., André, P., Arzoumanian, D., et al. 2020, A&A, 635, A34 [Google Scholar]
- Kounkel, M., Covey, K., Suárez, G., et al. 2018, AJ, 156, 84 [NASA ADS] [CrossRef] [Google Scholar]
- Leike, R. H., Glatzle, M., & Enßlin, T. A. 2020, A&A, 639, A138 [NASA ADS] [CrossRef] [EDP Sciences] [Google Scholar]
- Lenorzer, A., Bik, A., de Koter, A., et al. 2004, A&A, 414, 245 [NASA ADS] [CrossRef] [EDP Sciences] [Google Scholar]
- Levine, J. L., Steinhauer, A., Elston, R. J., & Lada, E. A. 2006, ApJ, 646, 1215 [NASA ADS] [CrossRef] [Google Scholar]
- Lombardi, M., Alves, J., & Lada, C. J. 2011, A&A, 535, A16 [NASA ADS] [CrossRef] [EDP Sciences] [Google Scholar]
- Lombardi, M., Bouy, H., Alves, J., & Lada, C. J. 2014, A&A, 566, A45 [NASA ADS] [CrossRef] [EDP Sciences] [Google Scholar]
- Luridiana, V., Morisset, C., & Shaw, R. A. 2015, A&A, 573, A42 [NASA ADS] [CrossRef] [EDP Sciences] [Google Scholar]
- Lynds, B. T. 1962, ApJS, 7, 1 [NASA ADS] [CrossRef] [Google Scholar]
- Mac Low, M.-M., van Buren, D., Wood, D. O. S., & Churchwell, E. 1991, ApJ, 369, 395 [NASA ADS] [CrossRef] [Google Scholar]
- Madsen, G. J., Reynolds, R. J., & Haffner, L. M. 2006, ApJ, 652, 401 [CrossRef] [Google Scholar]
- Magakian, T. Y. 2003, A&A, 399, 141 [NASA ADS] [CrossRef] [EDP Sciences] [Google Scholar]
- Majewski, S. R., Schiavon, R. P., Frinchaboy, P. M., et al. 2017, AJ, 154, 94 [NASA ADS] [CrossRef] [Google Scholar]
- Mathis, J. S., & Wallenhorst, S. G. 1981, ApJ, 244, 483 [NASA ADS] [CrossRef] [Google Scholar]
- McLeod, A. F., Weilbacher, P. M., Ginsburg, A., et al. 2016, MNRAS, 455, 4057 [CrossRef] [Google Scholar]
- Medina, N., Borissova, J., Kurtev, R., et al. 2021, ApJ, 914, 28 [NASA ADS] [CrossRef] [Google Scholar]
- Megeath, S. T., Gutermuth, R., Muzerolle, J., et al. 2012, AJ, 144, 192 [NASA ADS] [CrossRef] [Google Scholar]
- Megeath, S. T., Gutermuth, R., Muzerolle, J., et al. 2016, AJ, 151, 5 [Google Scholar]
- Meingast, S., Alves, J., Mardones, D., et al. 2016, A&A, 587, A153 [NASA ADS] [CrossRef] [EDP Sciences] [Google Scholar]
- Meisner, A. M., & Finkbeiner, D. P. 2014, ApJ, 781, 5 [Google Scholar]
- Méndez-Delgado, J. E., Henney, W. J., Esteban, C., et al. 2021, ApJ, 918, 27 [CrossRef] [Google Scholar]
- Méndez-Delgado, J. E., Esteban, C., García-Rojas, J., & Henney, W. J. 2022, MNRAS, 514, 744 [CrossRef] [Google Scholar]
- Menten, K. M., Reid, M. J., Forbrich, J., & Brunthaler, A. 2007, A&A, 474, 515 [NASA ADS] [CrossRef] [EDP Sciences] [Google Scholar]
- Mesa-Delgado, A., Núñez-Díaz, M., Esteban, C., López-Martín, L., & García-Rojas, J. 2011, MNRAS, 417, 420 [NASA ADS] [CrossRef] [Google Scholar]
- Mesa-Delgado, A., Zapata, L., Henney, W. J., Puzia, T. H., & Tsamis, Y. G. 2016, ApJ, 825, L16 [NASA ADS] [CrossRef] [Google Scholar]
- Meyer, M. R. 1996, PhD thesis, Max-Planck-Institute for Astronomy, Heidelberg, Germany [Google Scholar]
- Mikulášek, Z., Krtička, J., Henry, G. W., et al. 2008, A&A, 485, 585 [NASA ADS] [CrossRef] [EDP Sciences] [Google Scholar]
- Mookerjea, B., & Sandell, G. 2009, ApJ, 706, 896 [NASA ADS] [CrossRef] [Google Scholar]
- Najarro, F., Hanson, M. M., & Puls, J. 2011, A&A, 535, A32 [NASA ADS] [CrossRef] [EDP Sciences] [Google Scholar]
- Ochsendorf, B. B., Cox, N. L. J., Krijt, S., et al. 2014, A&A, 563, A65 [NASA ADS] [CrossRef] [EDP Sciences] [Google Scholar]
- Ochsendorf, B. B., & Tielens, A. G. G. M. 2015, A&A, 576, A2 [NASA ADS] [CrossRef] [EDP Sciences] [Google Scholar]
- O’Dell, C. R., & Hubbard, W. B. 1965, ApJ, 142, 591 [CrossRef] [Google Scholar]
- O’Dell, C. R., Wen, Z., & Hu, X. 1993, ApJ, 410, 696 [CrossRef] [Google Scholar]
- O’Dell, C. R., Peimbert, M., & Peimbert, A. 2003, AJ, 125, 2590 [CrossRef] [Google Scholar]
- O’Dell, C. R., Ferland, G. J., Porter, R. L., & van Hoof, P. A. M. 2011, ApJ, 733, 9 [Google Scholar]
- O’Dell, C. R., Ferland, G. J., & Peimbert, M. 2017, MNRAS, 464, 4835 [CrossRef] [Google Scholar]
- O’Dell, C. R., Ferland, G. J., & Méndez-Delgado, J. E. 2023, AJ, 165, 21 [CrossRef] [Google Scholar]
- Osterbrock, D. E., & Ferland, G. J. 2006, Astrophysics of Gaseous Nebulae and Active Galactic Nuclei (USA: University Science Books) [Google Scholar]
- Pabst, C. H. M., Goicoechea, J. R., Teyssier, D., et al. 2017, A&A, 606, A29 [NASA ADS] [CrossRef] [EDP Sciences] [Google Scholar]
- Pagel, B. E. J., Edmunds, M. G., Blackwell, D. E., Chun, M. S., & Smith, G. 1979, MNRAS, 189, 95 [NASA ADS] [CrossRef] [Google Scholar]
- Peimbert, M., & Torres-Peimbert, S. 1977, MNRAS, 179, 217 [NASA ADS] [Google Scholar]
- Perruchot, S., Guy, J., Le Guillou, L., et al. 2018, SPIE Conf. Ser., 10702, 107027K [NASA ADS] [Google Scholar]
- Perryman, M. A. C., Lindegren, L., Kovalevsky, J., et al. 1997, A&A, 323, L49 [Google Scholar]
- Pety, J., Teyssier, D., Fossé, D., et al. 2005, A&A, 435, 885 [NASA ADS] [CrossRef] [EDP Sciences] [Google Scholar]
- Pety, J., Guzmán, V. V., Orkisz, J. H., et al. 2017, A&A, 599, A98 [NASA ADS] [CrossRef] [EDP Sciences] [Google Scholar]
- Planck Collaboration XXVIII. 2016, A&A, 594, A28 [NASA ADS] [CrossRef] [EDP Sciences] [Google Scholar]
- Ramírez-Preciado, V. G., Roman-Lopes, A., Román-Zúñiga, C. G., et al. 2020, ApJ, 894, 5 [Google Scholar]
- Reynolds, R. J., & Ogden, P. M. 1979, ApJ, 229, 942 [NASA ADS] [CrossRef] [Google Scholar]
- Robberto, M., Soderblom, D. R., Bergeron, E., et al. 2013, ApJS, 207, 10 [NASA ADS] [CrossRef] [Google Scholar]
- Robberto, M., Gennaro, M., Ubeira Gabellini, M. G., et al. 2020, ApJ, 896, 79 [NASA ADS] [CrossRef] [Google Scholar]
- Roman-Lopes, A., Román-Zúñiga, C., Tapia, M., et al. 2018, ApJ, 855, 68 [NASA ADS] [CrossRef] [Google Scholar]
- Roman-Lopes, A., Román-Zúñiga, C. G., Borissova, J., et al. 2020a, ApJ, 891, 107 [NASA ADS] [CrossRef] [Google Scholar]
- Roman-Lopes, A., Román-Zúñiga, C. G., Tapia, M., Minniti, D., & Borissova, J. 2020b, ApJS, 247, 17 [NASA ADS] [CrossRef] [Google Scholar]
- Román-Zúñiga, C. G., Kounkel, M., Hernández, J., et al. 2023, AJ, 165, 51 [CrossRef] [Google Scholar]
- Sánchez, S. F. 2006, Astron. Nachr., 327, 850 [CrossRef] [Google Scholar]
- Sánchez, S. F. 2020, ARA&A, 58, 99 [Google Scholar]
- Sánchez, S. F., Cardiel, N., Verheijen, M. A. W., et al. 2007, A&A, 465, 207 [NASA ADS] [CrossRef] [EDP Sciences] [Google Scholar]
- Sánchez, S. F., Kennicutt, R. C., Gil de Paz, A., et al. 2012, A&A, 538, A8 [Google Scholar]
- Savage, B. D., & Mathis, J. S. 1979, ARA&A, 17, 73 [NASA ADS] [CrossRef] [Google Scholar]
- Schaefer, G. H., Hummel, C. A., Gies, D. R., et al. 2016, AJ, 152, 213 [NASA ADS] [CrossRef] [Google Scholar]
- Schlafly, E. F., Green, G., Finkbeiner, D. P., et al. 2015, ApJ, 799, 116 [NASA ADS] [CrossRef] [Google Scholar]
- Sharpless, S. 1952, ApJ, 116, 251 [NASA ADS] [CrossRef] [Google Scholar]
- Shields, G. A. 1990, ARA&A, 28, 525 [NASA ADS] [CrossRef] [Google Scholar]
- Simón-Díaz, S., Herrero, A., Esteban, C., & Najarro, F. 2006, A&A, 448, 351 [NASA ADS] [CrossRef] [EDP Sciences] [Google Scholar]
- Simón-Díaz, S., Caballero, J. A., & Lorenzo, J. 2011, ApJ, 742, 55 [CrossRef] [Google Scholar]
- Stanke, T., Arce, H. G., Bally, J., et al. 2022, A&A, 658, A178 [NASA ADS] [CrossRef] [EDP Sciences] [Google Scholar]
- Stutz, A. M., & Gould, A. 2016, A&A, 590, A2 [NASA ADS] [CrossRef] [EDP Sciences] [Google Scholar]
- Stutz, A. M., Tobin, J. J., Stanke, T., et al. 2013, ApJ, 767, 36 [Google Scholar]
- Tenorio-Tagle, G. 1979, A&A, 71, 59 [NASA ADS] [Google Scholar]
- Thompson, I. B., & Landstreet, J. D. 1985, ApJ, 289, L9 [NASA ADS] [CrossRef] [Google Scholar]
- Tielens, A. G. G. M., & Hollenbach, D. 1985, ApJ, 291, 747 [NASA ADS] [CrossRef] [Google Scholar]
- van Buren, D., Mac Low, M.-M., Wood, D. O. S., & Churchwell, E. 1990, ApJ, 353, 570 [NASA ADS] [CrossRef] [Google Scholar]
- van Leeuwen, F. 2007, A&A, 474, 653 [CrossRef] [EDP Sciences] [Google Scholar]
- van Terwisga, S. E., van Dishoeck, E. F., Mann, R. K., et al. 2020, A&A, 640, A27 [NASA ADS] [CrossRef] [EDP Sciences] [Google Scholar]
- Veilleux, S., & Osterbrock, D. E. 1987, ApJS, 63, 295 [Google Scholar]
- Vilchez, J. M., & Pagel, B. E. J. 1988, MNRAS, 231, 257 [NASA ADS] [CrossRef] [Google Scholar]
- Weilbacher, P. M., Monreal-Ibero, A., Kollatschny, W., et al. 2015, A&A, 582, A114 [NASA ADS] [CrossRef] [EDP Sciences] [Google Scholar]
- Wenger, M., Ochsenbein, F., Egret, D., et al. 2000, A&AS, 143, 9 [NASA ADS] [CrossRef] [EDP Sciences] [Google Scholar]
- Whitmore, B. C., Chandar, R., Kim, H., et al. 2011, ApJ, 729, 78 [NASA ADS] [CrossRef] [Google Scholar]
- Wilson, B. A., Dame, T. M., Masheder, M. R. W., & Thaddeus, P. 2005, A&A, 430, 523 [NASA ADS] [CrossRef] [EDP Sciences] [Google Scholar]
- Wilson, T. L., Bania, T. M., & Balser, D. S. 2015, ApJ, 812, 45 [NASA ADS] [CrossRef] [Google Scholar]
- Zari, E., Brown, A. G. A., & de Zeeuw, P. T. 2019, A&A, 628, A123 [NASA ADS] [CrossRef] [EDP Sciences] [Google Scholar]
- Zari, E., Rix, H. W., Frankel, N., et al. 2021, A&A, 650, A112 [NASA ADS] [CrossRef] [EDP Sciences] [Google Scholar]
- Zuckerman, B. 1973, ApJ, 183, 863 [NASA ADS] [CrossRef] [Google Scholar]
LCO is owned and operated by The Observatories of the Carnegie Institution for Science.
All Figures
|
Fig. 1 Coverage of Orion. The glimpse into Orion provided by LVM in this work (solid white line) covers a large area in the Orion Constellation, including two of the three belt stars, but does not include M42. The ultimate goal of LVM is to achieve complete coverage (dashed white line) of the extended ionized bubble, with sparser coverage extending out to a radius of 19.5 degrees. Relevant large-scale features and regions are labeled for reference. The optical image is based on astrophotography, courtesy of Rogelio Bernal Andreo. Overplotted in yellow is the dust opacity map derived from Herschel and Planck data (Lombardi et al. 2014). |
| In the text | |
|
Fig. 2 Sample LVM spectra. A full single fiber spectrum (top panel) demonstrates our full wavelength coverage from 3700–9800 Å, with the strongest emission line regions highlighted in grey. The lower panels highlight line emission from these narrow wavelength ranges, where Hβ, [OIII], [NII], Hα, and [SII] line emission is visible. A single fiber one the σOri bow wave (center left, red line) shows no evidence of line broadening or multiple kinematic components, but clear enhanced Balmer and [OIII] emission compared to a neighboring spaxel (black), and an enhanced [OIII]/Hβ line ratio compared to the integrated spectrum from IC 434. An integrated spectrum from IC 432 (bottom left) reveals no strong [OIII] emission but pronounced Balmer emission, consistent with photoionization by a B-type star. The Flame Nebula integrated spectrum (bottom right) shows nearly equal emission in both [SII] lines, indicating high electron densities. |
| In the text | |
|
Fig. 3 Our glimpse into Orion with LVM. 108 tiles cover 4 deg × 4 deg (30 pc × 30 pc), producing a total of almost 195 000 spectra. Colors show different emission lines (Hα: orange, [S II]6717+6731: light blue, [O III]5007: magenta) trace the ionization structure of the nebula, and carve a bubble into surrounding dense gas (WISE 12 μm: yellow). The ionized gas emission traces wispy, filamentary structures and dusty eroding clouds and clumps. The iconic Horsehead Nebula sits at the bright filamentary ionization front and photo-disassociation region between the central ionized nebula IC 434 and the dark neighboring molecular cloud Orion B to the east, while channels for escaping radiation are apparent in the north. |
| In the text | |
|
Fig. 4 Line emission and line ratios mapped across 20 pc×20 pc of the Orion belt region. Top left: Hα line emission is prominent within IC 434, the flame Nebula, and IC 432. Star symbols mark all individual ionizing O-type (blue) and B-type (cyan) stars, and dashed lines show the approximate boundaries of each nebula. Missing individual pixels are masked fibers with bright stars where our simplistic stellar continuum fitting was insufficient. Top center and right: [S II]/Hα and [N II]/Hα line ratio maps increase at the outskirts of IC 434 and the Flame nebulae. Bottom left: dust extinction via the Balmer decrement increases along the extent of the neighboring Orion B molecular cloud, and peaks at the young embedded Flame Nebula. Bottom center: the increased dust concentration in the Flame Nebula is particularly pronounced in the [S II]λ6717/[S II]λ6731 line ratio, which traces changes in gas density. Bottom right: [O III]/Hβ line ratios can only be mapped in the centers of IC 434 and the Flame Nebula. Higher values towards the center of IC 434 reflect the changing ionizing structure of the nebula, with more highly ionized oxygen found closer to the ionizing source. |
| In the text | |
|
Fig. 5 Diagnostic line ratios (left: [O III]/Hβ vs. [N II]/Hα; right: [O III]/Hβ vs. [S II]/Hα) for all pixels with significant detections in all lines. The curves shown from Kewley et al. (2001) (solid) and Kauffmann et al. (2003) (dashed) are commonly used (in integrated and kpc regions) to distinguish photoionized gas from gas ionized by harder ionizing sources. Requiring the detection of [O III] this diagnostic is limited to the areas of the Flame Nebula and the center of NGC 434 (see Figure 4), as well as to regions consistent with photoionization. Integrated results for IC 434 (triangle), IC 432 (square), and the Flame Nebula (circle) are overplotted, as well as integrated measurements from WHAM for single O-star powered Milky Way H II regions (orange) and extragalactic PHANGS H II regions with matched Hα luminosity (purple). Error bars are included, but are typically smaller than the marker size. |
| In the text | |
|
Fig. 6 [S II]/Hα as a function of [N II]/Hα for pixels across the map (left). Considering the line emissivity models of Madsen et al. (2006) (navy lines), we see how line ratios are expected to change as a function of S+/S (dashed). We color-code this 2D histogram distribution by the median extinction corrected Hα intensity (center) and the median extinction corrected [S III]/[S II] line ratio (right). We see that regions predicting lower S+ abundances are well matched to regions with high S++ abundances, as traced by [S III]/[S II]. The Flame Nebula stands out, with high [N II]/Hα but low [S II]/Hα line ratios, and high Hα intensities. Integrated Milky Way H II regions (IC 434: triangle, IC 432: square, Flame Nebula: circle, WHAM: orange points) exhibit low S+/S values as much of the sulfur is ionized to S++. Extragalactic H II regions at matched Hα luminosity (PHANGS: purple points) illustrate the challenges of separating H II regions from the DIG on ~100 pc scales, biasing diagnostic line ratios. |
| In the text | |
|
Fig. 7 σ Orionis (blue star), the central ionizing source of IC 434, and its bow wave. The star system consists of a close binary of spectral type O9.5V and B0.5V with a third massive companion (Simón-Díaz et al. 2011), and is moving eastward through the nebula in agreement with the arc direction (white arrow, representing 0.1 Myr of travel time; Perryman et al. 1997). Apparent in imaging in Hα (top left), [O III] (bottom left), WISE 12 μm (top right), and Herschel MIPS 24 μm (bottom right), we see the wind and radiation pressure interacting with the surrounding ISM (Ochsendorf et al. 2014). We further report increased [O III]/Hβ emission (bottom center) but no increase in the gas density as traced by the [S II] line ratio (top center). |
| In the text | |
|
Fig. 8 Line emission and optical images of IC 432. Cataloged as a reflection nebula, is revealed to also exhibit extended line emission in multiple lines, including [O II] and Hα (top row). The bright, blue reflection nebula is also seen to the east in optical Digitized Sky Surveys (DSS) red and blue imaging (bottom left), however, there is relatively low extinction inferred via the Balmer decrement (Hα/Hβ, bottom right). The central star, HD 37776 (cyan), is a magnetic chemically peculiar (helium-strong) star of spectral type B2V (Thompson & Landstreet 1985). |
| In the text | |
|
Fig. 9 Comparing ionized gas with dense gas and dust in the Horsehead Nebula. In Hα (top left), we see the filamentary photo-evaporation flow that streams out from the PDR towards the west. The Horsehead sits in projection against the vertically oriented PDR, where we see increased [S II]/Hα and [N II]/Hα (top center and left) in the ionization front. Hα contours (red) mirror the dust features unveiled in PAH-rich WISE 12 μm imaging (bottom left), atomic/ionized gas highlighted by [C II] imaging (bottom center, Pabst et al. 2017) and molecular gas seen in 12CO(1–0) (bottom right; Pety et al. 2017). |
| In the text | |
|
Fig. 10 Ori I-2, a cometary globule to the north of IC 434. Hα emission (top left) traces out a ~4 pc long tail, which also exhibits lower line ratios in [S II]/Hα (bottom left) and [N II]/Hα (bottom right). Tentative kinematic differences are also seen in Hα emission tracing the tail (top right). An overdensity of B stars (cyan) is also associated with the cometary tail. Note that the vertical stripe in the [N II]/Hα at the center of the tail is a data artifact. |
| In the text | |
Current usage metrics show cumulative count of Article Views (full-text article views including HTML views, PDF and ePub downloads, according to the available data) and Abstracts Views on Vision4Press platform.
Data correspond to usage on the plateform after 2015. The current usage metrics is available 48-96 hours after online publication and is updated daily on week days.
Initial download of the metrics may take a while.