Fig. 4
Download original image
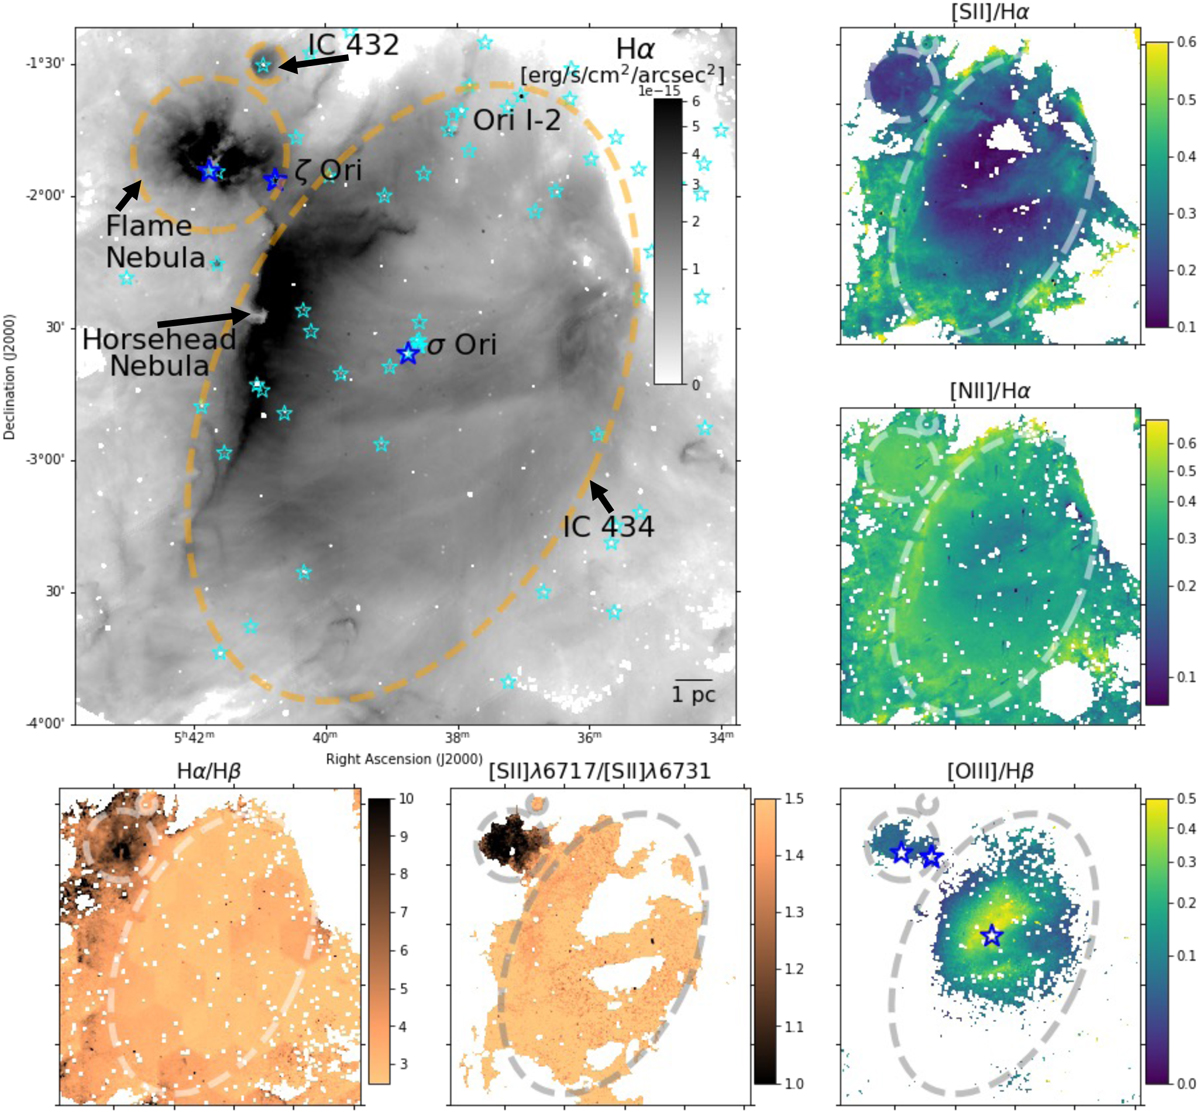
Line emission and line ratios mapped across 20 pc×20 pc of the Orion belt region. Top left: Hα line emission is prominent within IC 434, the flame Nebula, and IC 432. Star symbols mark all individual ionizing O-type (blue) and B-type (cyan) stars, and dashed lines show the approximate boundaries of each nebula. Missing individual pixels are masked fibers with bright stars where our simplistic stellar continuum fitting was insufficient. Top center and right: [S II]/Hα and [N II]/Hα line ratio maps increase at the outskirts of IC 434 and the Flame nebulae. Bottom left: dust extinction via the Balmer decrement increases along the extent of the neighboring Orion B molecular cloud, and peaks at the young embedded Flame Nebula. Bottom center: the increased dust concentration in the Flame Nebula is particularly pronounced in the [S II]λ6717/[S II]λ6731 line ratio, which traces changes in gas density. Bottom right: [O III]/Hβ line ratios can only be mapped in the centers of IC 434 and the Flame Nebula. Higher values towards the center of IC 434 reflect the changing ionizing structure of the nebula, with more highly ionized oxygen found closer to the ionizing source.
Current usage metrics show cumulative count of Article Views (full-text article views including HTML views, PDF and ePub downloads, according to the available data) and Abstracts Views on Vision4Press platform.
Data correspond to usage on the plateform after 2015. The current usage metrics is available 48-96 hours after online publication and is updated daily on week days.
Initial download of the metrics may take a while.