Fig. 6
Download original image
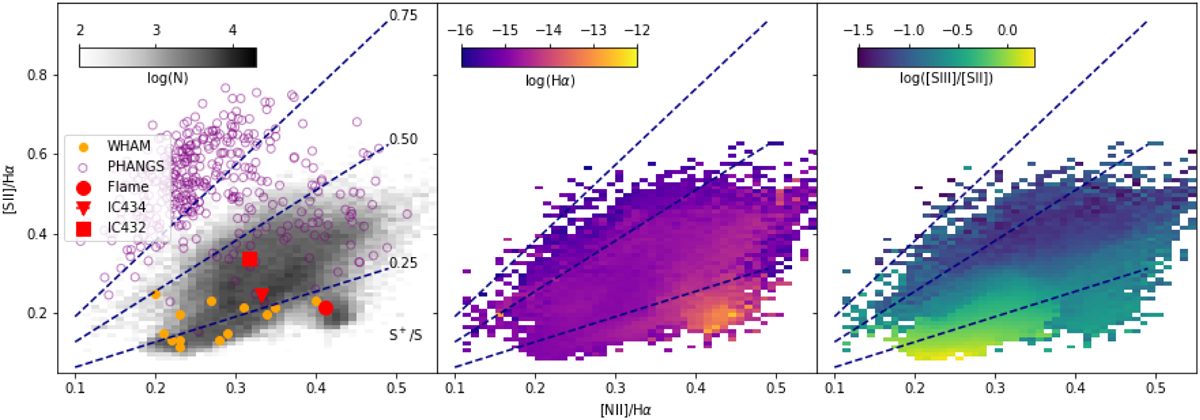
[S II]/Hα as a function of [N II]/Hα for pixels across the map (left). Considering the line emissivity models of Madsen et al. (2006) (navy lines), we see how line ratios are expected to change as a function of S+/S (dashed). We color-code this 2D histogram distribution by the median extinction corrected Hα intensity (center) and the median extinction corrected [S III]/[S II] line ratio (right). We see that regions predicting lower S+ abundances are well matched to regions with high S++ abundances, as traced by [S III]/[S II]. The Flame Nebula stands out, with high [N II]/Hα but low [S II]/Hα line ratios, and high Hα intensities. Integrated Milky Way H II regions (IC 434: triangle, IC 432: square, Flame Nebula: circle, WHAM: orange points) exhibit low S+/S values as much of the sulfur is ionized to S++. Extragalactic H II regions at matched Hα luminosity (PHANGS: purple points) illustrate the challenges of separating H II regions from the DIG on ~100 pc scales, biasing diagnostic line ratios.
Current usage metrics show cumulative count of Article Views (full-text article views including HTML views, PDF and ePub downloads, according to the available data) and Abstracts Views on Vision4Press platform.
Data correspond to usage on the plateform after 2015. The current usage metrics is available 48-96 hours after online publication and is updated daily on week days.
Initial download of the metrics may take a while.