Fig. 5
Download original image
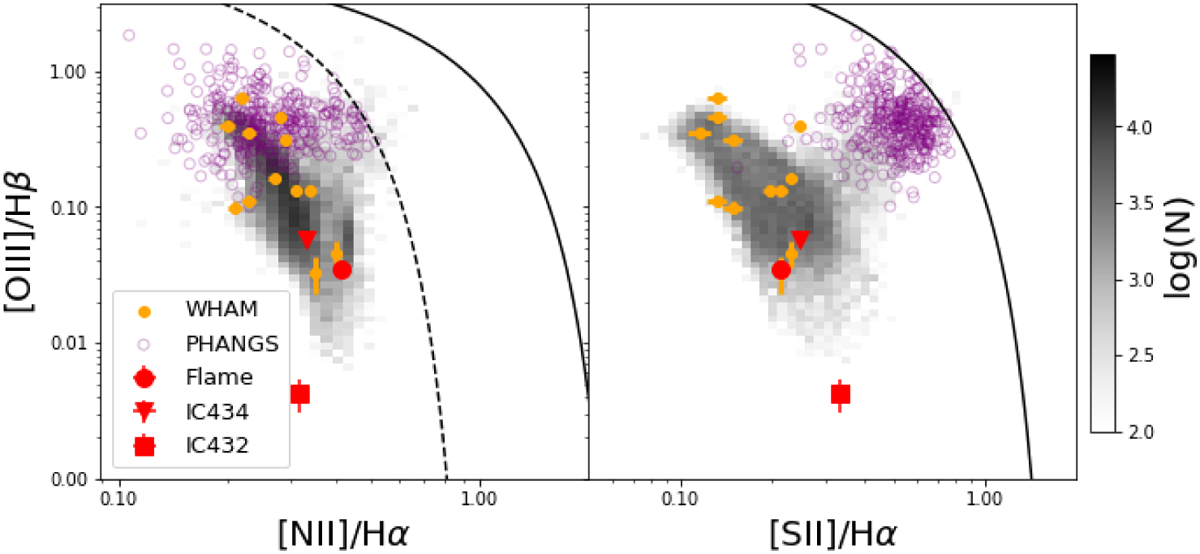
Diagnostic line ratios (left: [O III]/Hβ vs. [N II]/Hα; right: [O III]/Hβ vs. [S II]/Hα) for all pixels with significant detections in all lines. The curves shown from Kewley et al. (2001) (solid) and Kauffmann et al. (2003) (dashed) are commonly used (in integrated and kpc regions) to distinguish photoionized gas from gas ionized by harder ionizing sources. Requiring the detection of [O III] this diagnostic is limited to the areas of the Flame Nebula and the center of NGC 434 (see Figure 4), as well as to regions consistent with photoionization. Integrated results for IC 434 (triangle), IC 432 (square), and the Flame Nebula (circle) are overplotted, as well as integrated measurements from WHAM for single O-star powered Milky Way H II regions (orange) and extragalactic PHANGS H II regions with matched Hα luminosity (purple). Error bars are included, but are typically smaller than the marker size.
Current usage metrics show cumulative count of Article Views (full-text article views including HTML views, PDF and ePub downloads, according to the available data) and Abstracts Views on Vision4Press platform.
Data correspond to usage on the plateform after 2015. The current usage metrics is available 48-96 hours after online publication and is updated daily on week days.
Initial download of the metrics may take a while.