Fig. 2
Download original image
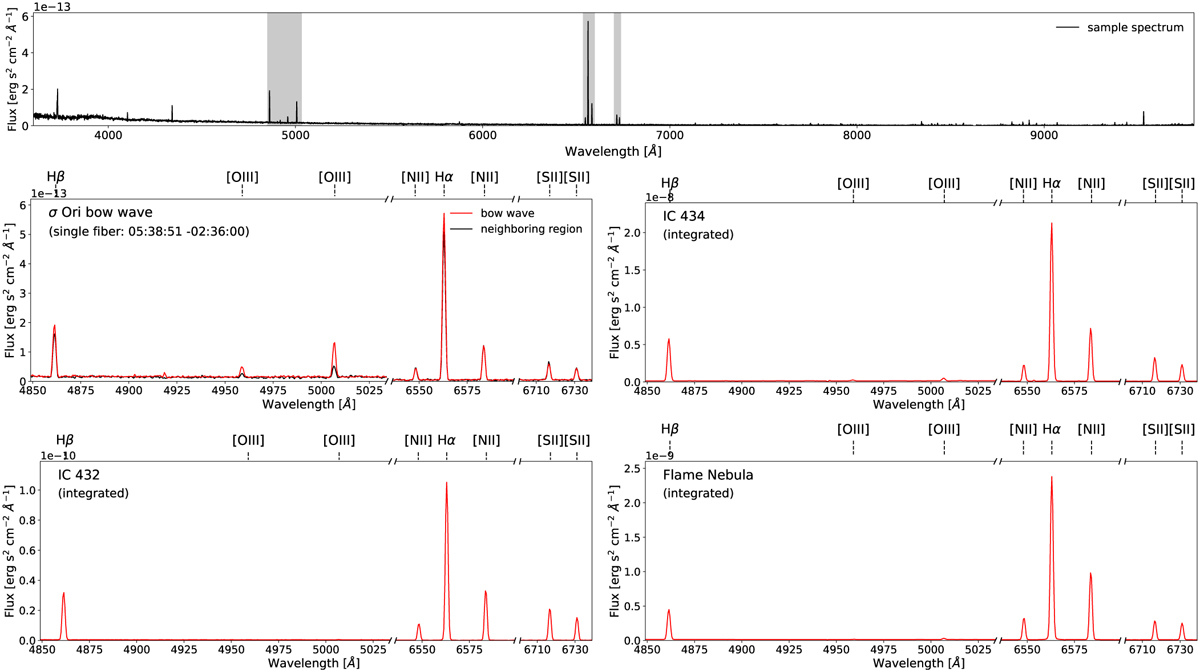
Sample LVM spectra. A full single fiber spectrum (top panel) demonstrates our full wavelength coverage from 3700–9800 Å, with the strongest emission line regions highlighted in grey. The lower panels highlight line emission from these narrow wavelength ranges, where Hβ, [OIII], [NII], Hα, and [SII] line emission is visible. A single fiber one the σOri bow wave (center left, red line) shows no evidence of line broadening or multiple kinematic components, but clear enhanced Balmer and [OIII] emission compared to a neighboring spaxel (black), and an enhanced [OIII]/Hβ line ratio compared to the integrated spectrum from IC 434. An integrated spectrum from IC 432 (bottom left) reveals no strong [OIII] emission but pronounced Balmer emission, consistent with photoionization by a B-type star. The Flame Nebula integrated spectrum (bottom right) shows nearly equal emission in both [SII] lines, indicating high electron densities.
Current usage metrics show cumulative count of Article Views (full-text article views including HTML views, PDF and ePub downloads, according to the available data) and Abstracts Views on Vision4Press platform.
Data correspond to usage on the plateform after 2015. The current usage metrics is available 48-96 hours after online publication and is updated daily on week days.
Initial download of the metrics may take a while.