Fig. 10
Download original image
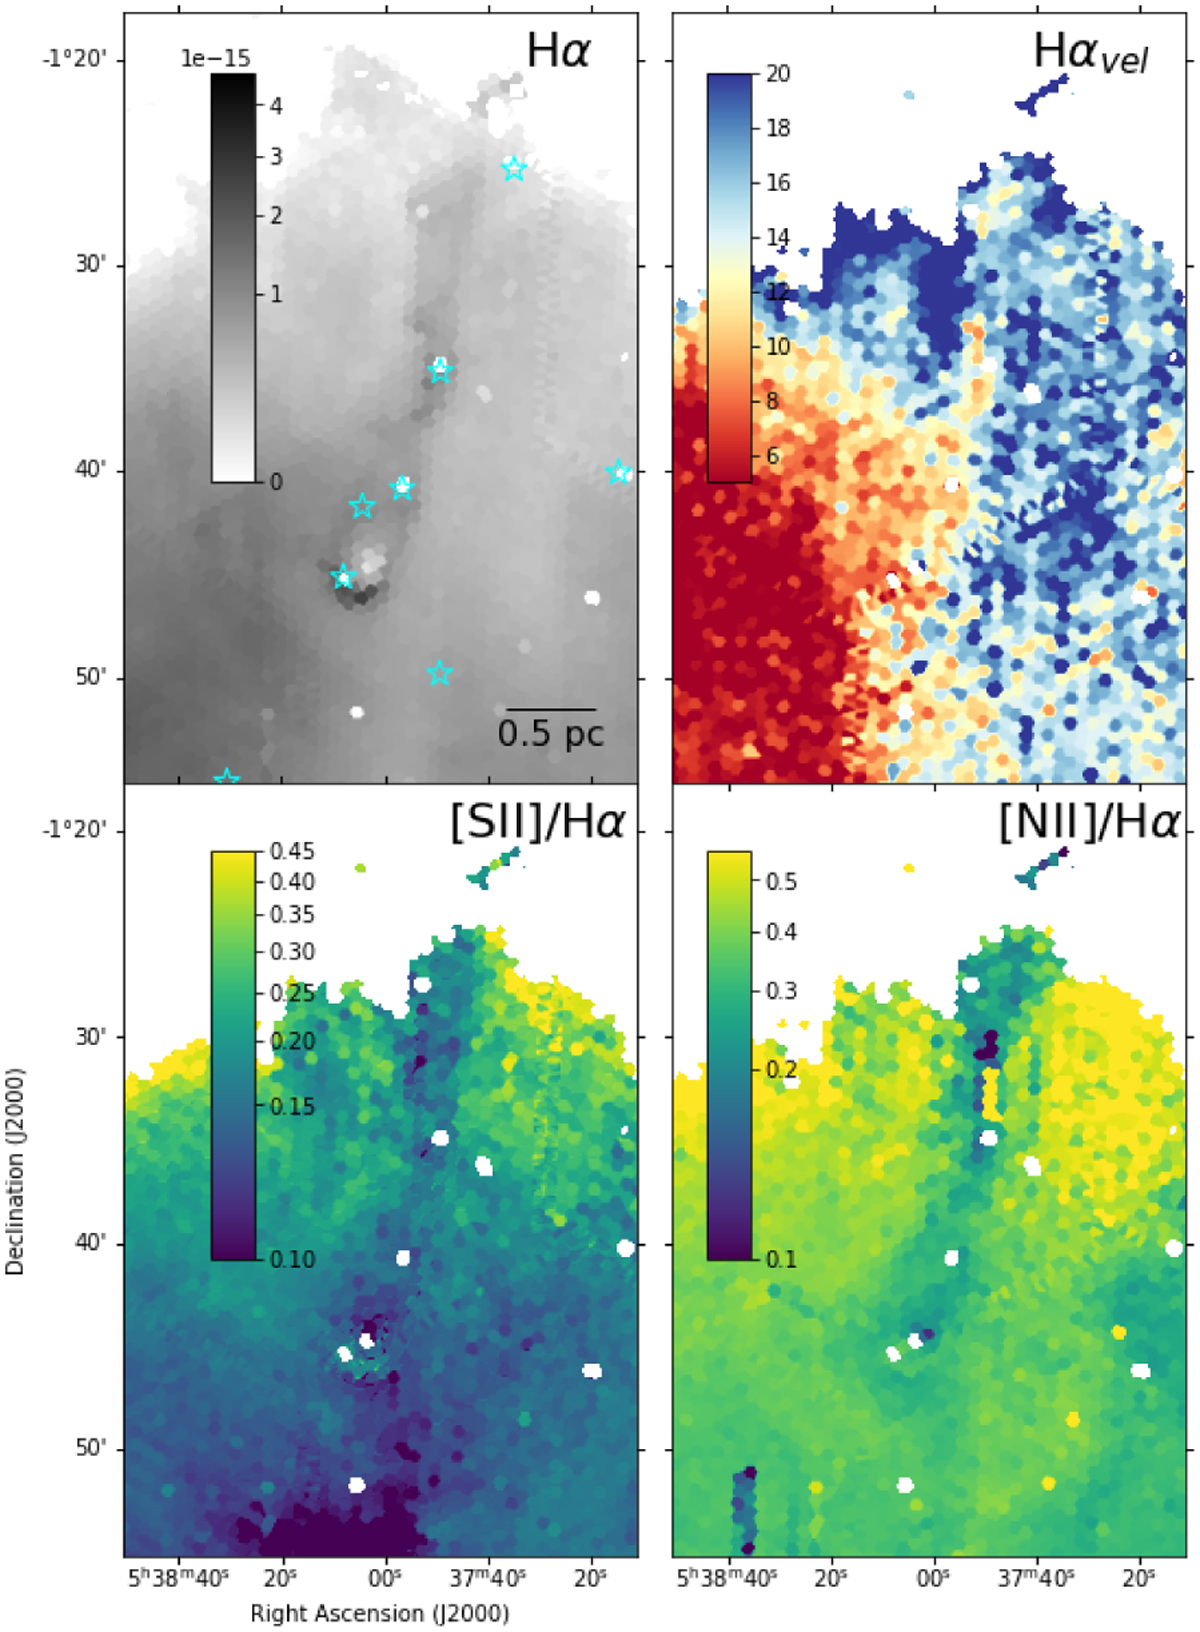
Ori I-2, a cometary globule to the north of IC 434. Hα emission (top left) traces out a ~4 pc long tail, which also exhibits lower line ratios in [S II]/Hα (bottom left) and [N II]/Hα (bottom right). Tentative kinematic differences are also seen in Hα emission tracing the tail (top right). An overdensity of B stars (cyan) is also associated with the cometary tail. Note that the vertical stripe in the [N II]/Hα at the center of the tail is a data artifact.
Current usage metrics show cumulative count of Article Views (full-text article views including HTML views, PDF and ePub downloads, according to the available data) and Abstracts Views on Vision4Press platform.
Data correspond to usage on the plateform after 2015. The current usage metrics is available 48-96 hours after online publication and is updated daily on week days.
Initial download of the metrics may take a while.