| Issue |
A&A
Volume 688, August 2024
|
|
|---|---|---|
| Article Number | L22 | |
| Number of page(s) | 13 | |
| Section | Letters to the Editor | |
| DOI | https://doi.org/10.1051/0004-6361/202450742 | |
| Published online | 09 August 2024 | |
Letter to the Editor
FAUST
XVII. Super deuteration in the planet-forming system IRS 63 where the streamer strikes the disk
1
INAF, Osservatorio Astrofisico di Arcetri, Largo E. Fermi 5, I-50125 Firenze, Italy
2
Univ. Grenoble Alpes, CNRS, IPAG, 38000 Grenoble, France
3
Department of Astronomy, The University of Texas at Austin, 2515 Speedway, Austin, TX 78712, USA
4
Department of Chemistry, Biology, and Biotechnology, The University of Perugia, Via Elce di Sotto 8, 06123 Perugia, Italy
5
Departament de Química, Universitat Autònoma de Barcelona, 08193 Bellaterra, Spain
6
Dipartimento di Chimica and Nanostructured Interfaces and Surfaces (NIS) Centre, Università degli Studi di Torino, via P. Giuria 7, I-10125 Torino, Italy
7
National Radio Astronomy Observatory, PO Box O Socorro, NM 87801, USA
8
RIKEN Cluster for Pioneering Research, 2-1, Hirosawa, Wako-shi, Saitama 351-0198, Japan
9
Center for Astrochemical Studies, Max-Planck-Institut für extraterrestrische Physik (MPE), Gie βenbachstr. 1, D-85741 Garching, Germany
10
European Southern Observatory, Karl-Schwarzschild Str. 2, 85748 Garching bei München, Germany
11
Excellence Cluster ORIGINS, Boltzmannstraße 2, D-85748 Garching bei München, Germany
12
Department of Physics and Astronomy, Rice University, 6100 Main Street, MS-108, Houston, TX 77005, USA
13
Department of Astronomy, The University of Tokyo, 7-3-1 Hongo, Bunkyo-ku, Tokyo 113-0033, Japan
14
Leiden Observatory, Leiden University, PO Box 9513 2300 RA Leiden, The Netherlands
15
IRAP, Univ. de Toulouse, CNRS, CNES, UPS, Toulouse, France
16
Astrochemistry Laboratory, Code 691, NASA Goddard Space Flight Center, 8800 Greenbelt Road, Greenbelt, MD 20771, USA
17
CY Cergy Paris Université, Sorbonne Université, Observatoire de Paris, PSL University, CNRS, LERMA, F-95000 Cergy, France
18
School of Physics and Astronomy, University of Leeds, Leeds LS2 9JT, UK
19
Department of Astronomy, Xiamen University, Xiamen, Fujian 361005, PR China
20
Komaba Institute for Science, The University of Tokyo, 3-8-1 Komaba, Meguro, Tokyo 153-8902, Japan
21
Department of Basic Science, The University of Tokyo, 3-8-1 Komaba, Meguro, Tokyo 153-8902, Japan
22
Center for Frontier Science, Chiba University, 1-33 Yayoi-cho, Inage-ku, Chiba 263-8522, Japan
23
Department of Chemistry, University of Virginia, McCormick Road, PO Box 400319 Charlottesville, VA 22904, USA
24
National Astronomical Observatory of Japan, Osawa 2-21-1, Mitaka-shi, Tokyo 181-8588, Japan
25
Centro de Astrobiología (CAB), CSIC-INTA, Ctra. de Torrejón a Ajalvir, km 4, 28850 Torrejón de Ardoz, Spain
26
NRC Herzberg Astronomy and Astrophysics, 5071 West Saanich Road, Victoria, BC V9E 2E7, Canada
27
Department of Physics and Astronomy, University of Victoria, Victoria, BC V8P 5C2, Canada
28
Université de Bordeaux – CNRS Laboratoire d’Astrophysique de Bordeaux, 33600 Pessac, France
29
Institut de Radioastronomie Millimétrique, 38406 Saint-Martin d’Hères, France
30
Instituto de Radioastronomía y Astrofísica, Universidad Nacional Autónoma de México, A.P. 3-72 (Xangari), 8701 Morelia, Mexico
31
LERMA, Observatoire de Paris, PSL Research University, CNRS, Sorbonne Université, 92190 Meudon, France
32
Institute of Astronomy and Astrophysics, Academia Sinica, 11F of Astronomy-Mathematics Building, AS/NTU No.1, Sec. 4, Roosevelt Rd., Taipei 10617, Taiwan, ROC
33
Division of Science, National Astronomical Observatory of Japan, 2-21-1 Osawa, Mitaka, Tokyo 181-8588, Japan
34
Institute of Low Temperature Science, Hokkaido University, N19W8, Kita-ku, Sapporo, Hokkaido 060-0819, Japan
35
Department of Physics, The University of Tokyo, 7-3-1, Hongo, Bunkyo-ku, Tokyo 113-0033, Japan
36
Yukawa Institute for Theoretical Physics, Kyoto Univ. Oiwake-cho, Kitashirakawa, Sakyo-ku, Kyoto-shi, Kyoto-fu 606-8502, Japan
37
Graduate School of Informatics and Engineering, The University of Electro-Communications, Chofu, Tokyo 182-8585, Japan
38
Steward Observatory, 933 N Cherry Ave., Tucson, AZ 85721, USA
39
Dipartimento di Fisica e Astronomia “Augusto Righi”, Viale Berti Pichat 6/2, Bologna, Italy
40
Materials Science and Engineering, College of Engineering, Shibaura Institute of Technology, 3-7-5 Toyosu, Koto-ku, Tokyo 135-8548, Japan
41
Star and Planet Formation Laboratory, RIKEN Cluster for Pioneering Research, Wako, Saitama 351-0198, Japan
42
SOKENDAI (The Graduate University for Advanced Studies), Shonan Village, Hayama, Kanagawa 240-0193, Japan
Received:
16
May
2024
Accepted:
28
June
2024
Abstract
Context. Recent observations suggest that planet formation starts early, in protostellar disks of ≤105 yr, which are characterized by strong interactions with the environment, such as through accretion streamers and molecular outflows.
Aims. To investigate the impact of such phenomena on the physical and chemical properties of a disk, it is key to understand what chemistry planets inherit from their natal environment.
Methods. In the context of the ALMA large program Fifty AU Study of the chemistry in the disk/envelope system of solar-like protostars (FAUST), we present observations on scales from ∼1500 au to ∼60 au of H2CO, HDCO, and D2CO toward the young planet-forming disk IRS 63.
Results. The H2CO probes the gas in the disk as well as in a large scale streamer (∼1500 au) impacting onto the southeast disk side. We detected for the first time deuterated formaldehyde, HDCO and D2CO, in a planet-forming disk and HDCO in the streamer that is feeding it. These detections allowed us to estimate the deuterium fractionation of H2CO in the disk: [HDCO]/[H2CO] ∼ 0.1 − 0.3 and [D2CO]/[H2CO] ∼ 0.1. Interestingly, while HDCO follows the H2CO distribution in the disk and in the streamer, the distribution of D2CO is highly asymmetric, with a peak of the emission (and [D]/[H] ratio) in the southeast disk side, where the streamer crashes onto the disk. In addition, D2CO was detected in two spots along the blue- and redshifted outflow. This suggests that (i) in the disk, HDCO formation is dominated by gas-phase reactions in a manner similar to H2CO, while (ii) D2CO is mainly formed on the grain mantles during the prestellar phase and/or in the disk itself and is at present released in the gas phase in the shocks driven by the streamer and the outflow.
Conclusions. These findings testify to the key role of streamers in the buildup of the disk concerning both the final mass available for planet formation and its chemical composition.
Key words: astrochemistry / protoplanetary disks / stars: formation / ISM: individual objects: IRS 63
Corresponding author; mailto: This email address is being protected from spambots. You need JavaScript enabled to view it. .
© The Authors 2024
 Open Access article, published by EDP Sciences, under the terms of the Creative Commons Attribution License (https://creativecommons.org/licenses/by/4.0), which permits unrestricted use, distribution, and reproduction in any medium, provided the original work is properly cited.
This article is published in open access under the Subscribe to Open model. This email address is being protected from spambots. You need JavaScript enabled to view it. to support open access publication.
1. Introduction
Observations of embedded Class 0 and I sources provide evidence that planet formation starts early, in disks with ages of ≤105 years. Evidence of dust growth up to millimeter sizes in young disks (e.g., Miotello et al. 2014; Harsono et al. 2018; Sabatini et al. 2024) as well as observations of rings and gaps in their dust distribution strongly support this hypothesis (e.g., ALMA Partnership et al. 2015; Sheehan & Eisner 2018; Segura-Cox et al. 2020).
These young disks are characterized by strong interactions with the surrounding environment, which may affect the disk’s physical (e.g., mass and kinematics) and chemical (e.g., molecular abundances) properties. For example, recent observations at millimeter wavelengths have revealed streamers channeling gas and dust from the outer regions of the envelope or even from the surrounding cloud to the disk, hence playing a key role in regulating the mass of the disk (e.g., Pineda et al. 2020, 2023; Valdivia-Mena et al. 2022; Cacciapuoti et al. 2024; Mercimek et al. 2023) as well as its chemical composition (e.g., Garufi et al. 2022; Maureira et al. 2022; Valdivia-Mena et al. 2023; Bianchi et al. 2022, 2023; Codella et al. 2024). It is therefore crucial to investigate how the properties of young disks are affected by environmental processes in order to understand how planets formed in the Solar System as well as in other planetary systems and what chemistry they inherited from their natal environment.
To this aim, the large program (LP) Fifty AU Study of the chemistry in the disk/envelope system of solar-like protostars (FAUST) is designed to observe young disks with the Atacama Large Millimeter/submillimeter Array (ALMA) using three different configurations of the antennas, which enables the chemistry of disks and of their environment to be probed from large (thousands of au) to small (50 au) scales (Codella et al. 2021). In the sample of protostars observed by FAUST, the ideal candidate to probe the disk properties and their interconnection with the environment is the Class I source IRS 63, located in the nearby Ophiuchus star-forming region at a distance of 144 pc (Ortiz-León et al. 2018). The ALMA observations of millimeter continuum emission at ∼5 au resolution have shown a relatively large dusty disk (∼82 au) characterized by multiple annular substructures (two rings and two gaps) that are suggestive of ongoing planet formation (Segura-Cox et al. 2020). Recent observations of 13CO and C18O by Flores et al. (2023) have revealed the gaseous disk, which extends out to ∼260 au (i.e., about three times larger than the dust disk), and enabled an estimation of the protostellar mass from Keplerian velocity fitting (M* = 0.5 ± 0.2 M⊙). Moreover, their observations have shown that IRS 63 is associated with a bipolar outflow (seen in 12CO), a rotating envelope (in 13CO), and a large-scale streamer that connects the envelope to the disk (in C18O) with small-scale spiral structures at the edge of the dust continuum (in SO). These observations have shown that the streamer and the spiral structures originate from an infalling rotating structure that feeds the protostellar disk at a rate of ∼10−6 M⊙ yr−1, that is, two orders of magnitude larger than the disk-to-star mass accretion rate of ∼10−8 M⊙ yr−1 (Flores et al. 2023).
In this Letter, we analyzed for the first time the deuterated isotopologues of H2CO toward the planet-forming disk IRS 63 and its streamer. Theoretical and observational studies indicate that deuterated molecules are “fossils” of the prestellar core phase, and their abundances may be inherited from these early phases (e.g., Caselli & Ceccarelli 2012; Ceccarelli et al. 2014; Jensen et al. 2021). Hence, they are ideal for investigating the impact, if any, of the large-scale streamer on the disk chemical content at the time of planet formation.
2. Observations and data reduction
In the context of ALMA LP FAUST (2018.1.01205.L, PI: S. Yamamoto), the Class I protostellar disk IRS 63 was observed between 2018 and 2020 in Band 6 using three configurations: two configurations with the main array (12 m, C43-4 and C43-1) and one configuration with the Atacama Compact Array (ACA, 7-m antennas). The observations were taken using two spectral setups that each covered 12 narrow spectral windows (SPWs) centered on selected molecular lines (channel width 0.12 MHz, coverage ∼58 MHz) and one wide SPW that covered ∼2 GHz with a channel width of 0.49 MHz. The spectral setups covered p-H2CO 30, 3 − 20, 2 (Eup ∼ 21 K); o-D2CO 40, 4 − 30, 3, 42, 3 − 32, 2 (Eup ∼ 28, 50 K); and HDCO 41, 4 − 31, 3, 42, 2 − 32, 1 (Eup ∼ 38, 63 K). The o-D2CO 42, 3 − 32, 2 and HDCO 41, 4 − 31, 3 lines were covered by the wide SPW; hence, they are at a lower spectral resolution. The observations taken in the three configurations were combined using the “mosaic” gridder in tclean within the Common Astronomy Software Applications (CASA) package. The line-free continuum channels were identified and subtracted, and the data were self-calibrated, imaged, and cleaned, applying robust weighting (robust 0.5) and obtaining a clean beam of  for the lines. The properties of the observed lines (transition, frequency, and upper-level energy, Eup) and of the obtained line cubes (clean beam, channel width, and root mean square noise) are summarized in Table 1. The channel maps of the H2CO line cube and of the brightest HDCO and D2CO line cubes are shown in Figs. A.1, A.2, A.3, and A.4. Finally, integrated intensity maps (moment 0) and intensity-weighted velocity maps (moment 1) were obtained as shown in Fig. 1 and in Fig. 2, where a 2σ clipping was applied.
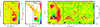 |
Fig. 1. Streamer and disk of IRS 63 as probed by p-H2CO 3(0, 3)−2(0, 2), HDCO 4(1, 4)−3(1, 3), and o-D2CO 4(0, 4)−3(0, 3). From left to right: Panels A and B show the moment 0 and moment 1 maps of the H2CO emission. Panels C, D, and E show a zoom-in of H2CO, HDCO, and D2CO integrated intensity on the blueshifted velocity range [+2.0, +2.6] km s−1, which probes the terminal portion of the streamer impacting onto the disk. The map of HDCO covers a larger velocity range [+1.4, +2.6] km s−1 due to the larger channel width of the line cube (1.19 km s−1). The first contours and steps correspond to 3σ (0.5 mJy beam−1 km s−1). |
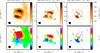 |
Fig. 2. Zoom-in of the integrated intensity (moment 0, upper panels) and intensity weighted velocity (moment 1, lower panels) maps of the H2CO, HDCO, and D2CO line emission toward the IRS 63 disk (same transitions as in Fig. 1). The continuum emission at 1.3 mm is in black (contours from 10σ with steps of 500σ, with σ = 0.7 mJy beam−1). The transition and upper-level energy are labeled at the top, and the beam is shown in the lower left of each panel. |
3. Results
The moment 0 and moment 1 maps of formaldehyde (H2CO) and of the lower Eup lines of its singly and doubly deuterated forms (i.e., HDCO 246.9 GHz and D2CO 231.4 GHz) are shown in Figs. 1 and 2, overlapped with the contours of the continuum emission at 1.3 mm (see Sect. 3.1). Figure 1 shows a 10″ × 15″ region where we investigated the emission on large scales (see Sect. 3.2), while Fig. 2 shows a zoom-in (4″ × 4″) focusing on the distribution of molecules in the disk (see Sect. 3.3).
3.1. Continuum emission at 1.3 millimeters: The dusty disk
The continuum emission shows a smooth distribution with no signatures of the rings and gaps first identified by Segura-Cox et al. (2020) due to the approximately ten times lower angular resolution of the FAUST map ( , PA = 84.25°) compared to their map (
 , i.e., ∼7 × 4 au). We performed a 2D Gaussian fit in order to estimate the disk parameters: peak coordinates (RA(J2000) = 16h31m35s.66, Dec(J2000)
  ); peak intensity (Fpeak = 112.7 ± 0.4 mJy/beam); integrated flux density at 1.3 mm (293 ± 1 mJy); and disk position angle and inclination (PAdisk = 149 ± 1°, i = 47 ± 1°). The values are in agreement with those estimated by Segura-Cox et al. (2020) from their higher resolution continuum maps.
3.2. The streamer feeding the IRS 63 disk
The moment 0 and moment 1 maps in Fig. 1 show that the H2CO line at 218.2 GHz probes the gas in the disk of IRS 63 as well as in the accretion streamer first identified in C18O by Flores et al. (2023). The streamer extends from ∼1500 au northeast to IRS 63 down to the western disk side and shows a velocity gradient with velocities spanning from ∼3.3 km s−1, that is, redshifted with respect to systemic (VLSR ∼ +2.8 km s−1) in the northern part, down to ∼2 km s−1 in the southern part, where the streamer appears to connect to the disk. The channel maps in Fig. A.1 show that the spatial distribution of the H2CO emission in the disk in each velocity channel is not symmetric with respect to the disk major axis, as expected in a Keplerian rotating disk. This asymmetry is likely produced by the perturbation induced by the streamer as it approaches the disk. A detailed analysis of the physical, kinematical, and chemical properties of the streamer is beyond the scope of this Letter and will be presented in a paper by Pineda et al. (in prep.). In the present study, we focus on the chemistry of deuterated H2CO in IRS 63. Panels C, D, and E of Fig. 1 show a zoom-in of the H2CO 218.2 GHz, HDCO 246.9 GHz, and D2CO 231.4 GHz line emission integrated on the blueshifted velocity range where the streamer emits (i.e., VLSR = [ + 2.0, +2.6] km s−1). The H2CO map shows that the terminal blueshifted part of the streamer connects to the disk perpendicularly to its major axis and toward the SE disk side. Interestingly, small selected portions of the streamer are also detected in HDCO and D2CO. More specifically, (i) the brightest part of the arc located NW to the source at an offset of  in Dec and
  and −2″ in RA is also detected in HDCO, and (ii) the terminal portion of the streamer impacting onto the SE disk side is also detected in the HDCO and D2CO lines.
3.3. H2CO, HDCO and D2CO in the disk and outflow
Figure 2 shows a zoom-in of the moment 0 and 1 maps on the IRS 63 disk. The H2CO line at 218.2 GHz probes the gas in the disk, which extends beyond the continuum emission from the millimeter dusty grains, as typically observed in disks (e.g., Garufi et al. 2021; Öberg et al. 2021), and it shows the typical velocity pattern of the gas in a rotating disk. A narrow stripe with no emission can be observed along the minor axis due to absorption of the line emission by H2CO molecules in the surrounding envelope at velocities close to the systemic velocity (VLSR ∼ +2.8 km s−1). Moreover, the channel maps of H2CO shown in the Appendix (Fig. A.2) show negative fluxes in the inner ∼20 au disk region in the channels close to systemic velocity (between 2.15 and 3.15 km s−1) due to optically thick continuum emission and absorption by molecules along the line of sight. The emission detected west of the disk probes the large-scale streamer discussed in Sect. 3.2.
The HDCO 41, 4 − 31, 3 line (Eup ∼ 38 K) shows a spatial and velocity distribution similar to H2CO, with two bright spots of emission in the NW and SE disk sides along the disk’s major axis. The emission in the H2CO and HDCO lines is brighter in the northwest side of the disk, where the continuum also has higher intensity values at most radii compared to the southeast side of the disk (Segura-Cox et al. 2020, see Figs. 2 and A.3). This indicates that the considered H2CO and HDCO lines probe roughly the same disk region despite the upper-level energy of the HDCO line being slightly higher than for H2CO (Eup ∼ 38 K and ∼21 K, respectively). The D2CO 40, 4 − 30, 3 line at 231.4 GHz (Eup ∼ 28 K) is firmly detected in the southeast disk side, while no emission above the 2σ threshold was detected in the NW side (see Figs. 2 and A.4). Despite the similar Eup, the fact that the spatial distribution of D2CO is different from that of HDCO and H2CO suggests a different chemical origin (see Sect. 4). The moment 0 map of the HDCO 246.9 GHz and D2CO 231.4 GHz lines also show two spots of emission along the disk minor axis, that is, along the direction of the bipolar outflow identified in 12CO by Flores et al. (2023). The moment 1 map shows that the velocity gradient is consistent with that of the 12CO outflow, with blueshifted emission toward the southwest and redshifted toward the northeast. Finally, as already pointed out in Sect. 3.2, the moment 0 and 1 maps of HDCO also show emission in a small portion of the arc-like streamer located NW of the disk identified in H2CO.
The higher excitation HDCO 259.0 GHz and D2CO 233.7 GHz lines (Eup ∼ 63 K and 50 K, respectively) are fainter, and no emission was detected in the moment 0 maps obtained applying a 2σ threshold. However, the fainter HDCO line at 259.0 GHz was detected in the disk-integrated spectra extracted by integrating out to a radius of  (i.e., 187 au), while no emission was seen in the higher excitation D2CO line at 233.7 GHz (see Fig. B.1).
3.4. Molecular column density and deuterium fractionation
Figure B.1 shows the H2CO, HDCO, and D2CO line spectra obtained by integrating the line cubes on the SE and NW disk sides on a  area (corresponding to ∼1.4 beams) where HDCO emission was detected. These spectra allowed us to verify that the detected H2CO 218.2 GHz, HDCO 246.9 GHz, and D2CO 231.4 GHz lines originate from the same disk layer and to recover the emission in the fainter HDCO 259.0 GHz and D2CO 233.7 GHz lines (undetected in the channel and moment 0 maps). The integrated spectra show that the fainter, higher excitation HDCO line at 259.0 GHz was detected at greater than 2σ in both the SE and NW disk sides, while D2CO was detected only in the lower excitation line at Eup = 28 K. The peak intensity of the H2CO, HDCO, and D2CO lines at the SE and NW disk sides is ∼1.5 − 2 K (H2CO) and ∼0.2 − 0.6 K (HDCO and D2CO). If we assume that the lines are in local thermodynamic equilibrium (LTE), that is, the gas density is larger than the lines’ critical density – which is very likely in the disk, the line brightness temperature Tmb, in K, corresponds to the gas temperature if the lines are optically thick. The low Tmb values in the spectra (< 2 K) indicate that the lines are optically thin. The integrated intensities and upper limits in the SE and NW disk sides are reported in Table 1.
Properties of the observed lines and of the obtained line cubes.
The molecular column densities and gas temperature were obtained in two steps under the assumption of LTE and optically thin emission. First, the ratio of the integrated intensities of the two HDCO lines was used to estimate the excitation temperature. Even though the range of upper-level energies covered by the lines is small (Eup = 38 K and 63 K), the HDCO line ratios indicate that the excitation temperature, Tex, is ∼49 K in the SE disk side, where the streamer impacts onto the disk, and Tex ∼ 39 K in the NW disk side. Second, we assumed that the H2CO, HDCO, and D2CO emission originate from the same disk layer (as indicated by the fact that they are co-spatial in the moment 0 maps and emit on the same velocity range in the integrated spectra), at an average excitation temperature of 45 K, and we obtained their column density, N, pixel by pixel from the line-integrated intensity (moment 0) maps1. Figure 3 shows the maps of the obtained column densities: the H2CO column density is ∼1.2 − 3.8 × 1013 cm−2 in the disk and 0.2 − 1.2 × 1013 cm−2 in the streamer; N(HDCO) is 3 − 8.5 × 1012 cm−2 in the SE and NW disk sides and 2 − 3 × 1012 cm−2 in the streamer and in the outflow; N(D2CO) is ∼1 − 4 × 1012 cm−2 in the SE disk side and 1 − 2 × 1012 cm−2 in the outflow spots along the disk minor axis.
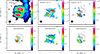 |
Fig. 3. Maps of column densities and abundance ratios toward IRS 63. Upper panels: Column density maps of H2CO, HDCO, and D2CO derived assuming LTE and optically thin emission at the temperature derived from the HDCO lines (Tex = 45 K). Lower panels: Maps of the abundance ratios [D2CO]/[HDCO], [HDCO]/[H2CO], and [D2CO]/[H2CO]. The continuum emission at 1.3 mm is in black (contours from 10σ with steps of 500σ, with σ = 0.7 mJy beam−1). |
From the obtained column density maps, we estimated the abundance ratio maps: [HDCO]/[H2CO] = NHDCO/NH2CO, [D2CO]/[H2CO] = ND2CO/NH2CO, and [D2CO]/[HDCO] = ND2CO/NHDCO (see Fig. 3). The deuterium fractionation, [D]/[H], can be inferred from the abundance ratio between the deuterated isotopologue and the main conformer by taking into account the number of arrangements of the deuterium atoms (e.g., Manigand et al. 2019), namely:
 (1)
(1)
where n is the number of valence of the X group, i is the number of D attached to the X group, and  is the number of arrangements of i into n. Therefore, [D]/[H] = 0.5 × [HDCO]/[H2CO], and [D]/[H]
 ![Mathematical equation: $ {=}\,\sqrt{\mathrm{[D_2CO]/[H_2CO]}} $](/articles/aa/full_html/2024/08/aa50742-24/aa50742-24-eq11.gif) . The deuteration of HDCO in the two disk sides and in the blue- and red-shifted outflow lobes is [HDCO]/[H2CO] ∼ 0.1 − 0.3, which implies [D]/[H] ∼ 5 − 15%. Doubly deuterated formaldehyde is more abundant in the SE disk side; therefore, the abundance ratio [D2CO]/[H2CO] is highly asymmetric in the disk, [D2CO]/[H2CO] ∼ 0.1 ([D]/[H] ∼ 32%) in the SE disk, while from the integrated spectra, we estimated a factor of two lower deuteration in the NW disk side ([D2CO]/[H2CO] ∼ 0.05, implying [D]/[H] ∼ 22%). The [D2CO]/[HDCO] abundance ratio varies between 0.3 and 0.7 in the SE disk side and in the outflow lobes. As shown in Fig. C.1, the [HDCO]/[H2CO] and [D2CO]/[H2CO] abundance ratios estimated in the Class I disk of IRS 63 are, on average, at the upper edge of the range of values estimated in prestellar cores (Chacón-Tanarro et al. 2019; Bacmann et al. 2003) and in Class 0 (Parise et al. 2006; Watanabe et al. 2012; Persson et al. 2018; Manigand et al. 2020; Evans et al. 2023) and Class I (Bianchi et al. 2017; Mercimek et al. 2022) protostars, and the ratios are in agreement with the only available upper limit obtained in a disk (Oph IRS48, van der Marel et al. 2021; Brunken et al. 2022). Moreover, the [HDCO]/[H2CO] abundance ratios in the outflow shocks driven by IRS 63 (∼ 0.1 − 0.3) are in agreement with those estimated in the L1157-B1 protostellar shock (∼0.1, Fontani et al. 2014).
. The deuteration of HDCO in the two disk sides and in the blue- and red-shifted outflow lobes is [HDCO]/[H2CO] ∼ 0.1 − 0.3, which implies [D]/[H] ∼ 5 − 15%. Doubly deuterated formaldehyde is more abundant in the SE disk side; therefore, the abundance ratio [D2CO]/[H2CO] is highly asymmetric in the disk, [D2CO]/[H2CO] ∼ 0.1 ([D]/[H] ∼ 32%) in the SE disk, while from the integrated spectra, we estimated a factor of two lower deuteration in the NW disk side ([D2CO]/[H2CO] ∼ 0.05, implying [D]/[H] ∼ 22%). The [D2CO]/[HDCO] abundance ratio varies between 0.3 and 0.7 in the SE disk side and in the outflow lobes. As shown in Fig. C.1, the [HDCO]/[H2CO] and [D2CO]/[H2CO] abundance ratios estimated in the Class I disk of IRS 63 are, on average, at the upper edge of the range of values estimated in prestellar cores (Chacón-Tanarro et al. 2019; Bacmann et al. 2003) and in Class 0 (Parise et al. 2006; Watanabe et al. 2012; Persson et al. 2018; Manigand et al. 2020; Evans et al. 2023) and Class I (Bianchi et al. 2017; Mercimek et al. 2022) protostars, and the ratios are in agreement with the only available upper limit obtained in a disk (Oph IRS48, van der Marel et al. 2021; Brunken et al. 2022). Moreover, the [HDCO]/[H2CO] abundance ratios in the outflow shocks driven by IRS 63 (∼ 0.1 − 0.3) are in agreement with those estimated in the L1157-B1 protostellar shock (∼0.1, Fontani et al. 2014).
4. Discussion
4.1. D2CO in the accretion and outflow shocks
Although H2CO has been routinely detected in disks (e.g., Garufi et al. 2021; Öberg et al. 2021), in outflows (e.g., Tychoniec et al. 2019; Evans et al. 2023), and also in a streamer (Valdivia-Mena et al. 2022), this is the first time that singly and doubly deuterated formaldehyde have been detected in a planet-forming disk and in the streamer that is feeding it. Interestingly, our observations show the following features in the distribution and abundance of HDCO and D2CO in IRS 63: (i) the spatial distribution of HDCO is similar to that of H2CO in the disk and in the streamer, pointing to a similar chemical origin of the two species; (ii) D2CO emission is detected only in the SE disk side where the streamer hits the disk and in the two spots along the outflow direction, hence in shocked regions; (iii) the [D2CO]/[H2CO] abundance ratio in the SE disk side hit by the streamer is ∼0.1, which is at the upper edge of the range of values estimated for prestellar cores and Class 0 and I protostars (see Fig. C.1).
The observed spatial distribution and abundance of D2CO could be due to the release of D2CO from the icy mantles of grains in the accretion shock, occurring when the streamer impacts onto the disk as well as in the shocks along the outflow. The release of molecular species from the ices in the accretion shock at the streamer-disk interface was first observed by Garufi et al. (2022) through enhanced SO and SO2 emission in the shocked disk region of HL Tau and DG Tau, and it was then observed by Bianchi et al. (2023) through HDO emission in SVS13-A. Flores et al. (2023) showed that the streamer feeds the disk of IRS 63 at a rate of ∼10−6 M⊙ yr−1, two orders of magnitude larger than the disk-to-star mass accretion rate. This suggests that the streamer may have a deep impact not only on the mass and kinematics of the disk but also on its chemical composition.
In the following section, we examine the different routes for the formation of HDCO and D2CO (either in the gas phase or on the grains). We use the different spatial distributions of these molecules to put constraints on their chemical origin and to verify the above-proposed scenario of D2CO-rich ices being released in shocked regions.
4.2. HDCO and D2CO chemistry
Formaldehyde can be formed in both the gas phase (mainly through the reaction CH3+O) and on the surfaces of the grain mantles (through hydrogenation of CO ices) (e.g., Willacy & Woods 2009). The scheme of the two routes forming HDCO is schematically summarized in Fig. 4. In the gas phase, deuterated formaldehyde is formed mainly via a chain of reactions starting from the CH ions, which after reacting with HD forms CH2D+ and eventually leads to HDCO (e.g., Roueff et al. 2007; Roberts & Millar 2007). The first reaction has an exothermicity of about 650 K (Roueff et al. 2013), and the reverse reactions do not occur at temperatures lower than about 70–80 K, enhancing the CH2D+/CH
 ratio. This occurs analogously to the enhancement of the H2D+/H
 ratio at temperatures ≤30 − 40 K (Ceccarelli et al. 2014). Theoretical models predict [HDCO]/[H2CO] ratios up to 0.2 (Bergman et al. 2011; Roueff et al. 2013), comparable to the values observed in the disk.
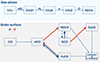 |
Fig. 4. Major routes of formation and destruction of HDCO in the gas phase (upper panel) and HDCO and D2CO on the grain surfaces (lower panel). In the latter, arrows identify the most important reactions involving H (blue) and D (red) atoms landing on the surface: direct additions (solid lines) and abstraction (dashed lines). Thick lines represent barrierless reactions, while thin lines are reactions presenting barriers (see text). |
On the other hand, gas-phase reactions are unable to reproduce the large [D2CO]/[HDCO] ratio inferred in the region where the streamer falls onto the disk (up to ∼0.7). In this case, the most reasonable explanation is that the large measured abundance of D2CO is due to its release in the gas phase from the grain mantles, where D2CO was formed in the prestellar phase or recently in the disk itself. Figure 4 shows the scheme for the formation of D2CO on the grain mantles, which occurs thanks to addition and abstraction reactions of H and D to and from frozen CO.
It is worth noticing the crucial importance of the abstraction reactions in the formation of D2CO. This was first noticed by experimental works (e.g., Hidaka et al. 2009) and astrochemical models (Taquet et al. 2012; Aikawa et al. 2012). Later, highly accurate theoretical calculations confirmed the importance of abstraction reactions on simulated amorphous water surfaces (AWSs) and the kinetic isotope effect (KIE) in the reactions with activation barriers (Song & Kästner 2017). However, to our best knowledge, theoretical calculations have only been carried out for the H (or D) + H2CO (or HDCO) → HCO + H2 (or HD), leaving the whole quantitative reaction scheme incomplete.
That said, D2CO is formed mainly from the DCO + D reaction, and thus, it uniquely depends on the DCO abundance, which is set by the HDCO abstraction reactions against the addition ones. Interestingly, the H abstraction of HDCO is always favored against the D abstraction so that even the H irradiation plays in favor of augmenting the DCO abundance and, consequently, also that of the D2CO. Based on the above-discussed grain surface chemistry, we suggest that the ices in the disk, as well as those delivered by the streamer, were exposed to an important flux of D atoms that formed HDCO, which was subsequently converted into D2CO due to the flux of H atoms. This caused an enhancement of the D2CO abundance (with respect to HDCO and H2CO) on the ices. The above-described enhancement of D2CO on the ices may have occurred in the cold prestellar phase and then inherited by the disk at the time of its formation, as well as through the streamer. In fact, previous studies have indicated an accumulation of dust with thick icy mantles in the central region of prestellar cores and almost complete freeze-out, which favors the formation of deuterated molecules on the ices (Ceccarelli et al. 2014; Caselli et al. 2022), and this is confirmed by the high [HDCO]/[H2CO] and [D2CO]/[H2CO] abundance ratios inferred in prestellar cores (see Fig. C.1). On the other hand, the same grain chemistry may also occur in the cold disk midplane. In both cases, the D2CO-enriched ice composition is released in the gas phase in the shocks driven by the accretion streamer and the outflow.
In light of the formation routes discussed above, we conclude the following. First, the widespread HDCO and H2CO emission in the disk and in the streamer (Fig. 2) can be explained by gas-phase reactions occurring in the warm disk molecular layers and in the streamer at temperatures of 40–50 K, where the main formation route of H2CO is CH3 + O and that of HDCO is CH2D + O (through the scheme presented in Fig. 4, upper panel). Therefore, both H2CO and HDCO probe material that is (at least partially) reprocessed in the disk and in the streamer. Second, D2CO, which is detected only in shocks (Fig. 2), probes the composition of the ices, which is set by grain surface chemistry occurring at low temperatures (Fig. 4, lower panel), that is, at the prestellar stage and in the disk midplane.
5. Conclusions
The ALMA observations of the Class I source IRS 63 in the context of the FAUST ALMA LP has allowed for the first detection of singly and doubly deuterated formaldehyde in a planet-forming disk and in the streamer that is feeding it. We observed a strong chemical asymmetry between the two disk sides. The spatial distribution of H2CO and HDCO in the disk and in the streamer is similar, while D2CO was detected only (i) in the SE disk side, where the streamer impacts on the disk, as well as (ii) in two spots along the outflow. The estimated deuterium fraction, [D]/[H], is ∼5 − 15% in HDCO and ∼22 − 32% in D2CO. The spatial distribution and the abundance of the detected species suggest that HDCO is mainly a gas-phase product (starting from the reaction CH + HD), while D2CO is formed on ices at the prestellar phase and/or in the disk itself through addition and abstraction reactions of H and D to and from frozen CO (e.g., Taquet et al. 2012). This explains why D2CO is observed only in shocked regions, either in the accretion shock produced by the streamer or in the outflow shocks, where the ices are sputtered, releasing D2CO in the gas phase. Our results indicate that streamers play a key role in setting the initial conditions for planet formation, as they can alter a disk’s physical and chemical properties.
Partition functions were taken from the CDMS (Müller et al. 2005), and they take into account a statistical ortho-to-para ratio of three for H2CO and two for D2CO.
Acknowledgments
This paper makes use of the following ALMA data: ADS/JAO.ALMA#2018.1.01205.L (PI: S. Yamamoto). ALMA is a partnership of the ESO (representing its member states), the NSF (USA) and NINS (Japan), together with the NRC (Canada) and the NSC and ASIAA (Taiwan), in cooperation with the Republic of Chile. The Joint ALMA Observatory is operated by the ESO, the AUI/NRAO, and the NAOJ. The project has received funding from the EC H2020 research and innovation programme for the project “Astro-Chemical Origins” (ACO, No 811312). LP, ClCo, and GS acknowledge the PRIN-MUR 2020 BEYOND-2p (Astrochemistry beyond the second period elements, Prot. 2020AFB3FX), the project ASI-Astrobiologia 2023 MIGLIORA (Modeling Chemical Complexity, F83C23000800005), the INAF-GO 2023 fundings PROTO-SKA (Exploiting ALMA data to study planet forming disks: preparing the advent of SKA, C13C23000770005), the INAF Mini-Grant 2022 “Chemical Origins” (PI: L. Podio), and the INAF-Minigrant 2023 TRIESTE (“TRacing the chemIcal hEritage of our originS: from proTostars to plan- Ets”; PI: G. Sabatini). LP, and ClCo also acknowledge financial support under the National Recovery and Resilience Plan (NRRP), Mission 4, Component 2, Investment 1.1, Call for tender No. 104 published on 2.2.2022 by the Italian Ministry of University and Research (MUR), funded by the European Union – NextGenerationEU-Project Title 2022JC2Y93 Chemical Origins: linking the fossil composition of the Solar System with the chemistry of protoplanetary disks – CUP J53D23001600006 – Grant Assignment Decree No. 962 adopted on 30.06.2023 by the Italian Ministry of Ministry of University and Research (MUR). M.B. acknowledges support from the European Research Council (ERC) Advanced Grant MOPPEX 833460. S.N. is grateful for support from MEXT/JSPS Grants-in-Aid for Scientific Research (KAKENHI) grant Nos. JP20H05844, JP20H05845. and JP20H05645. E.B aknowledges the Deutsche Forschungsgemeinschaft (DFG, German Research Foundation) under Germany Excellence Strategy – EXC 2094 – 390783311. L.L. acknowledges the support of DGAPA PAPIIT grants IN108324 and IN112820 and CONACyT-CF grant 263356. This project has received funding from the European Research Council (ERC) under the European Union Horizon Europe research and innovation program (grant agreement No. 101042275, project Stellar-MADE). SBC was supported by the NASA Planetary Science Division Internal Scientist Funding Program through the Fundamental Laboratory Research work package (FLaRe). D.J. is supported by NRC Canada and by an NSERC Discovery Grant. I.J-.S acknowledges funding from grant No. PID2022-136814NB-I00 funded by MICIU/AEI/ 10.13039/501100011033 and by “ERDF/EU”. Y.A acknowledges the support by NAOJ ALMA Scientific Research Grant code 2019-13B.
References
- Aikawa, Y., Wakelam, V., Hersant, F., Garrod, R. T., & Herbst, E. 2012, ApJ, 760, 40 [NASA ADS] [CrossRef] [Google Scholar]
- ALMA Partnership, Brogan, C. L., Pérez, L. M., et al. 2015, ApJ, 808, L3 [Google Scholar]
- Bacmann, A., Lefloch, B., Ceccarelli, C., et al. 2003, ApJ, 585, L55 [NASA ADS] [CrossRef] [Google Scholar]
- Bergman, P., Parise, B., Liseau, R., & Larsson, B. 2011, A&A, 527, A39 [NASA ADS] [CrossRef] [EDP Sciences] [Google Scholar]
- Bianchi, E., Codella, C., Ceccarelli, C., et al. 2017, MNRAS, 467, 3011 [NASA ADS] [CrossRef] [Google Scholar]
- Bianchi, E., López-Sepulcre, A., Ceccarelli, C., et al. 2022, ApJ, 928, L3 [NASA ADS] [CrossRef] [Google Scholar]
- Bianchi, E., López-Sepulcre, A., Ceccarelli, C., et al. 2023, Farad. Disc., 245, 164 [NASA ADS] [CrossRef] [Google Scholar]
- Brunken, N. G. C., Booth, A. S., Leemker, M., et al. 2022, A&A, 659, A29 [NASA ADS] [CrossRef] [EDP Sciences] [Google Scholar]
- Cacciapuoti, L., Macias, E., Gupta, A., et al. 2024, A&A, 682, A61 [NASA ADS] [CrossRef] [EDP Sciences] [Google Scholar]
- Caselli, P., & Ceccarelli, C. 2012, A&ARv, 20, 56 [Google Scholar]
- Caselli, P., Pineda, J. E., Sipilä, O., et al. 2022, ApJ, 929, 13 [NASA ADS] [CrossRef] [Google Scholar]
- Ceccarelli, C., Caselli, P., Bockelée-Morvan, D., et al. 2014, in Protostars and Planets VI, eds. H. Beuther, R. S. Klessen, C. P. Dullemond, T. Henning, et al., 859 [Google Scholar]
- Chacón-Tanarro, A., Caselli, P., Bizzocchi, L., et al. 2019, A&A, 622, A141 [Google Scholar]
- Codella, C., Ceccarelli, C., Chandler, C., et al. 2021, Front. Astron. Space Sci., 8, 227 [NASA ADS] [CrossRef] [Google Scholar]
- Codella, C., Podio, L., De Simone, M., et al. 2024, MNRAS, 528, 7383 [NASA ADS] [CrossRef] [Google Scholar]
- Evans, L., Vastel, C., Fontani, F., et al. 2023, A&A, 678, A160 [NASA ADS] [CrossRef] [EDP Sciences] [Google Scholar]
- Flores, C., Ohashi, N., Tobin, J. J., et al. 2023, ApJ, 958, 98 [NASA ADS] [CrossRef] [Google Scholar]
- Fontani, F., Codella, C., Ceccarelli, C., et al. 2014, ApJ, 788, L43 [Google Scholar]
- Garufi, A., Podio, L., Codella, C., et al. 2021, A&A, 645, A145 [EDP Sciences] [Google Scholar]
- Garufi, A., Podio, L., Codella, C., et al. 2022, A&A, 658, A104 [CrossRef] [EDP Sciences] [Google Scholar]
- Harsono, D., Bjerkeli, P., van der Wiel, M. H. D., et al. 2018, Nat. Astron., 2, 646 [Google Scholar]
- Hidaka, H., Watanabe, M., Kouchi, A., & Watanabe, N. 2009, ApJ, 702, 291 [NASA ADS] [CrossRef] [Google Scholar]
- Jensen, S. S., Jørgensen, J. K., Kristensen, L. E., et al. 2021, A&A, 650, A172 [EDP Sciences] [Google Scholar]
- Manigand, S., Calcutt, H., Jørgensen, J. K., et al. 2019, A&A, 623, A69 [NASA ADS] [CrossRef] [EDP Sciences] [Google Scholar]
- Manigand, S., Jørgensen, J. K., Calcutt, H., et al. 2020, A&A, 635, A48 [NASA ADS] [CrossRef] [EDP Sciences] [Google Scholar]
- Maureira, M. J., Gong, M., Pineda, J. E., et al. 2022, ApJ, 941, L23 [NASA ADS] [CrossRef] [Google Scholar]
- Mercimek, S., Codella, C., Podio, L., et al. 2022, A&A, 659, A67 [NASA ADS] [CrossRef] [EDP Sciences] [Google Scholar]
- Mercimek, S., Podio, L., Codella, C., et al. 2023, MNRAS, 522, 2384 [NASA ADS] [CrossRef] [Google Scholar]
- Miotello, A., Testi, L., Lodato, G., et al. 2014, A&A, 567, A32 [NASA ADS] [CrossRef] [EDP Sciences] [Google Scholar]
- Müller, H. S. P., Schlöder, F., Stutzki, J., & Winnewisser, G. 2005, J. Mol. Struct., 742, 215 [Google Scholar]
- Öberg, K. I., Guzmán, V. V., Walsh, C., et al. 2021, ApJS, 257, 1 [CrossRef] [Google Scholar]
- Ortiz-León, G. N., Loinard, L., Dzib, S. A., et al. 2018, ApJ, 865, 73 [Google Scholar]
- Parise, B., Ceccarelli, C., Tielens, A. G. G. M., et al. 2006, A&A, 453, 949 [NASA ADS] [CrossRef] [EDP Sciences] [Google Scholar]
- Persson, M. V., Jørgensen, J. K., Müller, H. S. P., et al. 2018, A&A, 610, A54 [NASA ADS] [CrossRef] [EDP Sciences] [Google Scholar]
- Pineda, J. E., Segura-Cox, D., Caselli, P., et al. 2020, Nat. Astron., 4, 1158 [NASA ADS] [CrossRef] [Google Scholar]
- Pineda, J. E., Arzoumanian, D., Andre, P., et al. 2023, in Protostars and Planets VII, eds. S. Inutsuka, Y. Aikawa, T. Muto, K. Tomida, M. Tamura, et al., ASP Conf. Ser., 534, 233 [NASA ADS] [Google Scholar]
- Roberts, H., & Millar, T. J. 2007, A&A, 471, 849 [NASA ADS] [CrossRef] [EDP Sciences] [Google Scholar]
- Roueff, E., Parise, B., & Herbst, E. 2007, A&A, 464, 245 [NASA ADS] [CrossRef] [EDP Sciences] [Google Scholar]
- Roueff, E., Gerin, M., Lis, D. C., et al. 2013, J. Phys. Chem. A, 117, 9959 [Google Scholar]
- Sabatini, G., Podio, L., Codella, C., et al. 2024, A&A, 684, L12 [NASA ADS] [CrossRef] [EDP Sciences] [Google Scholar]
- Segura-Cox, D. M., Schmiedeke, A., Pineda, J. E., et al. 2020, Nature, 586, 228 [NASA ADS] [CrossRef] [Google Scholar]
- Sheehan, P. D., & Eisner, J. A. 2018, ApJ, 857, 18 [NASA ADS] [CrossRef] [Google Scholar]
- Song, L., & Kästner, J. 2017, ApJ, 850, 118 [NASA ADS] [CrossRef] [Google Scholar]
- Taquet, V., Ceccarelli, C., & Kahane, C. 2012, ApJ, 748, L3 [Google Scholar]
- Tychoniec, Ł., Hull, C. L. H., Kristensen, L. E., et al. 2019, A&A, 632, A101 [NASA ADS] [CrossRef] [EDP Sciences] [Google Scholar]
- Valdivia-Mena, M. T., Pineda, J. E., Segura-Cox, D. M., et al. 2022, A&A, 667, A12 [NASA ADS] [CrossRef] [EDP Sciences] [Google Scholar]
- Valdivia-Mena, M. T., Pineda, J. E., Segura-Cox, D. M., et al. 2023, A&A, 677, A92 [NASA ADS] [CrossRef] [EDP Sciences] [Google Scholar]
- van der Marel, N., Booth, A. S., Leemker, M., van Dishoeck, E. F., & Ohashi, S. 2021, A&A, 651, L5 [NASA ADS] [CrossRef] [EDP Sciences] [Google Scholar]
- Watanabe, Y., Sakai, N., Lindberg, J. E., et al. 2012, ApJ, 745, 126 [NASA ADS] [CrossRef] [Google Scholar]
- Willacy, K., & Woods, P. M. 2009, ApJ, 703, 479 [NASA ADS] [CrossRef] [Google Scholar]
Channel maps
Channel maps of H2CO 218.22 GHz, HDCO 246.92 GHz, and D2CO 231.41 GHz toward IRS 63 are shown in Figs. A.2, A.3, and A.4. Channels maps of H2CO on a larger area of 10″ × 15″ are shown in Fig. A.1 to show emission from the large scale streamer. The channel width is different for each line, as reported in Table 1.
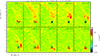 |
Fig. A.1. Zoom-out of H2CO 218.22 GHz in the channels at VLSR = [ + 1.79, +3.3] km s−1 to show the emission by the large scale streamer. The black contours show the continuum emission at 1.3 mm (contours from 10σ with steps of 500σ, with σ = 0.7 mJy beam−1). In each panel the velocity, VLSR, is indicated on the top-right (channel width of 0.168 km s−1 channel). The beam and the wedge of the color scale are drawn in the last channel. |
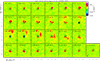 |
Fig. A.2. Channel maps of H2CO 218.22 GHz emission toward IRS 63. The black contours show the continuum emission at 1.3 mm (contours from 10σ with steps of 500σ, with σ = 0.7 mJy beam−1). In each panel the velocity, VLSR, is indicated on the top-left (channel width of 0.168 km s−1 channel). The wedge and the beam are drawn in the last channel of the first and last row, respectively. |
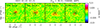 |
Fig. A.3. Channel maps of HDCO 246.92 GHz emission toward IRS 63. The black contours show the continuum emission at 1.3 mm (contours from 10σ with steps of 500σ, with σ = 0.7 mJy beam−1). The scale of the wedge is in Jy beam−1. In each panel the velocity, VLSR, is indicated on the top-left (channel width of 1.19 km s−1 channel). The beam and the wedge of the color scale are drawn in the last channel. |
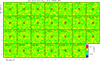 |
Fig. A.4. Channel maps of D2CO 231.41 GHz emission toward IRS 63. The black contours show the continuum emission at 1.3 mm (contours from 10σ with steps of 500σ, with σ = 0.7 mJy beam−1). The scale of the wedge is in Jy beam−1. In each panel the velocity, VLSR, is indicated on the top-left (channel width of 0.158 km s−1 channel). The beam and the wedge of the color scale are drawn in the last channel. |
Integrated spectra
In Fig. B.1 we show the spectra of H2CO, HDCO, and D2CO transitions integrated on the entire disk (out to a radius of  , i.e. 187 au), on the SE and NW disk side.
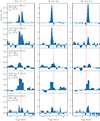 |
Fig. B.1. Spectra of the H2CO, HDCO, and D2CO lines integrated: on the entire disk (out to a radius of |

Abundance and [D]/[H] ratios from prestellar cores to disks
Figure C.1 compares the [HDCO]/[H2CO] and [D2CO]/[H2CO] abundance ratios, and corresponding [D]/[H], in the Class I disk of IRS 63 with the values previously estimated for sources at different evolutionary stages, from prestellar cores, to Class 0 and I protostars and disks. The corresponding source names are labeled in the figure and the references are given in the caption.
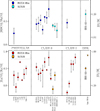 |
Fig. C.1. Abundance ratios [HDCO]/[H2CO] (upper panel), and [D2CO]/[H2CO] (lower panel) estimated in prestellar cores (Chacón-Tanarro et al. 2019; Bacmann et al. 2003), in Class 0 (Parise et al. 2006; Watanabe et al. 2012; Persson et al. 2018; Manigand et al. 2020; Evans et al. 2023) and Class I (Bianchi et al. 2017; Mercimek et al. 2022) protostars, and in disks (van der Marel et al. 2021; Brunken et al. 2022), are compared with the values estimated in the disk of IRS 63 (this work). Blue and red circles indicate estimates obtained with IRAM-30m observations (with the exception of RCrA-IRS7B which is observed with ASTE-10m), while cyan and orange squares those obtained with ALMA. Upper limits are marked with triangles. In both panels the right y-axes indicate the corresponding [D]/[H] ratios. The source names are below the bottom panel. |
All Tables
All Figures
|
Fig. 1. Streamer and disk of IRS 63 as probed by p-H2CO 3(0, 3)−2(0, 2), HDCO 4(1, 4)−3(1, 3), and o-D2CO 4(0, 4)−3(0, 3). From left to right: Panels A and B show the moment 0 and moment 1 maps of the H2CO emission. Panels C, D, and E show a zoom-in of H2CO, HDCO, and D2CO integrated intensity on the blueshifted velocity range [+2.0, +2.6] km s−1, which probes the terminal portion of the streamer impacting onto the disk. The map of HDCO covers a larger velocity range [+1.4, +2.6] km s−1 due to the larger channel width of the line cube (1.19 km s−1). The first contours and steps correspond to 3σ (0.5 mJy beam−1 km s−1). |
| In the text | |
|
Fig. 2. Zoom-in of the integrated intensity (moment 0, upper panels) and intensity weighted velocity (moment 1, lower panels) maps of the H2CO, HDCO, and D2CO line emission toward the IRS 63 disk (same transitions as in Fig. 1). The continuum emission at 1.3 mm is in black (contours from 10σ with steps of 500σ, with σ = 0.7 mJy beam−1). The transition and upper-level energy are labeled at the top, and the beam is shown in the lower left of each panel. |
| In the text | |
|
Fig. 3. Maps of column densities and abundance ratios toward IRS 63. Upper panels: Column density maps of H2CO, HDCO, and D2CO derived assuming LTE and optically thin emission at the temperature derived from the HDCO lines (Tex = 45 K). Lower panels: Maps of the abundance ratios [D2CO]/[HDCO], [HDCO]/[H2CO], and [D2CO]/[H2CO]. The continuum emission at 1.3 mm is in black (contours from 10σ with steps of 500σ, with σ = 0.7 mJy beam−1). |
| In the text | |
|
Fig. 4. Major routes of formation and destruction of HDCO in the gas phase (upper panel) and HDCO and D2CO on the grain surfaces (lower panel). In the latter, arrows identify the most important reactions involving H (blue) and D (red) atoms landing on the surface: direct additions (solid lines) and abstraction (dashed lines). Thick lines represent barrierless reactions, while thin lines are reactions presenting barriers (see text). |
| In the text | |
|
Fig. A.1. Zoom-out of H2CO 218.22 GHz in the channels at VLSR = [ + 1.79, +3.3] km s−1 to show the emission by the large scale streamer. The black contours show the continuum emission at 1.3 mm (contours from 10σ with steps of 500σ, with σ = 0.7 mJy beam−1). In each panel the velocity, VLSR, is indicated on the top-right (channel width of 0.168 km s−1 channel). The beam and the wedge of the color scale are drawn in the last channel. |
| In the text | |
|
Fig. A.2. Channel maps of H2CO 218.22 GHz emission toward IRS 63. The black contours show the continuum emission at 1.3 mm (contours from 10σ with steps of 500σ, with σ = 0.7 mJy beam−1). In each panel the velocity, VLSR, is indicated on the top-left (channel width of 0.168 km s−1 channel). The wedge and the beam are drawn in the last channel of the first and last row, respectively. |
| In the text | |
|
Fig. A.3. Channel maps of HDCO 246.92 GHz emission toward IRS 63. The black contours show the continuum emission at 1.3 mm (contours from 10σ with steps of 500σ, with σ = 0.7 mJy beam−1). The scale of the wedge is in Jy beam−1. In each panel the velocity, VLSR, is indicated on the top-left (channel width of 1.19 km s−1 channel). The beam and the wedge of the color scale are drawn in the last channel. |
| In the text | |
|
Fig. A.4. Channel maps of D2CO 231.41 GHz emission toward IRS 63. The black contours show the continuum emission at 1.3 mm (contours from 10σ with steps of 500σ, with σ = 0.7 mJy beam−1). The scale of the wedge is in Jy beam−1. In each panel the velocity, VLSR, is indicated on the top-left (channel width of 0.158 km s−1 channel). The beam and the wedge of the color scale are drawn in the last channel. |
| In the text | |
|
Fig. B.1. Spectra of the H2CO, HDCO, and D2CO lines integrated: on the entire disk (out to a radius of |
| In the text | |
|
Fig. C.1. Abundance ratios [HDCO]/[H2CO] (upper panel), and [D2CO]/[H2CO] (lower panel) estimated in prestellar cores (Chacón-Tanarro et al. 2019; Bacmann et al. 2003), in Class 0 (Parise et al. 2006; Watanabe et al. 2012; Persson et al. 2018; Manigand et al. 2020; Evans et al. 2023) and Class I (Bianchi et al. 2017; Mercimek et al. 2022) protostars, and in disks (van der Marel et al. 2021; Brunken et al. 2022), are compared with the values estimated in the disk of IRS 63 (this work). Blue and red circles indicate estimates obtained with IRAM-30m observations (with the exception of RCrA-IRS7B which is observed with ASTE-10m), while cyan and orange squares those obtained with ALMA. Upper limits are marked with triangles. In both panels the right y-axes indicate the corresponding [D]/[H] ratios. The source names are below the bottom panel. |
| In the text | |
Current usage metrics show cumulative count of Article Views (full-text article views including HTML views, PDF and ePub downloads, according to the available data) and Abstracts Views on Vision4Press platform.
Data correspond to usage on the plateform after 2015. The current usage metrics is available 48-96 hours after online publication and is updated daily on week days.
Initial download of the metrics may take a while.