Fig. 3.
Download original image
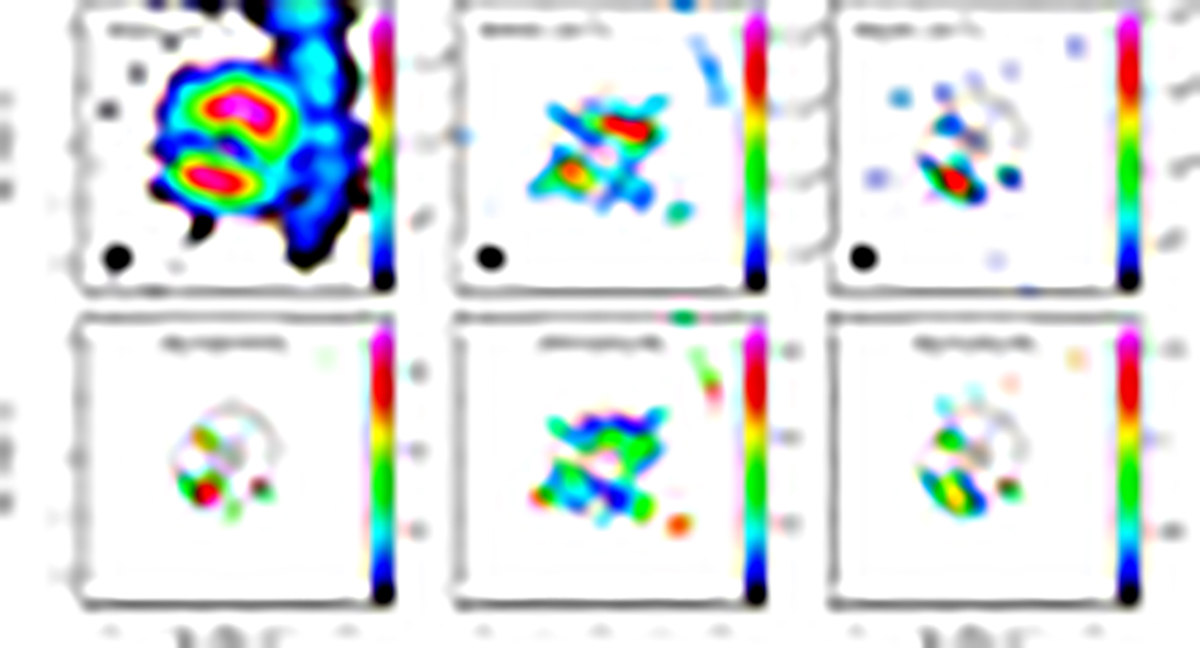
Maps of column densities and abundance ratios toward IRS 63. Upper panels: Column density maps of H2CO, HDCO, and D2CO derived assuming LTE and optically thin emission at the temperature derived from the HDCO lines (Tex = 45 K). Lower panels: Maps of the abundance ratios [D2CO]/[HDCO], [HDCO]/[H2CO], and [D2CO]/[H2CO]. The continuum emission at 1.3 mm is in black (contours from 10σ with steps of 500σ, with σ = 0.7 mJy beam−1).
Current usage metrics show cumulative count of Article Views (full-text article views including HTML views, PDF and ePub downloads, according to the available data) and Abstracts Views on Vision4Press platform.
Data correspond to usage on the plateform after 2015. The current usage metrics is available 48-96 hours after online publication and is updated daily on week days.
Initial download of the metrics may take a while.