| Issue |
A&A
Volume 696, April 2025
|
|
|---|---|---|
| Article Number | A18 | |
| Number of page(s) | 19 | |
| Section | Interstellar and circumstellar matter | |
| DOI | https://doi.org/10.1051/0004-6361/202451487 | |
| Published online | 01 April 2025 | |
The hot corino-like chemistry of four FUor-like protostars
1
Institut de Recherche en Astrophysique et Planétologie, Université de Toulouse, OMP, CNRS, CNES,
9 av. du Colonel Roche,
31028,
Toulouse Cedex 4, France
2
Konkoly Observatory, HUN-REN Research Centre for Astronomy and Earth Sciences, MTA Centre of Excellence,
Konkoly-Thege Miklós út 15–17,
1121
Budapest, Hungary
3
Institute of Physics and Astronomy, ELTE Eötvös Loránd University,
Pázmány Péter sétány 1/A,
1117
Budapest,
Hungary
4
Max Planck Institute for Astronomy,
Königstuhl 17,
69117
Heidelberg, Germany
5
Institute for Astronomy (IfA), University of Vienna,
Türkenschanzstrasse 17,
1180
Vienna, Austria
6
Laboratoire d’astrophysique de Bordeaux, Univ. Bordeaux, CNRS, B18N, allée Geoffroy Saint-Hilaire,
33615
Pessac,
France
★ Corresponding author; This email address is being protected from spambots. You need JavaScript enabled to view it.
Received:
12
July
2024
Accepted:
26
February
2025
Abstract
Context. Compared to Class 0 protostars, the higher densities and lower temperatures of the disk midplanes of Class I young stellar objects (YSOs) limit the detectability of complex organic molecules (COMs). The elevated luminosities of eruptive YSOs increase disk temperatures causing frozen molecules to sublimate, thus making them easier to detect.
Aims. Our aim is to investigate the chemical composition of four FUor-like Class I YSOs (L1551 IRS 5, Haro 5a IRS, V346 Nor, and OO Ser) and to compare their abundances of COMs with other YSOs in the literature.
Methods. We searched for COMs line emission in ALMA Band 6 observations. We used the CASSIS software to determine their column densities (N) and excitation temperatures (Tex) assuming local thermodynamical equilibrium.
Results. We detected 249 transitions from 12 COMs. In L1551 IRS 5 we identified CH3OH, 13CH3OH, CH318OH, CH2DOH, CH3CHO, CH3OCH3, CH3OCHO, CH3COCH3, C2H5OH, C2H5CN, 13CH3CN, and CH3C15N. Haro 5a IRS and OO Ser have emission from CH3OH, CH3CHO, CH3OCH3 , and CH3 OCHO. CH3COCH3 is also detected in OO Ser. In V346 Nor we found CH3OH, CH2DOH, CH3CHO, CH3OCH3 , CH3OCHO, and C2H5CN. The emission of COMs is compact in all targets. The analysis indicates that their temperatures are above 100 K. The abundance ratios of COMs derived for these eruptive YSOs, and for other protostars in the literature, span several orders of magnitude without any clear differentiation between the eruptive and quiescent YSOs. The column density of the main isotopolog of CH3 OH should not be used as a reference, as most of the lines are optically thick.
Conclusions. The hot and compact emission of COMs indicates that the four FUor-like targets are hot corino-like. Spectral studies of these objects can be useful for investigating the complex organic chemistry at later evolutionary stages than the usual Class 0 stage.
Key words: astrochemistry / protoplanetary disks / stars: formation / stars: protostars / ISM: molecules
© The Authors 2025
 Open Access article, published by EDP Sciences, under the terms of the Creative Commons Attribution License (https://creativecommons.org/licenses/by/4.0), which permits unrestricted use, distribution, and reproduction in any medium, provided the original work is properly cited.
This article is published in open access under the Subscribe to Open model. This email address is being protected from spambots. You need JavaScript enabled to view it. to support open access publication.
1 Introduction
Recent results have proposed that planets start forming in the early stages of protostellar evolution when the young stellar objects (YSOs) are still deeply embedded in their envelopes (e.g., Drążkowska et al. 2023). The chemical composition of these planets is expected to be inherited from the protoplane- tary disks in which they are forming. Part of this composition is dictated by the presence of complex organic molecules (COMs). These are molecules composed of at least six atoms, of which at least one is carbon; they are the precursors of more complex pre-biotic species (Herbst & van Dishoeck 2009). During the early stages of the star formation process, when the temperatures are more elevated due to the higher mass accretion rates, COMs are more easily detected as they are still in the gas phase. In the case of low-mass protostars, the compact regions in which COMs are abundant in the gas phase are called hot corinos (Ceccarelli 2004). Hot corinos have been detected in both Class 0 and Class I sources (e.g., Cazaux et al. 2003; Bottinelli et al. 2004; Bergner et al. 2019; Bianchi et al. 2019). However, the more evolved Class I protostars have lower COM detection rates (Artur de la Villarmois et al. 2019; Yang et al. 2022). This lack of detections can be attributed to a combination of a lower temperature, a smaller hot region, and a lower envelope density (van’t Hoff et al. 2020; Hsu et al. 2023).
FU Orionis-type stars (FUors) are young stellar objects that experience a sudden increase in their mass accretion rate of 2 to 5 orders of magnitude, reaching values as high as 10−4 M⊙ year−1. Fischer et al. (2022) presented the most recent review of eruptive young stars, including FUors. This surge of the mass accretion rate is reflected as an increase in the accretion luminosity such that the bolometric luminosity of the protostar is then dominated by it. During this state of elevated accretion luminosity, the temperatures within ~10 au from the protostar rise to >100 K (e.g., FU Ori and V883 Ori; Lykou et al. 2022; Bourdarot et al. 2023; Alarcón et al. 2024), so that the protostellar disks and the envelope undergo detectable changes in their physical, mineralogical and chemical properties (e.g., Molyarova et al. 2018; Tobin et al. 2023; Zwicky et al. 2024). In particular, the increase in temperature causes the desorption of molecules that were frozen on the dust grains in the system.
Theoretical works have studied the effects of these outbursts, including the estimation of the changes in the abundances and distribution of molecules throughout the FUor envelopes and disks. Taquet et al. (2016) studied the changes in the abundances of dimethyl ether (CH3OCH3) and methyl formate (CH3OCHO) out to envelope scales, and found that during a FUor-type outburst the abundances of these molecules with respect to methanol (CH3OH) should be a factor of a few higher than pre- or post-outburst. Molyarova et al. (2018) modeled the changes in the protostellar disk during and after a FUor-type outburst, and found that the abundances of several molecules (including some COMs) can increase by ∼3–8 orders of magnitude during the outburst and remain elevated between 20 and 120 years after the protostar has returned to its quiescent state. Zwicky et al. (2024) carried out a similar study to estimate the impact of these powerful accretion events and found a subset of molecules (e.g., N2H+, C18O, H2CO and HCN) that can be used as tracers of previous outbursts.
Interferometric observations have resulted in detections of multiple COMs in the disks of five eruptive young stars: SVS13-A (Bianchi et al. 2017a, 2019, 2022b), V883 Ori (van’t Hoff et al. 2018; Lee et al. 2019; Yamato et al. 2024), L1551 IRS 5 (Bianchi et al. 2020), HOPS 373W (Lee et al. 2023), and B335 (Lee et al. 2025). SVS13-A (also known as V512 Per) is a Class I YSO that underwent a ΔK ~ 1.5 mag brightening in 1990 and has been fading since then (Eisloeffel et al. 1991; Hodapp & Chini 2014). Based on the amplitude of its brightening and on its optical/near-infrared spectrum, it was first classified as an EX Lupi-type outbursting young star (EXor). However, the length of the accretion outburst (> 30 years) is vastly longer than what is expected in EXors (≲1 year), and instead its duration is more comparable to that of FUor-type outbursts. The COMs detected around SVS13-A are CH3CHO, CH3OCHO, CH3OCH3 , C2H5OH, NH2CHO, CH3CN, CH2DCN, and HCOCH2OH (De Simone et al. 2017; Bianchi et al. 2019, 2022a,b). V883 Ori is a Class I young eruptive star located in Orion, and is classified as FUor-like. This classification means that the brightening due to the accretion outburst was not detected, but the protostar presents the near-infrared spectroscopic signatures typical of FUors (Connelley & Reipurth 2018). The molecules detected in V883 Ori are CH3OH, CH2DOH, 13CH3OH, CH3CHO, 13CH3CHO, CH3OCHO, CH3O13CHO, 13CH3OCHO, CH2DOCHO, CH3OCDO, CH3OCH3, CH3COCH3, CH3CN, c-C2H4O, t-HCOOH, t- C2H3CHO, s-C2H5CHO, and CH3SH (van’t Hoff et al. 2018; Lee et al. 2019; Yamato et al. 2024). HOPS 373W is a young protostar in Orion that experienced a brief outburst in 2019 and began another accretion event in 2020 (Yoon et al. 2022). Lee et al. (2023) observed HOPS 373W with Band 7 of the Atacama Large Millimeter Array (ALMA). They identified multiple COMs including CH3OH and several deuterated forms of it, CH3CHO, CH3OCHO, C2H5OH, CH3CN, and HCOCH2OH. B335 is a Class 0 protostar that experienced a burst between 2010/2012 and 2023, detected only at mid- and far-infrared wavelengths. Lee et al. (2025) examined four epochs of ALMA data to study the changes in the column densities of 13CH3OH, CH2DOH, CH3OCHO, C2H5OH, HC(O)NH2, and DC(O)NH2. L1551 IRS 5 is one of the FUor-type eruptive young stars that we focus on during this paper and is described in detail below.
In this paper, we present a chemical study of four FUor- like eruptive young stars, L1551 IRS 5, Haro 5a IRS, OO Ser, and V346 Nor, using ALMA Band 6 observations. L1551 IRS 5 is a Class I protobinary system located in the Taurus starforming region at a distance of 147 pc from the Sun with a bolometric luminosity (Lbol) of 40 L⊙ (Liseau et al. 2005). The northern star is more massive and luminous that the southern one (Liseau et al. 2005). The separation between the two protostars is 50 au. Their circumstellar disks have radii <10 au; both disks are more massive than those of typical young stellar objects (Lim et al. 2016; Cruz-Sáenz de Miera et al. 2019; Kóspál et al. 2021). L1551 IRS 5 also contains a ∼140 au circumbinary ring which is less massive than the two proto- stellar disks and has a slightly different inclination angle (Lim et al. 2016; Cruz-Sáenz de Miera et al. 2019; Takakuwa et al. 2020). Using ALMA Band 6 observations, Bianchi et al. (2020) detected three COMs toward this target: methanol (CH3OH, 13CH3OH, and CH2DOH), methyl formate (HCOOCH3), and ethanol (CH3CH2OH). Their beam size was not sufficient to resolve the two components of the system. However, using the methanol emission, they found differences in the systemic velocities (∼3 km s−1) along the length of the system in the north- to-south direction. Andreu et al. (2023) observed HDO and H218O in L1551 IRS 5, and while their Northern Extended Millimetre Array (NOEMA) observations also did not resolve the protobinary, they showed a comparable difference in velocities. Takakuwa et al. (2020) resolved the protobinary using ALMA Band 7 observations of C18O. They confirmed that the difference in velocities is due to a combination of the difference in radial velocities between the two protostars and the velocity gradient due to the disk rotations. Mercimek et al. (2022) observed L1551 IRS 5 using the Institut de radioastronomie millimétrique (IRAM) 30 m antenna, and covering two spectral windows: one between 214.5 and 222.2 GHz, and another between 230.2 and 238.0 GHz (i.e., ∼1 mm in wavelength). They identified 33 different species in the spectrum of L1551 IRS 5, including six COMs: CH3OH, CH2DOH, CH3CN, CH3CCH, CH3CHO, and CH3OCHO. Marchand et al. (2024) also used the 30 m telescope to observe L1551 IRS 5 at 2mm and 3 mm. The authors identified emission lines of 75 different species, including ten COMs: CH3OH, CH2DOH, CH3CHO, CH3OCH3, CH3OCHO, CH3CN, l-C4H2, CH3CCH, CH2DCCH, and HC5N. Although their angular resolution was not enough to resolve the protostel- lar disks from the envelope, they found that some species have two components at two different temperatures (10 K and >30 K) that trace the cold envelope and the warmer emission close to the protostars.
For the other three FUor-like sources, this is the first study delving into the chemistry of their disks. Haro 5a IRS is a Class I protostar at a distance of 391 pc in Orion with Lbol = 50 L⊙ (Reipurth & Aspin 1997), and it has a weaker companion with a separation of 0.70″ to the southwest (Tobin et al. 2020; Kóspál et al. 2021). Haro 5a IRS and its companion have dust disk radii of 39 au and 34au (Kóspál et al. 2021). V346 Nor is a Class 0/I in the Norma star-forming region with a distance of 700 pc with Lbol = 160 L⊙ (Kóspál et al. 2017), whose outburst began before 1978. In 2010 V346 Nor dimmed suddenly; however, after a few months in quiescence, it began to brighten again, indicating the onset of a new outburst (Kraus et al. 2016; Kóspál et al. 2020). OO Ser is a Class I protostar located in the Serpens NW starforming region, with a distance of 438 pc. Its outburst began sometime between 1991 and 1994, and it started dimming after reaching its peak brightness in late 1995 (Kóspál et al. 2007; Hodapp et al. 2012). Kóspál et al. (2007) calculated the preoutburst and outburst bolometric luminosities of OO Ser, which, after we adjusted them to the assumed distance of 438 pc, are 9 and 70 L⊙ , respectively. ALMA observations revealed that its dust disk has a radius of 26 au (Kóspál et al. 2021).
We present the ALMA observations and the data reduction in Sect. 2. The resulting spectra and moment maps are shown in Sect. 3. In Sects. 4 and 5, we present the analysis and the discussion. Finally, we present our conclusions in Sect. 6.
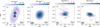 |
Fig. 1 Continuum maps of the four FUor sources at 1.33 mm. In all panels the cross markers indicate the continuum peaks, i.e., the positions of the protostars, and the square markers indicate the pixels used to extract the spectra. In the case of L1551 IRS 5, the diamond markers indicate the positions of the alternative pixels used to examine potential spatial changes of the abundances (see Sect. 5.5). Panel a shows the map of L1551 IRS 5 centered on the position between the two protostars. The contours are at 8, 18, 44, 105, and 250σ with σ = 0.37 mJy beam−1. Panel b is the map of Haro 5a IRS with contours at 5, 12, 30, 75, and 186σ with σ = 0.22 mJy beam−1. Panel c is V346 Nor with contours at 5, 10, 23, 49, and 106σ with σ = 0.05 mJy beam−1. Panel d shows OO Ser with contours at 5, 12, 30, 75, and 186σ with σ = 0.22 mJy beam−1. |
2 Observations
The four FUor-like sources were observed as part of the ALMA program 2016.1.00209.S (PI: Takami) in Cycle 4. The four targets were observed using ALMA’s 7m array plus two extended configurations (C40-3 and C40-6) resulting in baseline ranges between 8 m and ~3650 m. The four targets had similar integration times. For L1551 IRS 5 these were 4.6, 3.6, and 11.3 minutes for the 7m, C40-3, and C40-6 arrays, respectively. In the case of Haro 5a IRS these were 4.1, 3.1, and 9.3 minutes, respectively, with the 7m and C40-6 observations being repeated due to weather conditions. For V346 Nor and OO Ser the integration times were 4.1, 3.1, and 9.8 minutes for the three arrays. In the case of OO Ser, the 7m array observations were also repeated. The dates of the observations and other details can be found in Table 1 of Kóspál et al. (2021). Data were taken in Band 6, with three spectral windows centered at the 12CO, 13CO, and C18O J = 2 − 1 lines, and two spectral windows of 1875 MHz bandwidth each, centered at 216.9 GHz and 232.2 GHz. These latter two spectral windows are the focus of this work. They were taken at a spectral resolution of ~0.490 MHz, i.e., 0.677 km s−1 and 0.633 km s−1.
The data sets were calibrated using Common Astronomy Software Applications (CASA) v.5.1.1 (McMullin et al. 2007). We carried out self-calibration for both the visibility phases and amplitudes to improve the signal-to-noise ratio (S/N), and we applied these solutions to the continuum-subtracted measurement sets. The common baselines between the three different observing configurations were consistent so we concatenated them into a single measurement set. This concatenated measurement set includes observations using the full baseline range and thus recovers the emission at most spatial scales.
The continuum-subtracted data cubes were created using tclean in CASA with a Briggs scheme and a robust value of 0.5, thus generating maps with a compromise between sensitivity and angular resolution. Both data cubes were made using the same image size, pixel size, and beam shape that was obtained using the spectral window with the shortest frequencies. The beam shapes for each target and the resulting rms for each spectral window can be found in Table 1.
Beam shapes and position angles for each target, and the rms calculated for each spectral window and a spectral resolution of 0.490 MHz.
3 Results
In this section we present the extraction of the spectra used in our analysis, the identification of the emission lines, and discuss the morphology of the emission of the COMs and the smaller molecules.
3.1 Spectra
In their analysis of the continuum, Kóspál et al. (2021) found that the inner disks of our targets are optically thick. Thus, line emission is expected to be weaker close to the peak continuum position. We verified this by extracting spectra from the pixel that matches the position of the peak in the continuum maps, i.e., the position of the protostar, and at some random pixels separated from the center. We found weaker line emission in the spectra extracted on the pixel closest to the protostar. Thus, we decided to extract the spectra from off-center positions where we could find the strongest line emission. We chose these positions by extracting spectra using a pixel-size aperture placed at multiple positions throughout the disks, and finding the pixels where the line emission was stronger in both spectral windows. Our decision to use an individual pixel to extract the spectra, instead of a larger aperture to boost the S/N, was to minimize the blending caused by the distribution of velocities found in a larger aperture. The continuum maps showing the positions of the protostars and our apertures are shown in Fig. 1. The coordinates of all the protostars and the ones of the selected positions for the extraction of spectra can be found in Table 2. For all targets, the separation between the peak of the continuum and where we extracted the spectra is less than the beam size.
For the line identification we used the CASSIS1 software, which includes the Cologne Database for Molecular Spectroscopy2 (CDMS; Müller et al. 2001, 2005), the Jet Propulsion Laboratory (JPL; Pickett et al. 1998) molecular database3, and the Lille Spectroscopic Database4 (LSD). We used CDMS for most of the species. For CHD2OH, CH3COCH3 , and CH3OCHO, we utilized the JPL database, and for CH3CHO we used LSD. The spectroscopic references for the different molecules are: CH3OH (Pickett et al. 1981; Sastry et al. 1984; Herbst et al. 1984; Anderson et al. 1990; Odashima et al. 1995; Müller et al. 2004; Xu et al. 2008), 13CH3OH (Xu et al. 1996; Xu & Lovas 1997), CH318OH (Fisher et al. 2007), CH2DOH (Pearson et al. 2012), CH3CHO (Smirnov et al. 2014), CH3OCH3 (Endres et al. 2009, and references therein), CH3OCHO (Ilyushin et al. 2009, and references therein), CH3COCH3 (Oldag & Sutter 1992; Groner et al. 2002, and references therein), C2H5OH (Pearson et al. 1995, 1996, 2008; Müller et al. 2016), C2H5CN (Johnson et al. 1977; Boucher et al. 1980; Pearson et al. 1994; Fukuyama et al. 1996; Brauer et al. 2009, and references therein), and 13CH3CN and CH3C15N (Müller et al. 2009, and references therein).
Among our targets, L1551 IRS 5 is the one with the most detected species, which we suspect is due to a combination of its proximity and its luminosity. In its northern disk we identified simple organics (H2CO, D2CO, DCN), sulfur-based species (H2S, OC33S, SO2), and 12 COMs (including different isotopologs): CH3OH, 13CH3OH, CH318OH, CH2DOH, CH3CHO, CH3OCH3, CH3OCHO, CH3COCH3, C2H5OH, C2H5CN, 13CH3CN, and CH3C15N. The L1551 IRS 5 N spectrum includes 249 transitions from these 12 COMs. The line emission from the southern disk of L1551 IRS 5 is weaker, and we only found emission from a subset of the molecules found in the northern disk (CH3OH, CH3OCH3, CH3OCHO, 13CH3 CN, and H2S) for a total of 37 COM transitions. In the case of Haro 5a IRS the continuum absorption is stronger than in the other targets decreasing the amount of species detected: CH3OH, CH3CHO, CH3OCH3, CH3OCHO, H2S, and DCN. The spectra of Haro 5a IRS also include 46 transitions from the COMS, and show tentative emission from H2CO and OC33 S but their low S/N prevented us from gaining any information about them. The continuum in V346 Nor and OO Ser did not show significant absorption. However, comparing these two targets to L1551 IRS 5 N, we detected fewer COMs and fewer transitions in V346 Nor (6 COMs and 70 transitions) and OO Ser (6 COMs and 51 transitions). In V346 Nor we detected CH3OH, CH2DOH, CH3CHO, CH3OCH3 , CH3OCHO, C2H5CN, H2S, DCN, H2CO, D2CO, and SO2. Finally, in OO Ser we detected CH3OH, CH3CHO, CH3OCH3, CH3OCHO, CH3COCH3, H2S, DCN, H2CO, D2CO, and SO2.
Positions of the protostars and the pixels used to extract the spectra, and the separation between the two positions.
3.2 Spatial distribution of COMs
In Fig. 2, we present the Moment 1 maps of CH3 OH for each of our targets, which were created with a 3σ cutoff, and in this subsection we discuss their morphologies.
Six transitions of CH3OH are strongly detected in L1551 IRS 5 N, V346 Nor, and OO Ser, and they show a velocity distribution that suggests disk rotation. The southern disk of L1551 IRS 5 is quite faint and its systemic velocity is bluer than the limits of the color scale in the plot, thus this disk is not seen in the Moment maps. Finally, the Haro 5a IRS maps show few pixels with notable emission, which is due to the continuum absorption of its disk. In the case of L1551 IRS 5, the transitions with lower Eup values are more extended toward the east, which indicates a difference in the physical conditions of the material of the circumbinary disk or the envelope. We suspect this extended emission traces material of the circumbinary disk or envelope that has been heated by the jets emanating from L1551 IRS 5 (Fridlund & Liseau 1998). However, the other three sources are also embedded and two of them (Haro 5a IRS and V346 Nor) drive jets or outflows (Kóspál et al. 2017; Cruz-Sáenz de Miera et al. 2023) yet we did not find a similar extended emission next to them. The three disks have comparable inclinations (Kóspál et al. 2021), which rules out a different perspective as an explanation for this lack of detection. Instead, it can be a matter of lack of sensitivity and angular resolution because L1551 IRS 5 is 3 and 5 times closer to us than V346 Nor and Haro 5a IRS, respectively.
We estimated the size of the CH3OH emission from the disk by using the imfit tool in CASA to fit a 2D Gaussian to the Moment 0 maps of the 232.78 GHz transition of each target. In the case of L1551 IRS 5 N, the transitions with Eup < 400 K extend beyond the dust disk toward the west of the protostar, so we chose to only use the transition at 232.783 GHz (Eup = 446.5 K) to measure the extent of CH3OH in all protostars. Part of the output of imfit is the semi-major full width at half maximum (FWHM), which we converted to a Gaussian σ by dividing the FWHM by  , and we used this σ as a proxy for the CH3OH disk radius.
For L1551 IRS 5 North, the disk has a deconvolved majoraxis FWHM of 0.521±0.108″, which gives a CH3OH radius of 30 au, an inclination of 46±17°, and a position angle (PA) of 0.9±22.5°. This gas disk radius is a factor of 3 larger than the emission from the continuum at 1.3 mm (Cruz-Sáenz de Miera et al. 2019). The CH3OH emission from southern disk was not resolved in most of the transitions, indicating that it has an extent of <12 au, i.e., comparable to the extent of the disk in the continuum. The continuum absorption of the Haro 5a IRS disk caused that its CH3OH maps only show a few pixels with significant emission, thus we were unable to compare its extent with respect to the dust. For V346 Nor the best-fit values are a deconvolved major-axis FWHM of 0.177±0.017″ (resulting in a disk radius of 53±5 au), an inclination of 24±17°, and a PA of 96±82°. Therefore, the geometrical properties of the CH3OH disk in V346 Nor are comparable, within the uncertainties, to the results obtained for the continuum emission via Gaussian fitting and via radiative transfer by Kóspál et al. (2021). The disk of OO Ser was barely resolved, and the fit resulted in a deconvolved major-axis FWHM of 0.155±0.068″, an inclination of 20±145°, and a PA of 144±87°. The CH3OH disk radius of OO Ser is 29±12 au which is the same as the dust radius found by Kóspál et al. (2021), and its inclination and PA are also in agreement with those from the dust disk.
In Fig. 3, we show the Moment 0 maps for different representative transitions of other COMs found in our targets. In L1551 IRS 5, these COMs trace the emission of the northern disk, while the southern disk is only barely detected. We measured the separations between the peaks in the Moment 0 maps of the COMs and the peaks of the continuum, and compared them to the semi-major axis of the beam of each map. These separation are ≲25% the size of the beam for both V346 Nor and OO Ser, ~30–40% for Haro 5a IRS, and ~45–80% for L1551 IRS 5 N. We consider these separations to be an indication of the COM emission being off-center only for L1551 IRS 5 N and Haro 5a IRS, and we corroborated this via a visual inspection. In the case of Haro 5a IRS, the emission peaks off-center, similar to CH3OH, and its extent is much smaller than the dust disk. For V346 Nor the emission is found close to the peak of the continuum, tracing an area similar to CH3OH. Finally, in the maps of OO Ser, most of the COMs have emission close to the peak of the continuum. Indeed, CH3CHO, CH3OCH3 and CH3 OCHO have morphologies similar to CH3OH but CH3COCH3 and C2H5CN peak off-center.
Figure 4 contains the velocity maps (moment 1) of the same representative transitions as Fig. 3, which we use to examine which molecules in which targets show evidence of rotation. The maps of L1551 IRS 5 show disk rotation for all the transitions in a southeast-northwest direction, comparable to the position angle of the disk found in the continuum (Cruz-Sáenz de Miera et al. 2019; Kóspál et al. 2021). The Haro 5a IRS disk only shows rotation in the maps of CH3OCH3 and CH3OCHO, which has an orientation also in agreement with the position angle estimated from the continuum (Kóspál et al. 2021). For the other detected COM, CH3CHO, only the redshifted side is detected. The remaining COMs were not detected and thus are not seen in the moment maps. The redshifted emission seen in the C2H5CN map is from a nearby CH3 CHO transition. In the case of V346 Nor, only CH3OCH3 shows the velocity gradient expected from rotation. For OO Ser, CH3CHO, CH3OCH3 and CH3 OCHO indicate rotation.
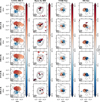 |
Fig. 2 Moment 1 maps of the different CH3OH transitions found in our targets (from top to bottom in increasing Eup). From left to right are L1551 IRS 5, Haro 5a IRS, V346 Nor, and OO Ser. The color scale of each target has been centered on the systemic velocity of the protostar (see Table 2), and is limited to ±3 km s−1 with respect to this velocity. The contours trace the continuum emission and are at the same levels as in Fig. 1. The star markers indicate the positions of the protostars. The beams are shown in the bottom left of each panel. The southern disk of L1551 IRS 5 is not seen in the maps as it is quite faint and its systemic velocity is bluer than the limits of the color scale of the plot. |
3.3 Spatial distribution of smaller molecules
In Fig. 5, we show the Moment 1 maps for the small molecules that we examined. These maps were constructed with a 4σ cutoff. In this figure the color scales for Haro 5a IRS, V346 Nor, and OO Ser were centered around their systemic velocities (see Table 2). For L1551 IRS 5, the color scale was centered with respect to the average velocity of its two disks, which matches the systemic velocity obtained from APEX observations of 13CO J=3–2 (Cruz-Sáenz de Miera et al. 2023).
As was the case for the COMs, the emission is stronger and most extended in L1551 IRS 5. H2S is the most extended and traces the circumbinary material. This molecule shows high velocity emission in the outer parts of the protostellar disks (i.e. the northern side of the northern disk and the southern side of the southern disk) that aligns to where Takakuwa et al. (2020) suggested the circumbinary spiral arms make contact with both protostars. The distributions of DCN, H2CO, and D2CO are similar to that of the lower Eup transitions of CH3OH, including the extended emission toward the western side of the northern disk. However, DCN also shows emission in the outer sides of both disks, at the same positions as in H2S. Meanwhile, the two remaining sulfur species, OC33S and SO2, extend beyond the continuum emission.
Similar to the case of the COMs, the dust continuum in Haro 5a IRS absorbs the emission from most of these small molecules, and only H2S and H2CO show emission with hints of disk rotation aligned with the dust disk (Kóspál et al. 2021).
V346 Nor shows emission in all these small molecules except for OC33 S. The small molecules extend beyond the COMs, and H2S and DCN extend beyond the continuum emission, and H2CO, D2CO and SO2 have emission with an extent comparable to the continuum. The distribution of velocities from these molecules is different from that of the COMs, which suggests contamination from the surrounded envelope.
Finally, the emission maps of OO Ser show detections of H2S, DCN, D2CO, and SO2 . These four species have barely extended emission and their velocity profiles are consistent with rotation similar to the COMs. H2CO has emission in a few pixels close to the peak of the continuum. H2S in OO Ser shows a blueshifted arm extending toward the south of the protostar; however, we lack the information to learn whether this is an embedded companion or signs of the surrounding envelope feeding material toward the FUor-like target similar to the recently reported streamer in FU Ori (Hales et al. 2024).
4 Analysis
After identifying the detected molecules, we determined the column densities (N) and excitation temperatures (Tex) of the different species assuming local thermodynamic equilibrium (LTE), similar to what has been done for other hot corinos (e.g., Jørgensen et al. 2016; Coutens et al. 2016, 2018). Andreu et al. (2023) checked the LTE assumption for water isotopologs in L1551 IRS 5 and found consistent results using both LTE and non-LTE methods. Thus, we assume that the other three targets have densities comparable to L1551 IRS 5 so that the LTE approximation is also valid for them. We used the Markov chain Monte Carlo (MCMC) approach provided in CASSIS for our analysis. This consists in generating synthetic spectra then comparing them to the observed data, and finding the set of parameters which results in the minimum χ2 . This MCMC approach enabled us to explore a wide parameter space. Each synthetic spectrum is created using a combination of column density (N), excitation temperature (Tex), systemic velocity (vLSR), FWHM of the line, and source size (s). A χ2 is computed for all the transitions selected for the comparison (meaning lines that are not blended and with sufficient S/N). The uncertainties we consider for this χ2 are the rms of each spectral window (see Table 1) and the nominal flux calibration uncertainty of ALMA (10%; ALMA Partnership 2016). Using this methodology instead of a rotational diagram approach allows us to verify that all the transitions in the full spectral window (not just those used in the fit) match the observational data. In addition, this approach of comparing synthetic spectra to observations does not assume that all the lines are optically thin, and instead the use of moderately optically thick lines can help constrain the source size of the analyzed species.
Table A.1 lists all the identified transitions We indicated the lines that are detected in each of the sources with diamond symbols. A filled diamond means that the transition is used in the fitting procedure, and the transitions with open markers are ignored due to either blending or very high optical depths.
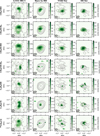 |
Fig. 3 Integrated emission maps of a representative line for seven species on each of the FUor-type young stars. Each map has been centered around the peak of the continuum of the protostar. From top to bottom, the Eup values of the transitions are 108.3, 80.9, 111.5, 115.5, 175.3, 157.7, and 142.4 K. The contours trace the continuum emission and are at the same levels as in Fig. 1. |
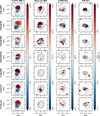 |
Fig. 4 Velocity field map (Moment 1) of the same representative transitions as in Fig. 3. The maps were generated with a 4σ clipping to minimize the noise in the resulting image. The velocities are clipped at ±3 km s−1. The velocities were centered on the vLSR of each target (see Table 2). The contours trace the continuum emission and are at the same levels as in Fig. 1. |
4.1 L1551 IRS 5 North
Our first MCMC runs for this disk consisted of letting the column density, excitation temperature, the systemic velocity, the FWHM of the line, and source size be free parameters for each species. The parameter space that we explored with MCMC for all targets was 1012 cm−2 ≤ N ≤ 1019 cm−2, 10 K ≤ Tex ≤ 300 K, 7.0 km s−1≤ vLSR ≤ 12.5 km s−1, 1 km s−1 ≤ FWHM ≤ 10 km s−1, and 0.01″ ≤ s ≤ 1.0″. N, Tex and s were explored in logarithmic scale, while linear scales were used for vLSR and FWHM. We ran the MCMC for 50 000 iterations and dropped the first 45 000 as a burn-in phase. Afterward we determined the best-fit parameters and their uncertainties using the 0.16, 0.50, and 0.84 percentiles. We found that shortening the burnin phase did not cause changes in the values of the best-fit parameters.
In our fitting procedure for CH2DOH, we followed the recommendations provided by the JPL database and only included the lines with Ka < 10 in the upper transition. Furthermore, based on the analysis by Oyama et al. (2023), we only kept the CH2DOH transitions that were present in the JPL database and in their list, and those with J < 26.
After obtaining a first version of the best-fit spectrum for all species, we incorporated it into a reference spectrum, which was used to double-check that the lines used in the fitting process were not blended. The full list of best-fit values and their statistical uncertainties for this first set of MCMC runs can be found in Table 3. We emphasize that these uncertainties are purely statistical and should be considered as underestimated. The subtraction of the baseline is known to be challenging for sources with very rich line spectra. Among the sources studied here, L1551 IRS 5 North is the one with the highest number of lines. We consequently used that source to estimate how an error on the baseline subtraction could affect the column densities. We assumed that our continuum level was overestimated by 1 rms so we added 1 rms to the spectrum and performed a new set of fits. In this additional fitting process, we fixed s, vLSR, and Tex to the values obtained when all parameters were initially free (i.e., top panel of Table 3). We then determined the best-fit column densities and FWHM, and found that the values of N were higher by a factor between 1.2 to 1.8, depending on the COM. As the spectra of the other sources are less line crowded, this factor is expected to be an upper limit for the other sources.
The observed spectrum of CH3OH in L1551 IRS 5 North includes transitions with 56 K ≲ Eup ≲ 946 K. The best-fit model is dominated by the lower-excitation lines with Eup ≲ 335 K (see Fig. B.1) and the fluxes of the high excitation lines are underestimated. As the low-excitation lines are commonly highly optically thick in hot corinos (e.g., Jørgensen et al. 2016; Bianchi et al. 2020), we ran our fitting again using only lines with Eup ≳ 657 K. After comparing the results from both fits, we found that s, FWHM and the vLSR did not change significantly. However, the best-fit values of N and Tex are different. This high-excitation fitting results in a higher N and lower Tex than the one including all the CH3 OH lines (see Table 3). Using highly optically thick lines could lead to an underestimation of the column density. So by using less optically thick high-excitation lines only, our best-fit N should be more accurate. To test this, we computed the column densities of CH3OH using its less abundant isotopologs,13CH3OH and CH318OH, and assuming standard isotopic ratios from the literature: [12C]/[13C] =68 (Milam et al. 2005) and [16O]/[18O] =560 (Wilson & Rood 1994). For this test, we fixed the Tex, FWHM, vLSR and s to the median values of the best fits found for all COMs (assuming all the CH3OH isotopologs and the COMs come from the same region), which left the column density as the only free parameter. When determining the medians, we excluded the results of CH3OH (and CH2DOH) that were obtained using optically thick lines. Here we ran the MCMC for 10 000 iterations and dropped the first 5000 as a burn-in phase. We multiplied the best-fit N by the aforementioned isotopic ratios and computed methanol column density values of 3.38 × 1019 cm−2 and 5.57 × 1019 cm−2 for the 13C and 18O isotopologs, respectively. These are in reasonable agreement with the fit of the high-excitation lines (1.60 × 1019 cm−2) by factors of 2–3, and are an order of magnitude higher than the value obtained when using the optically thick lines (4.66 × 1018 cm−2). Therefore, for the remainder of the paper, we only utilize the column density obtained using the high-excitation lines. The result of this high-excitation fit is marked with an a in Table 3.
A similar problem is seen for CH2DOH. The high opacity lines are well fitted while the fluxes of the optically thin lines are underestimated. So we ran the MCMC again only including the transitions with the lowest opacities. The fit obtained when including the optically thick lines resulted in a higher Tex (210 K vs 146 K) and a lower N (5.25 × 1018 cm−2 vs 6.57 × 1018 cm−2). The results are included in Table 3, labeled with a b. Just as for methanol, for the remainder of the paper we work with the fit found using only the low opacity lines.
For the other COMs, we also ran the second batch of MCMC runs where we fixed the Tex, vLSR, FWHM and s parameters to the medians of the best-fit values previously determined assuming free parameters. The models are of comparable quality with respect to the observational data as the ones obtained using free parameters (see Appendix B). For the majority of the lines, the differences between the data (black line) and the total model (green line) are below the 3σ level (shaded area). The full list of best-fit values and their statistical uncertainties for both batches of MCMC runs can be found in Table 3.
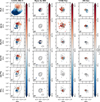 |
Fig. 5 Moment 1 maps of the small molecules found in our targets. From left to right are L1551 IRS 5, Haro 5a IRS, OO Ser, and V346 Nor. The color scale of L1551 IRS 5 is centered around the average velocity of its two disks, while for the remainder of the targets the color scales have been centered on the systemic velocity of each protostar. All the color scales are limited to ±3 km s−1. The contours trace the continuum emission and are at the same levels as in Fig. 1. The beams are shown in the bottom left corner of each panel. |
Best-fit parameters obtained for the L1551 IRS 5 northern disk using two different approaches.
4.2 L1551 IRS 5 South
The southern disk of L1551 IRS 5 has fewer and weaker lines than its northern counterpart. Due to a lack of constraints, we assumed for these MCMC runs the same source size as the northern disk (0.08″). The first set of MCMC runs were with N, Tex, vLSR and FWHM left as free parameters. The parameter space explored for these variables was the same as for the northern disk, except for vLSR which we limited to within 2 and 5 km s−1.
We computed the medians of this first set of MCMC runs and found Tex = 193.90K, FWHM = 2.23km s−1 and vLSR = 3.47 km s−1. For the computation of the medians, we excluded the results for CH3OCH3 because its best-fit Tex value cannot be constrained due to the four lines detected in this species having the same Eup value. The median values of Tex and FWHM are the same as those found independently for CH3OH. However, the best-fit value of vLSR found for CH3OH is 0.66 km s−1 bluer that the median vLSR, which is large enough to cause a bad fit of CH3OH. It is unclear whether the discrepancy between vLSR values is real or an effect caused by absorption at red- shifted velocities. We carried out a second set of MCMC runs for CH3OCH3, CH3OCHO and 13CH3CN by fixing Tex, vLSR and FWHM to the medians found from the first run. This second set of column densities will be the ones used to compute the abundances with respect to methanol (see below) even though CH3OH has a different vLSR than the other three COMs. These abundance ratios could then be quite uncertain.
The best-fit values and their statistical uncertainties for both MCMC runs, and the median values used for the second set of runs, are presented in Table 4. Similar to its northern counterpart, the models in L1551 IRS 5 S (Appendix C) match the data, with the uncertainties being less than the 3σ level.
4.3 Haro 5a IRS
In the case of Haro 5a IRS, we were not able to constrain the source size. There is a degeneracy between the column densities and the source size. Consequently, we decided to set the source size to 0.1″, which is comparable to the size of the emission seen in the moment maps (see Figs. 2 and 3). We also had to fix the FWHM at 2.5 km s−1 in order to decrease the number of free parameters and better fit the low S/N lines. This FWHM value was measured with CASSIS by fitting a Gaussian profile on the lines of the different COMs separately. The parameter space of N and Tex were the same as for the two previous disks, and for the vLSR, it was between 13 and 15 km s−1.
As for the two previous disks, a second set of MCMC runs were done using the median values of Tex and vLSR. However, after a visual inspection of the quality of these follow-up fits, we found that the models were not a good fit for all the molecules. We ran a third set of MCMC fits using the Tex and vLSR from the CH3 OH fit, and found that the resulting models were a slightly better fit than the ones using the medians. Thus, we kept the models obtained using the CH3OH constraints. We examined the residuals between the data and the best-fit model and found that the residual of all lines used for the fit fall within ±3σ. The best- fit values and their statistical uncertainties are in Table 5, and the best-fit spectra are shown in Appendix D.
Best-fit parameters obtained for Haro 5a IRS assuming a source size of 0.1″.
4.4 V346 Nor
For V346 Nor, the source size was also not constrained. So we assumed the size determined from the integrated emission map of CH3OH, 0.177″ (see Sect. 3.2). We first ran the MCMC with N, Tex, vLSR and FWHM as free parameters. The parameter space for vLSR was from −5.0 km s−1 to −2.0 km s−1 while for the other parameters it was the same as for the other disks. The CH3CHO lines appear to experience absorption at redshifted velocities, causing the best-fit vLSR value to be 0.3 km s−1 lower compared to the other COMs. The best-fit values and their statistical uncertainties are in Table 6, and the best-fit spectra are shown in Appendix E.
After fitting the COMs with all free parameters, we ran a secondary fitting using the median values obtained from it for the second set of runs. Just as the case of Haro 5a IRS, the models obtained using the median values was not satisfactory, and we ran a third set of fits using the results of the CH3OH fit. We carried out a visual comparison between the models obtained using the medians and the models obtained with the values found for CH3OH. In the case of CH3OH, we find that the model computed using the medians underestimates the fluxes of three lines by factors between 15% and 50%. For CH3CHO, the medians model results in six transitions with fluxes ≤25% higher than the observed spectrum, whereas the lines from the CH3OH model fit the data in shape and scale. Thus, the CH3 OH model is better at describing CH3CHO. In CH3OCH3 and CH3OCHO, the two models represent these molecules equally well. For C2H5CN, the CH3OH model slightly underestimates the flux of one line by ~25%, while the medians model overestimates one line by ~10%. Due to the higher S/N of the CH3OH and CH3CHO lines, we decided to keep the column densities obtained using the CH3OH parameters for the remaining of this paper.
We noted that 18 lines in this source have line profiles different from the synthetic ones (see Appendix E). Indeed, the majority of the CH3OH lines in V346 Nor (Fig. E.1) have flatter line profiles. For the lines with strong emission (panels a, b, c, d, f, g, and j) it could indicate that they are slightly optically thick (which suggests that our column density is a lower limit, as discussed below). For the other weaker lines, they are too close to the noise level to accurately discuss their line profiles. Some CH3CHO lines also differ from the synthetic spectrum, featuring a narrow blueshifted peak (see panels a, b, f, j, and m of Fig. E.4). However, the angular and spectral resolutions of the observations are not sufficient to identify what causes these different line profiles.
4.5 OO Ser
Similarly to V346 Nor and Haro 5a IRS, the source size was not constrained and we assumed the one obtained from the Moment 0 maps, 0.155″. Most of the lines in OO Ser appear to be made of two components, with the secondary component being blueshifted and ≲60% weaker (depending on the line) than the main component. We attempted to add a second component to the fitting procedure but, because some of the intensities of this possible secondary component are close to the noise level, we could not find consistent results during the runs. To try to circumvent this issue, we focused on the strongest component. We also fixed the values of FWHM and vLSR to 2.0 km s−1 and 9.25 km s−1, respectively. Therefore, N and Tex were the only free parameters, covering the same parameter space as the runs for the previous targets. In a second step, we fitted the remaining COMs with N being the sole free parameter and Tex fixed to the median of the values from in the previous run. The best-fit values and their statistical uncertainties are in Table 7, and the best-fit spectra are shown in Appendix F. The dominant peaks in the line profiles of OO Ser appear to be well described with one component. With the exception of panel c in Fig. F.4, the residuals between the data and the best-fit models are all within the 3σ level.
4.6 Small molecules
For the small molecules, we only have one transition of each. To derive column densities, we consequently need to assume a source size and Tex. Thus, we estimated their column densities following two approaches.
First, for each target, we fixed the source size and Tex to the values obtained for the COMs, and we let N, vLSR and FWHM be free parameters. We then ran an MCMC as for the previous fits. The best-fit values and uncertainties of all targets are reported in the second, third, and fourth columns of Table 8.
Second, we assumed a source size of 2″, so that there is no beam dilution, and considered two Tex values (50 K and 300 K) to provide a range of possible column densities for these molecules. Here we fixed the vLSR and FWHM to the values obtained in the first approach, and computed another set of MCMC runs. The best-fit values and uncertainties obtained for these two temperatures are shown in columns 5 and 6 of Table 8.
Best-fit parameters obtained for V346 Nor assuming a source size of 0.177″.
Best-fit parameters obtained for OO Ser assuming a source size of 0.155″.
5 Discussion
In this section we discuss the results for each individual FUor- like target, and explore whether they have the qualities necessary to be defined as a hot corino: compact and warm regions that exhibit COMs. We complement our discussion by comparing our FUor-like targets with other YSOs.
Best-fit parameters obtained for the small molecules.
Abundances with respect to  . The lines of CH3OH are probably optically thick, and thus the listed abundances with respect to it are considered as upper limits.
5.1 L1551 IRS 5
We found that both disks of L1551 IRS 5 have emission lines from multiple COMs in the inner areas of their disks, and their excitation temperatures are above 100 K. Thus, both disks have the requirements to classify as hot corinos. Bianchi et al. (2020) had already classified the northern disk of L1551 IRS 5 as a hot corino and suggested that the southern component might also be one. Here we confirm that both disks have hot corino-like properties.
Bianchi et al. (2020) ran a non-LTE fitting procedure for L1551 IRS 5 and found a lower limit of 1 × 1019 cm−2 for the N of CH3OH with a Tex of 100K, a FWHM of 3.5 km s−1, and a source size of 0.15″. While our column densities for the northern disk are in the same order of magnitude, a more quantitative comparison between our results and theirs is not trivial due to the different excitation temperatures, source sizes and FWHMs assumed. In the case of CH2DOH, Bianchi et al. (2020) fixed the source size to be the same size as for the main isotopolog of methanol, and their best-fit values of Tex and N are 88 K and ≥5 × 1017 cm−2, respectively. Their Tex is lower than the value we obtained (210.3 K) and to the median of all the COMs (177.6K). Both of our best-fit values of N (5.25 × 10¹⁸ and 2.81 × 1018 cm−2) agree with their lower limit. For C2H5OH, Bianchi et al. (2020) fixed the temperature and source size to their values obtained from methanol and obtained a best-fit N that is approximately 2–3 times lower than our values, which is in agreement with our results using a smaller source size (0.08″). Lastly, their estimate of the column density of CH3OCHO is comparable to our best-fit values.
We used the best-fit column densities obtained using the median Tex of 177.6K to calculate the deuteration ratio, D/H, of methanol for the northern disk of L1551 IRS 5. The N ratio between CH2DOH (2.81 × 1018 cm−2) and CH3OH (1.60 × 1019 cm−2) is 1.8 × 10⁻¹, which gives a statistical D/H ratio of CH3OH of 5.9%. The column densities of CH3OH from the 13C and 18O isotopologs (3.38 × 1019 cm−2 and 5.57 × 1019 cm−2, respectively) lead to isotopic ratios of 8.2 × 10⁻² and 5.1 × 10⁻², and statistical D/H ratios of 2.8% and 1.7%. These isotopic ratios are one or two orders of magnitude higher than what was found for HDO/H2O (1.6 – 2.1 × 10⁻³; Andreu et al. 2023). However, finding a higher D/H ratio for COMs than for water is common in low-mass protostars (e.g., Persson et al. 2013; Jørgensen et al. 2016, for IRAS 16293–2422), which is explained by the earlier formation of water in the star formation process (e.g., Ceccarelli et al. 2014; Furuya et al. 2016; Jensen et al. 2021). Our calculated D/H fractionation is in the same order to what was found for CH2DOH in IRAS 16293 A (2.8%; Manigand et al. 2020), IRAS 16293 B (2.4%; Jørgensen et al. 2018), IRAS 2A and IRAS 4A (5.8% and 3.7%, respectively; Taquet et al. 2019), and Seremb 11 (4.0%; Martín-Doménech et al. 2021). At the same time, it is higher than what was found for SVS13-A (0.05–0.24%; Bianchi et al. 2017a), HH 212 (0.8%; Bianchi et al. 2017b), L483 (0.8%; Jacobsen et al. 2019) and for V883 Ori (0.2-0.7%; Lee et al. 2019; Yamato et al. 2024).
5.2 Haro 5a IRS
The line emission from Haro 5a IRS appears to be compact (see Figs. 2 and 3). Taking this with the presence of four COMs and Tex above 100 K, it suggests that Haro 5a IRS is also similar to a hot corino. Haro 5a IRS has a companion 0.7″ to the southwest, and we did not find line emission from it.
Compared to the CH3OH maps of the other FUor-like targets (Fig. 2), Haro 5a IRS is the only one that does not show a disklike velocity distribution of the gas. Indeed, only the transitions with Eup values from 165.3 K to 190.4 K show emission in more than a few pixels compared to the other three shown transitions. We think that most of the line emission is hidden by the optically thick dust disk.
5.3 V346 Nor
Similar to the other targets, V346 Nor can be considered as a hot corino-like given its compact emission of multiple COMs with Tex higher than 100 K. We used the best-fit column densities obtained using the median Tex of 210.7 K to calculate the deuteration ratio, D/H, of methanol. The N ratio between CH2DOH (3.40 × 1017 cm−2) and CH3OH (2.04 × 1018 cm−2) is 1.7 × 10⁻¹, which gives a statistical D/H ratio of CH3OH of 5.6%. These numbers are the same as those found for L1551 IRS 5 North when using the main methanol isotopolog. However, the possible underestimation of the column density of CH3 OH and the low quality of the CH2DOH model make this value highly uncertain.
5.4 OO Ser
The COM emission is compact and comparable with the size of the continuum disk. While the Tex values of this target are high enough to be considered a hot corino, its median Tex (151.6 K) is the lowest among the other targets, which have Tex values between 177 K and 225 K. The lower temperature might be due to the outburst in this source finishing ~20 years ago. Indeed, Molyarova et al. (2018) showed that after the outburst finishes, different COMs stay in the gas phase for different lengths of time (see their Fig. 5). An extreme example of this is the case of CH3OCHO, which, in some models, had enhanced gas-phase column densities for more than 100 years after the outburst finished.
5.5 Impact of the chosen pixels
As discussed in Sect. 3, the spectra analyzed in this study are taken at a pixel position which maximizes the number of detected lines and species. However, the moment maps in Fig. 3 indicate that different COMs could exhibit different spatial distributions, which suggests that abundance ratios relative to CH3OH may vary across the disk. We consequently propose to check it for L1551 IRS 5 North.
For L1551 IRS 5 South, Haro 5a IRS, V346 Nor, and OO Ser we cannot explore this as the emission is not extended enough. At alternative positions located one beam away from the primary pixels, we do not detect most of the COMs.
In contrast, the spectral lines at other positions of L1551 IRS 5 North were strong enough to conduct further analysis. We examined three additional positions in this FUor, at the northeast (NE), southeast (SE), and southwest (SW) sides of the disk, with our original pixel located on the northwest (NW). See Fig. 1. The spectra at these three positions present weaker lines, leading to non-detections of CH3OCH3, CH3COCH3, and CH3C15N. For the detected COMs at these positions (CH2DOH, CH3CHO, CH3OCHO, C2H5OH, C2H5CN, and CH3C15N), we conducted line fitting by fixing the source size to the same size as for the NW position (0.08″, see Table 3).
We followed the same procedure as in Sect. 4 to obtain the column densities at these alternative positions. We used the lines of CH318OH to estimate the column density of methanol. We estimated the abundance ratios for the COMs detected at the three additional positions and compared them with those from the original fit. The results are shown in Table 10.
We found that, aside from CH2DOH, relative abundances to methanol were consistent across the four positions, within a factor of 3. For CH2DOH, the original position showed higher abundances compared to the three other positions by factors of 3–5, possibly indicating an actual enhancement in the column density of this molecule. Finally, the D/H statistical ratio at these three alternative positions (0.3–0.5%) would be comparable to what was found for SVS13-A, HH212, L483, and V883 Ori in Sect. 5.1.
Abundance ratios with respect to CH3OH between different positions in L1551 IRS 5 North.
5.6 Comparison with other YSOs
Molyarova et al. (2018) modeled the changes in the chemical composition of a protoplanetary disk due to the effects of a FUor- like luminosity outburst. They found that some molecules are more sensitive to the outburst than others, meaning that for some of them their abundances with respect to H2 increase by at least two orders of magnitude. Four of the COMs we detected are among the ones analyzed by Molyarova et al. (2018): CH3OH, CH3CHO, CH3OCH3, and CH3OCHO. They found that the abundances with respect to H2 of these species increase by at least three orders of magnitude during a FUor-type outburst. Their estimated abundance increases (their Table 1) suggest that for CH3CHO, CH3OCH3 and CH3OCHO, their abundances with respect to CH3OH should increase one and two orders of magnitude during an outburst. Furthermore, Molyarova et al. (2018) found that CH3OH freezes out as soon as the outburst finishes. However, in their models with medium sized grains the abundance of CH3OH with respect to H2 experiences a second enhancement after the return to quiescence. The models with large dust grains did not exhibit this behavior. Their models for CH3 CHO and CH3OCHO show that they have enhanced abundances even 20–300 years after the outburst (depending on the species and the model; see their Fig. 5). Therefore, for large dust grains, the abundances of these two COMs with respect to CH3 OH would be higher in the post-outburst stage than during the outburst (see also Taquet et al. 2016). In contrast, for medium dust grains, the abundances would be similar during and after the outburst.
We compare the chemical composition of these FUor-like eruptive young stars with other Class 0/I objects including quiescent sources from the literature by determining the abundance ratios of COMs with respect to CH3OH. The goal is to determine whether the presence of bursts could affect the molecular composition and search for differences in the abundances with respect to methanol that were predicted by Molyarova et al. (2018). The comparison plot is shown in Fig. 6. We limited this comparison only to sources that have been observed with interferometers, as the single-dish observations can cause significant beam-dilution of the emission line fluxes and are more susceptible to envelope or large scale shock contamination. Our comparison was done against IRAS 16293-2422 (Jørgensen et al. 2016; Manigand et al. 2020), V883 Ori (Lee et al. 2019), L483 (Jacobsen et al. 2019), the CALYPSO survey (Belloche et al. 2020), SVS13-A (Bianchi et al. 2022b), HOPS 108 (Chahine et al. 2022), the PEACHES survey (Yang et al. 2022), and HOPS 373SW (Lee et al. 2023). IRAS 16293-2422, also a protobinary, L1483, HOPS 108, and B335 are Class 0 protostars. As mentioned in Sect. 1, V883 Ori, SVS13-A, HOPS 373SW, and B335 are outbursting protostars. The near-infrared spectrum of V883 Ori is similar to the prototypical FUors but its photometric brightening was not detected, thus it is classified as FUor-like (Connelley & Reipurth 2018). SVS13 is a protobinary that went into outburst in 1990 and has been fading since then. HOPS 373SW began experiencing a powerful outburst in 2020 (Yoon et al. 2022). B335 began its burst between 2010 and 2012, and it lasted until 2023. Lee et al. (2025) found that the line intensities of the COMs were higher during the two epochs during the burst and the one at the end of the event compared to the epoch before the burst. Lee et al. (2025) interpreted this as an indication of an enhancement of the COM column densities due to the sublimation brought by the outburst, and that the COMs had not returned to their pre-burst abundances months after the object returned to quiescence. The PEACHES survey is composed of 50 Class 0/I sources in Perseus. From the CALYPSO survey, we included into our analysis only the five sources with estimated abundances (NGC1333-IRAS2A1, Serps-MM18a, L1448-C, SerpM-S68N, and L1157), which all happen to be Class 0 objects.
For the four eruptive young stars of this work, we used the abundances calculated with respect to CH3OH. We also compared the abundances of L1551 IRS 5 North calculated using 13CH3OH and CH318OH. In the case of HOPS 108 and the two protostars in IRAS 16293, the abundances were computed using CH318OH and an isotopic ratio [16O]/[18O] of 560. For V883 Ori (Lee et al. 2019), SVS13-A (Bianchi et al. 2022b), and HOPS 373SW (Lee et al. 2023), their respective authors calculated their abundances using 13CH3OH and an isotopic ratio [12C]/[13C] of 60. We computed the column density ratios of B335 using the 13CH3OH column densities reported by Lee et al. (2025), and an isotopic ratio [12C]/[13C] of 68. For the PEACHES survey (Yang et al. 2022), the abundances were calculated with respect to CH3OH.
In Fig. 6, we see that the abundance ratios of COMs with respect to CH3OH vary depending on the used isotopolog. On average, the ratios increase with the abundance of the methanol isotopolog. While it is clearly shown in the COMs abundances of L1551 IRS 5 North for which we also have the 13C and 18O isotopologs of methanol, this effect can also be seen along the sources from the literature. This trend strongly suggests that ratios using the main isotopolog of methanol should be considered with extreme caution. Indeed, most of the lines of the CH3 OH main isotopolog are optically thick. Studies based on the main isotopolog only consequently leads to overestimates of the column density ratios with respect to CH3OH. Comparison using lower abundant isotopologs of CH3OH should be favored when possible.
In the northern disk of L1551 IRS 5, we also find that the abundance ratios calculated using13 CH3OH are higher than those computed using CH318OH. This suggests that opacity effects could also affect the column densities of 13CH3OH if the assumed isotopic ratios of C and O are correct. Bianchi et al. (2020) suggested that the 13CH3OH lines could be optically thick in this source too. So it is possible that it is also the case in other protostars and some abundances of COMs determined relative to 13CH3OH in the literature may also represent upper limits.
The range of abundances found using 13CH3OH and CH318OH spans one or two orders of magnitude depending on the species. However, the number of sources available for comparison is very small for a valuable comparison. Regarding the values of IRAS16293 A taken from Manigand et al. (2020), it should be noted that the position chosen to model the species could affect the abundances ratios, as some species (e.g., CH3CHO) seem to be more compact than others. The abundance ratios given for this source could consequently be different toward a more central position, but blending issues prevented us from constraining them precisely. The low CH3CHO/CH3OH ratio seen in Fig. 6 for IRAS16293 A may then be underestimated.
To circumvent the optical thickness issues in CH3OH, we also computed abundances with respect to the other COMs. The results are shown in Fig. 7, which do not include L1157 as only CH3OH and CH3OCHO were detected in it. These abundances also range between one or two orders of magnitude. IRAS16293 A is a common outlier when using CH3CHO, due to the aforementioned dependence on the position where the spectrum was extracted. HOPS 108 is also separated from the rest of the sample in a few ratios (CH3OCHO/CH3CHO, CH3OCHO/CH3OCH3).
Regardless of the COM used to calculate the abundance ratios, no trend is seen between the outbursting and quiescent sources but the sample is too small for any firm conclusion. In order to properly characterize the diversity of chemical composition in the Class 0/I stages of the star formation process, it is necessary to increase the number of protostars (both quiescent and outbursting) with high-quality measurements of multiple COMs, including rarer isotopologs of CH3OH.
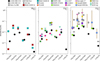 |
Fig. 6 Comparison of abundances between our four targets and other young stellar objects. The panels from left to right show the abundance ratios with respect to methanol based on CH318OH, 13CH3OH, and CH3OH. The sources considered to be or that have been in outburst (L1551 IRS 5 North, Haro 5a IRS, V346 Nor, OO Ser, VLA4A/B, HOPS 373SW, V883 Ori) are slightly shifted to the right, while the quiescent sources are shifted to the left. In the case of B335 we plotted two epochs, one from 2014 representing the quiescent state and another from 2016 when the source was bursting. We consider the abundance ratios calculated with respect to the main isotopolog of CH3OH as upper limits. |
6 Conclusions
We analyzed ALMA Band 6 observations of four FUor-type eruptive young stars, and found emission from multiple COMs and other simple species in each target. The emission of the COMs is generally compact and comparable to the size of the dust disk. We used CASSIS to run a line-fitting procedure assuming LTE, obtaining a best-fit column density N and excitation temperature Tex for each molecule in each protostar. Our best fit resulted in most COMs having Tex values above 100 K, indicating warm emission. Therefore, we propose that these four FUor-type protostars are hot corinos.
One of these sources, L1551 IRS 5, is a protobinary with COMs emission in both the northern and southern disks. Earlier works have proposed the northern disk to be the one currently experiencing the outburst, which aligns with our results of it having stronger emission from more COMs than the southern disk, and with higher Tex values. Haro 5a IRS has the weakest line emission, although its luminosity and distance are comparable to those of OO Ser. We expect this to be due to high dust optical depths. V346 Nor is the source where we detected the second- largest amount of species. OO Ser has the lowest Tex values among the outbursting sources, but still high enough to be considered as a hot corino. This could be due to the fact that this protostar experienced an 11-year outburst that finished in 2006 (Kóspál et al. 2007).
We calculated the abundances of COMs with respect to CH3OH for each target (see Table 9). In the case of the northern disk of L1551 IRS 5, several high excitation lines of CH3OH were detected. Their opacities are lower than those of the low excitation lines, which are clearly optically thick. The best-fit N calculated using these high excitation lines is in agreement, within a factor of 2–3, with the value obtained for 13CH3OH and CH318OH assuming standard isotopic ratios. The 13CH3OH lines of L1551 IRS 5 North could be slightly optically thick, if the assumed isotopic ratios are correct. For the remaining FUors, the CH3OH emission lines should be considered optically thick and the abundance ratios of COMs as upper limits. Comparisons of COMs abundance ratios with respect to CH3OH using the rarer 18O or 13C isotopologs should be favored.
The abundance ratios of COMs in L1551 IRS 5 are compared to other values in the literature. The sample of sources with ratios using the 18O or 13C isotopologs of methanol is small, which limits the comparison. The range of values spans 1-2 orders of magnitude for each species (CH3CHO, CH3 OCH3 , CH3OCHO, CH3COCH3, C2H5OH, C2H5CN). No trend is seen in the outbursting sources versus the more quiescent hot corinos.
The detection of COMs does not only occur in outbursting stars. However, it is clear that FUor-type eruptive young stars could be used as experiments to study the chemistry of protostars that otherwise would not be luminous enough to have significant COM detection. Comparing different sources observed using different instrumentation or even spectral configurations is not trivial due to the difference in optical depths or range of Eup values analyzed. Therefore, surveys with deep integrations and broad spectral bandwidth that covers multiple transitions from different isotopologs is the best option to study the chemistry of protostars and to carry out comparisons between them.
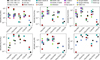 |
Fig. 7 Abundances of the four FUors and other young stellar objects with respect to different COMs. Here the symbols are also slightly shifted to the left or right if the source is considered to be quiescent or outbursting, respectively. |
Data availability
The appendices are available at https://zenodo.org/records/14967612.
Acknowledgements
We are grateful to the anonymous referee for their constructive comments, which significantly enhanced the quality of this paper. This study is part of a project that has received funding from the European Research Council (ERC) under the European Union’s Horizon 2020 research and innovation programme (Grant agreements no. 949278, Chemtrip, and no. 716155, SAC- CRED). This work was also supported by the NKFIH NKKP grant ADVANCED 149943 and the NKFIH excellence grant TKP2021-NKTA-64.Project no.149943 has been implemented with the support provided by the Ministry of Culture and Innovation of Hungary from the National Research, Development and Innovation Fund, financed under the NKKP ADVANCED funding scheme. This paper makes use of the following ALMA data: ADS/JAO.ALMA#2016.1.00209.S. ALMA is a partnership of ESO (representing its member states), NSF (USA) and NINS (Japan), together with NRC (Canada) and NSC and ASIAA (Taiwan) and KASI (Republic of Korea), in cooperation with the Republic of Chile. The Joint ALMA Observatory is operated by ESO, AUI/NRAO and NAOJ. On behalf of the SACCRED project we thank for the usage of MTA Cloud (https://cloud.csfk.org/) that significantly helped us achieving the results published in this paper.
References
- Alarcón, F., Casassus, S., Lyra, W., Pérez, S., & Cieza, L. 2024, MNRAS, 527, 9655 [Google Scholar]
- ALMA Partnership, Asayama, S., Biggs, A., de Gregorio, I., et al. 2016, ALMA Cycle 4 Technical Handbook, https://almascience.eso.org/documents-and-tools/cycle4/alma-technical-handbook [Google Scholar]
- Anderson, T., De Lucia, F., & Herbst, E. 1990, ApJS, 72, 797 [NASA ADS] [CrossRef] [Google Scholar]
- Andreu, A., Coutens, A., Cruz-Sáenz de Miera, F., et al. 2023, A&A, 677, L17 [NASA ADS] [CrossRef] [EDP Sciences] [Google Scholar]
- Artur de la Villarmois, E., Jørgensen, J. K., Kristensen, L. E., et al. 2019, A&A, 626, A71 [NASA ADS] [CrossRef] [EDP Sciences] [Google Scholar]
- Belloche, A., Maury, A. J., Maret, S., et al. 2020, A&A, 635, A198 [NASA ADS] [CrossRef] [EDP Sciences] [Google Scholar]
- Bergner, J. B., Martín-Doménech, R., Öberg, K. I., et al. 2019, ACS Earth Space Chem., 3, 1564 [NASA ADS] [CrossRef] [Google Scholar]
- Bianchi, E., Codella, C., Ceccarelli, C., et al. 2017a, MNRAS, 467, 3011 [NASA ADS] [CrossRef] [Google Scholar]
- Bianchi, E., Codella, C., Ceccarelli, C., et al. 2017b, A&A, 606, L7 [NASA ADS] [CrossRef] [EDP Sciences] [Google Scholar]
- Bianchi, E., Codella, C., Ceccarelli, C., et al. 2019, MNRAS, 483, 1850 [Google Scholar]
- Bianchi, E., Chandler, C. J., Ceccarelli, C., et al. 2020, MNRAS, 498, L87 [NASA ADS] [CrossRef] [Google Scholar]
- Bianchi, E., Ceccarelli, C., Codella, C., et al. 2022a, A&A, 662, A103 [NASA ADS] [CrossRef] [EDP Sciences] [Google Scholar]
- Bianchi, E., López-Sepulcre, A., Ceccarelli, C., et al. 2022b, ApJ, 928, L3 [NASA ADS] [CrossRef] [Google Scholar]
- Bottinelli, S., Ceccarelli, C., Neri, R., et al. 2004, ApJ, 617, L69 [Google Scholar]
- Boucher, D., Dubrulle, A., Demaison, J., & Dreizler, H. 1980, Z. Naturfor. A, 35, 1136 [Google Scholar]
- Bourdarot, G., Berger, J. P., Lesur, G., et al. 2023, A&A, 676, A124 [NASA ADS] [CrossRef] [EDP Sciences] [Google Scholar]
- Brauer, C. S., Pearson, J. C., Drouin, B. J., & Yu, S. 2009, ApJS, 184, 133 [CrossRef] [Google Scholar]
- Cazaux, S., Tielens, A. G. G. M., Ceccarelli, C., et al. 2003, ApJ, 593, L51 [CrossRef] [Google Scholar]
- Ceccarelli, C. 2004, in Astronomical Society of the Pacific Conference Series, 323, Star Formation in the Interstellar Medium: In Honor of David Hollenbach, eds. D. Johnstone, F. C. Adams, D. N. C. Lin, D. A. Neufeeld, & E. C. Ostriker, 195 [NASA ADS] [Google Scholar]
- Ceccarelli, C., Caselli, P., Bockelée-Morvan, D., et al. 2014, in Protostars and Planets VI, eds. H. Beuther, R. S. Klessen, C. P. Dullemond, & T. Henning, 859 [Google Scholar]
- Chahine, L., López-Sepulcre, A., Neri, R., et al. 2022, A&A, 657, A78 [NASA ADS] [CrossRef] [EDP Sciences] [Google Scholar]
- Connelley, M. S., & Reipurth, B. 2018, ApJ, 861, 145 [NASA ADS] [CrossRef] [Google Scholar]
- Coutens, A., Jørgensen, J. K., van der Wiel, M. H. D., et al. 2016, A&A, 590, L6 [NASA ADS] [CrossRef] [EDP Sciences] [Google Scholar]
- Coutens, A., Willis, E. R., Garrod, R. T., et al. 2018, A&A, 612, A107 [NASA ADS] [CrossRef] [EDP Sciences] [Google Scholar]
- Cruz-Sáenz de Miera, F., Kóspál, Á., Ábrahám, P., Liu, H. B., & Takami, M. 2019, ApJ, 882, L4 [CrossRef] [Google Scholar]
- Cruz-Sáenz de Miera, F., Kóspál, Á., Ábrahám, P., et al. 2023, ApJ, 945, 80 [CrossRef] [Google Scholar]
- De Simone, M., Codella, C., Testi, L., et al. 2017, A&A, 599, A121 [NASA ADS] [CrossRef] [EDP Sciences] [Google Scholar]
- Drążkowska, J., Bitsch, B., Lambrechts, M., et al. 2023, in Astronomical Society of the Pacific Conference Series, 534, Protostars and Planets VII, eds. S. Inutsuka, Y. Aikawa, T. Muto, K. Tomida, & M. Tamura, 717 [Google Scholar]
- Eisloeffel, J., Guenther, E., Hessman, F. V., et al. 1991, ApJ, 383, L19 [NASA ADS] [CrossRef] [Google Scholar]
- Endres, C. P., Drouin, B. J., Pearson, J. C., et al. 2009, A&A, 504, 635 [NASA ADS] [CrossRef] [EDP Sciences] [Google Scholar]
- Fisher, J., Paciga, G., Xu, L.-H., et al. 2007, J. Mol. Spectrosc., 245, 7 [NASA ADS] [CrossRef] [Google Scholar]
- Fischer, W. J., Hillenbrand, L. A., Herczeg, G. J., et al. 2022, arXiv e-prints [arXiv:2203.11257] [Google Scholar]
- Fridlund, C. V. M., & Liseau, R. 1998, ApJ, 499, L75 [Google Scholar]
- Fukuyama, Y., Odashima, H., Takagi, K., & Tsunekawa, S. 1996, ApJS, 104, 329 [NASA ADS] [CrossRef] [Google Scholar]
- Furuya, K., van Dishoeck, E. F., & Aikawa, Y. 2016, A&A, 586, A127 [NASA ADS] [CrossRef] [EDP Sciences] [Google Scholar]
- Groner, P., Albert, S., Herbst, E., et al. 2002, ApJS, 142, 145 [NASA ADS] [CrossRef] [Google Scholar]
- Hales, A. S., Gupta, A., Ruíz-Rodríguez, D., et al. 2024, ApJ, 966, 96 [NASA ADS] [CrossRef] [Google Scholar]
- Herbst, E., & van Dishoeck, E. F. 2009, ARA&A, 47, 427 [NASA ADS] [CrossRef] [Google Scholar]
- Herbst, E., Messer, J. K., De Lucia, F. C., & Helminger, P. 1984, J. Mol. Spectrosc., 108, 42 [NASA ADS] [CrossRef] [Google Scholar]
- Hodapp, K. W., & Chini, R. 2014, ApJ, 794, 169 [Google Scholar]
- Hodapp, K. W., Chini, R., Watermann, R., & Lemke, R. 2012, ApJ, 744, 56 [Google Scholar]
- Hsu, S.-Y., Liu, S.-Y., Johnstone, D., et al. 2023, ApJ, 956, 120 [Google Scholar]
- Ilyushin, V., Kryvda, A., & Alekseev, E. 2009, J. Mol. Spectrosc., 255, 32 [NASA ADS] [CrossRef] [Google Scholar]
- Jacobsen, S. K., Jørgensen, J. K., Di Francesco, J., et al. 2019, A&A, 629, A29 [NASA ADS] [CrossRef] [EDP Sciences] [Google Scholar]
- Jensen, S. S., Jørgensen, J. K., Kristensen, L. E., et al. 2021, A&A, 650, A172 [EDP Sciences] [Google Scholar]
- Johnson, D. R., Lovas, F. J., Gottlieb, C. A., et al. 1977, ApJ, 218, 370 [NASA ADS] [CrossRef] [Google Scholar]
- Jørgensen, J. K., van der Wiel, M. H. D., Coutens, A., et al. 2016, A&A, 595, A117 [Google Scholar]
- Jørgensen, J. K., Müller, H. S. P., Calcutt, H., et al. 2018, A&A, 620, A170 [Google Scholar]
- Kóspál, Á., Ábrahám, P., Prusti, T., et al. 2007, A&A, 470, 211 [NASA ADS] [CrossRef] [EDP Sciences] [Google Scholar]
- Kóspál, Á., Ábrahám, P., Csengeri, T., et al. 2017, ApJ, 843, 45 [CrossRef] [Google Scholar]
- Kóspál, Á., Szabó, Z. M., Ábrahám, P., et al. 2020, ApJ, 889, 148 [CrossRef] [Google Scholar]
- Kóspál, Á., Cruz-Sáenz de Miera, F., White, J. A., et al. 2021, ApJS, 256, 30 [CrossRef] [Google Scholar]
- Kraus, S., Caratti o Garatti, A., Garcia-Lopez, R., et al. 2016, MNRAS, 462, L61 [NASA ADS] [CrossRef] [Google Scholar]
- Lee, J.-E., Lee, S., Baek, G., et al. 2019, Nat. Astron., 3, 314 [Google Scholar]
- Lee, J.-E., Baek, G., Lee, S., et al. 2023, ApJ, 956, 43 [Google Scholar]
- Lee, J.-E., Evans, N. J., Baek, G., et al. 2025, ApJ, 978, L3 [Google Scholar]
- Lim, J., Yeung, P. K. H., Hanawa, T., et al. 2016, ApJ, 826, 153 [NASA ADS] [CrossRef] [Google Scholar]
- Liseau, R., Fridlund, C. V. M., & Larsson, B. 2005, ApJ, 619, 959 [NASA ADS] [CrossRef] [Google Scholar]
- Lykou, F., Ábrahám, P., Chen, L., et al. 2022, A&A, 663, A86 [NASA ADS] [CrossRef] [EDP Sciences] [Google Scholar]
- Manigand, S., Jørgensen, J. K., Calcutt, H., et al. 2020, A&A, 635, A48 [NASA ADS] [CrossRef] [EDP Sciences] [Google Scholar]
- Marchand, P., Coutens, A., Scigliuto, J., et al. 2024, A&A, 687, A195 [NASA ADS] [CrossRef] [EDP Sciences] [Google Scholar]
- Martín-Doménech, R., Bergner, J. B., Öberg, K. I., et al. 2021, ApJ, 923, 155 [CrossRef] [Google Scholar]
- McMullin, J. P., Waters, B., Schiebel, D., Young, W., & Golap, K. 2007, in Astronomical Society of the Pacific Conference Series, 376, Astronomical Data Analysis Software and Systems XVI, eds. R. A. Shaw, F. Hill, & D. J. Bell, 127 [NASA ADS] [Google Scholar]
- Mercimek, S., Codella, C., Podio, L., et al. 2022, A&A, 659, A67 [NASA ADS] [CrossRef] [EDP Sciences] [Google Scholar]
- Milam, S. N., Savage, C., Brewster, M. A., Ziurys, L. M., & Wyckoff, S. 2005, ApJ, 634, 1126 [Google Scholar]
- Molyarova, T., Akimkin, V., Semenov, D., et al. 2018, ApJ, 866, 46 [NASA ADS] [CrossRef] [Google Scholar]
- Müller, H. S. P., Thorwirth, S., Roth, D. A., & Winnewisser, G. 2001, A&A, 370, L49 [Google Scholar]
- Müller, H. S. P., Menten, K. M., & Mäder, H. 2004, A&A, 428, 1019 [NASA ADS] [CrossRef] [EDP Sciences] [Google Scholar]
- Müller, H. S. P., Schlöder, F., Stutzki, J., & Winnewisser, G. 2005, J. Mol. Struct., 742, 215 [Google Scholar]
- Müller, H. S. P., Drouin, B. J., & Pearson, J. C. 2009, A&A, 506, 1487 [NASA ADS] [CrossRef] [EDP Sciences] [Google Scholar]
- Müller, H. S. P., Belloche, A., Xu, L.-H., et al. 2016, A&A, 587, A92 [NASA ADS] [CrossRef] [EDP Sciences] [Google Scholar]
- Odashima, H., Matsushima, F., Nagai, K., Tsunekawa, S., & Takagi, K. 1995, J. Mol. Spectrosc., 173, 404 [NASA ADS] [CrossRef] [Google Scholar]
- Oldag, F., & Sutter, D. H. 1992, Z. Naturfor. A, 47, 527 [Google Scholar]
- Oyama, T., Ohno, Y., Tamanai, A., et al. 2023, ApJ, 957, 4 [Google Scholar]
- Pearson, J. C., Sastry, K. V. L. N., Herbst, E., & De Lucia, F. C. 1994, ApJS, 93, 589 [Google Scholar]
- Pearson, J. C., Sastry, K. V. L. N., Winnewisser, M., Herbst, E., & De Lucia, F. C. 1995, J. Phys. Chem. Ref. Data, 24, 1 [NASA ADS] [CrossRef] [Google Scholar]
- Pearson, J. C., Sastry, K. V. L. N., Herbst, E., & De Lucia, F. C. 1996, J. Mol. Spectrosc., 175, 246 [CrossRef] [Google Scholar]
- Pearson, J. C., Brauer, C. S., & Drouin, B. J. 2008, J. Mol. Spectrosc., 251, 394 [NASA ADS] [CrossRef] [Google Scholar]
- Pearson, J. C., Yu, S., & Drouin, B. J. 2012, J. Mol. Spectrosc., 280, 119 [NASA ADS] [CrossRef] [Google Scholar]
- Persson, M. V., Jørgensen, J. K., & van Dishoeck, E. F. 2013, A&A, 549, L3 [NASA ADS] [CrossRef] [EDP Sciences] [Google Scholar]
- Pickett, H. M., Cohen, E. A., Brinza, D. E., & Schaefer, M. M. 1981, J. Mol. Spectrosc., 89, 542 [NASA ADS] [CrossRef] [Google Scholar]
- Pickett, H. M., Poynter, R. L., Cohen, E. A., et al. 1998, J. Quant. Spec. Radiat. Transf., 60, 883 [Google Scholar]
- Reipurth, B., & Aspin, C. 1997, AJ, 114, 2700 [NASA ADS] [CrossRef] [Google Scholar]
- Sastry, K.V.L.N., Lees, R. M., & De Lucia, F. C. 1984, J. Mol. Spectrosc., 103, 486 [NASA ADS] [CrossRef] [Google Scholar]
- Smirnov, I. A., Alekseev, E. A., Ilyushin, V. V., et al. 2014, J. Mol. Spectrosc., 295, 44 [NASA ADS] [CrossRef] [Google Scholar]
- Takakuwa, S., Saigo, K., Matsumoto, T., et al. 2020, ApJ, 898, 10 [NASA ADS] [CrossRef] [Google Scholar]
- Taquet, V., Wirström, E. S., & Charnley, S. B. 2016, ApJ, 821, 46 [Google Scholar]
- Taquet, V., Bianchi, E., Codella, C., et al. 2019, A&A, 632, A19 [NASA ADS] [CrossRef] [EDP Sciences] [Google Scholar]
- Tobin, J. J., Sheehan, P. D., Megeath, S. T., et al. 2020, ApJ, 890, 130 [CrossRef] [Google Scholar]
- Tobin, J. J., van’t Hoff, M. L. R., Leemker, M., et al. 2023, Nature, 615, 227 [NASA ADS] [CrossRef] [Google Scholar]
- van’t Hoff, M. L. R., Tobin, J. J., Trapman, L., et al. 2018, ApJ, 864, L23 [CrossRef] [Google Scholar]
- van’t Hoff, M. L. R., Harsono, D., Tobin, J. J., et al. 2020, ApJ, 901, 166 [Google Scholar]
- Vastel, C., Bottinelli, S., Caux, E., Glorian, J. M., & Boiziot, M. 2015, in SF2A- 2015: Proceedings of the Annual meeting of the French Society of Astronomy and Astrophysics, 313 [Google Scholar]
- Wilson, T. L., & Rood, R. 1994, ARA&A, 32, 191 [Google Scholar]
- Xu, L.-H., & Lovas, F. J. 1997, J. Phys. Chem. Ref. Data, 26, 17 [Google Scholar]
- Xu, L.-H., Walsh, M. S., & Lees, R. M. 1996, J. Mol. Spectrosc., 179, 269 [Google Scholar]
- Xu, L.-H., Fisher, J., Lees, R. M., et al. 2008, J. Mol. Spectrosc., 251, 305 [NASA ADS] [CrossRef] [Google Scholar]
- Yamato, Y., Notsu, S., Aikawa, Y., et al. 2024, AJ, 167, 66 [NASA ADS] [CrossRef] [Google Scholar]
- Yang, Y.-L., Evans, N. J., Karska, A., et al. 2022, ApJ, 925, 93 [NASA ADS] [CrossRef] [Google Scholar]
- Yoon, S.-Y., Herczeg, G. J., Lee, J.-E., et al. 2022, ApJ, 929, 60 [Google Scholar]
- Zwicky, L., Molyarova, T., Akimkin, V., et al. 2024, MNRAS, 527, 7652 [Google Scholar]
CASSIS has been developed by IRAP-UPS/CNRS (Vastel et al. 2015). https://cassis.irap.omp.eu/
All Tables
Beam shapes and position angles for each target, and the rms calculated for each spectral window and a spectral resolution of 0.490 MHz.
Positions of the protostars and the pixels used to extract the spectra, and the separation between the two positions.
Best-fit parameters obtained for the L1551 IRS 5 northern disk using two different approaches.
Abundances with respect to . The lines of CH3OH are probably optically thick, and thus the listed abundances with respect to it are considered as upper limits.
Abundance ratios with respect to CH3OH between different positions in L1551 IRS 5 North.
All Figures
|
Fig. 1 Continuum maps of the four FUor sources at 1.33 mm. In all panels the cross markers indicate the continuum peaks, i.e., the positions of the protostars, and the square markers indicate the pixels used to extract the spectra. In the case of L1551 IRS 5, the diamond markers indicate the positions of the alternative pixels used to examine potential spatial changes of the abundances (see Sect. 5.5). Panel a shows the map of L1551 IRS 5 centered on the position between the two protostars. The contours are at 8, 18, 44, 105, and 250σ with σ = 0.37 mJy beam−1. Panel b is the map of Haro 5a IRS with contours at 5, 12, 30, 75, and 186σ with σ = 0.22 mJy beam−1. Panel c is V346 Nor with contours at 5, 10, 23, 49, and 106σ with σ = 0.05 mJy beam−1. Panel d shows OO Ser with contours at 5, 12, 30, 75, and 186σ with σ = 0.22 mJy beam−1. |
| In the text | |
|
Fig. 2 Moment 1 maps of the different CH3OH transitions found in our targets (from top to bottom in increasing Eup). From left to right are L1551 IRS 5, Haro 5a IRS, V346 Nor, and OO Ser. The color scale of each target has been centered on the systemic velocity of the protostar (see Table 2), and is limited to ±3 km s−1 with respect to this velocity. The contours trace the continuum emission and are at the same levels as in Fig. 1. The star markers indicate the positions of the protostars. The beams are shown in the bottom left of each panel. The southern disk of L1551 IRS 5 is not seen in the maps as it is quite faint and its systemic velocity is bluer than the limits of the color scale of the plot. |
| In the text | |
|
Fig. 3 Integrated emission maps of a representative line for seven species on each of the FUor-type young stars. Each map has been centered around the peak of the continuum of the protostar. From top to bottom, the Eup values of the transitions are 108.3, 80.9, 111.5, 115.5, 175.3, 157.7, and 142.4 K. The contours trace the continuum emission and are at the same levels as in Fig. 1. |
| In the text | |
|
Fig. 4 Velocity field map (Moment 1) of the same representative transitions as in Fig. 3. The maps were generated with a 4σ clipping to minimize the noise in the resulting image. The velocities are clipped at ±3 km s−1. The velocities were centered on the vLSR of each target (see Table 2). The contours trace the continuum emission and are at the same levels as in Fig. 1. |
| In the text | |
|
Fig. 5 Moment 1 maps of the small molecules found in our targets. From left to right are L1551 IRS 5, Haro 5a IRS, OO Ser, and V346 Nor. The color scale of L1551 IRS 5 is centered around the average velocity of its two disks, while for the remainder of the targets the color scales have been centered on the systemic velocity of each protostar. All the color scales are limited to ±3 km s−1. The contours trace the continuum emission and are at the same levels as in Fig. 1. The beams are shown in the bottom left corner of each panel. |
| In the text | |
|
Fig. 6 Comparison of abundances between our four targets and other young stellar objects. The panels from left to right show the abundance ratios with respect to methanol based on CH318OH, 13CH3OH, and CH3OH. The sources considered to be or that have been in outburst (L1551 IRS 5 North, Haro 5a IRS, V346 Nor, OO Ser, VLA4A/B, HOPS 373SW, V883 Ori) are slightly shifted to the right, while the quiescent sources are shifted to the left. In the case of B335 we plotted two epochs, one from 2014 representing the quiescent state and another from 2016 when the source was bursting. We consider the abundance ratios calculated with respect to the main isotopolog of CH3OH as upper limits. |
| In the text | |
|
Fig. 7 Abundances of the four FUors and other young stellar objects with respect to different COMs. Here the symbols are also slightly shifted to the left or right if the source is considered to be quiescent or outbursting, respectively. |
| In the text | |
Current usage metrics show cumulative count of Article Views (full-text article views including HTML views, PDF and ePub downloads, according to the available data) and Abstracts Views on Vision4Press platform.
Data correspond to usage on the plateform after 2015. The current usage metrics is available 48-96 hours after online publication and is updated daily on week days.
Initial download of the metrics may take a while.