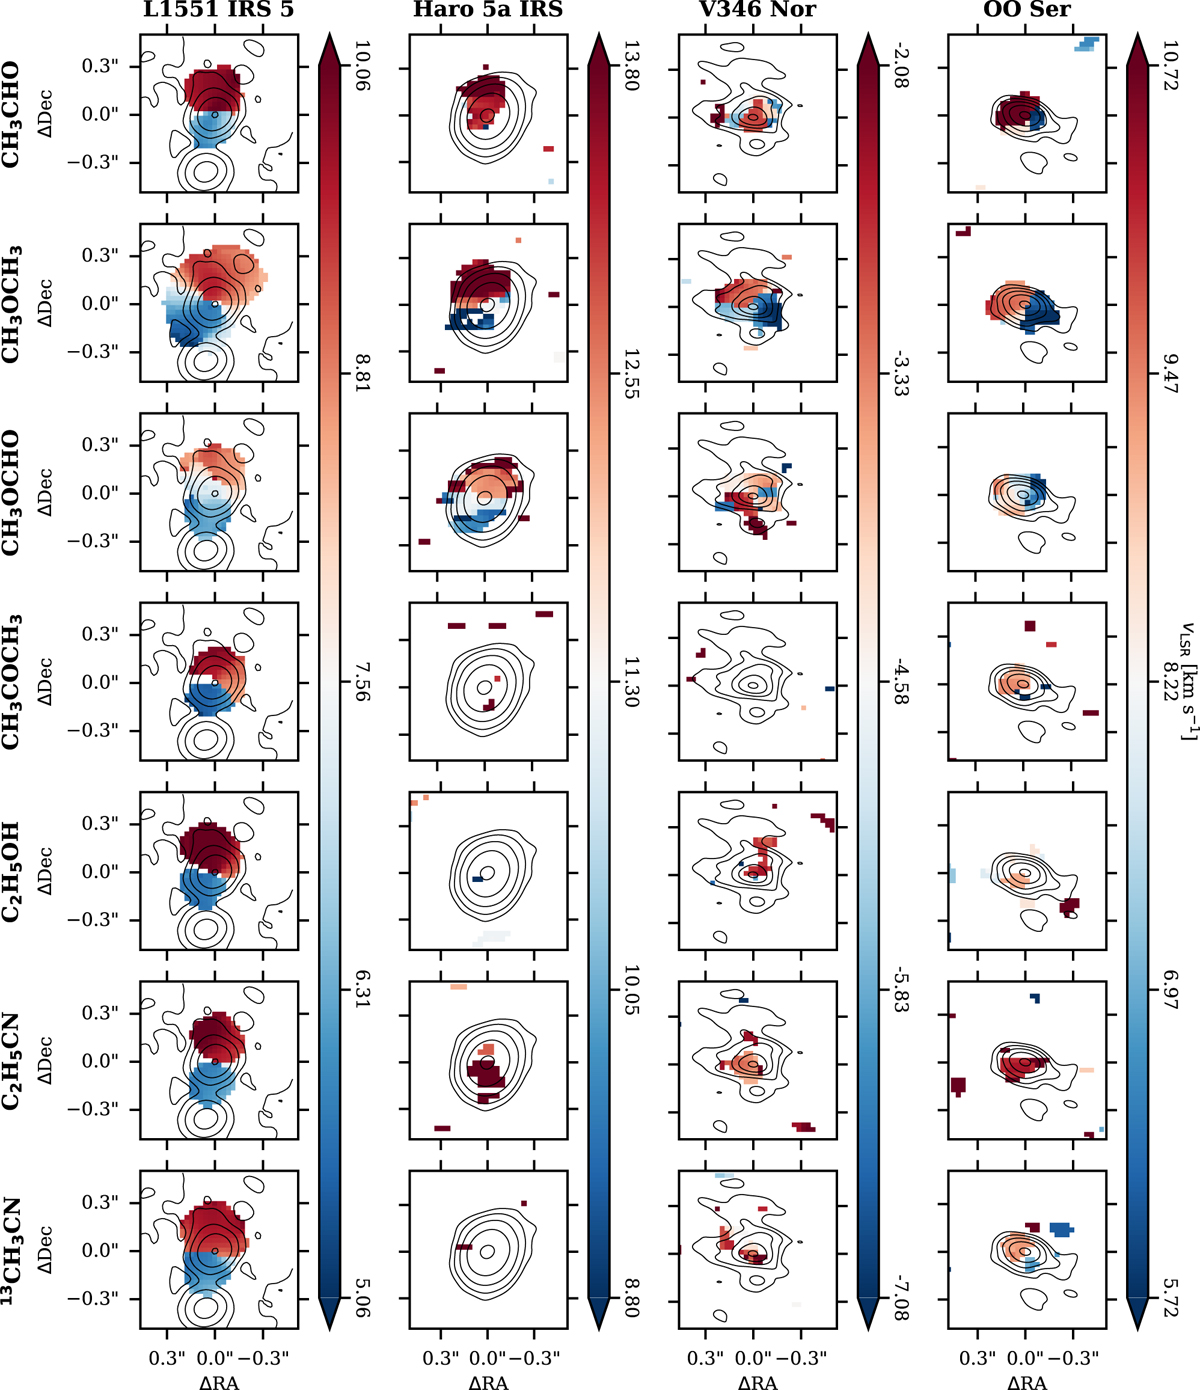
Fig. 4
Download original image
Velocity field map (Moment 1) of the same representative transitions as in Fig. 3. The maps were generated with a 4σ clipping to minimize the noise in the resulting image. The velocities are clipped at ±3 km s−1. The velocities were centered on the vLSR of each target (see Table 2). The contours trace the continuum emission and are at the same levels as in Fig. 1.
Current usage metrics show cumulative count of Article Views (full-text article views including HTML views, PDF and ePub downloads, according to the available data) and Abstracts Views on Vision4Press platform.
Data correspond to usage on the plateform after 2015. The current usage metrics is available 48-96 hours after online publication and is updated daily on week days.
Initial download of the metrics may take a while.