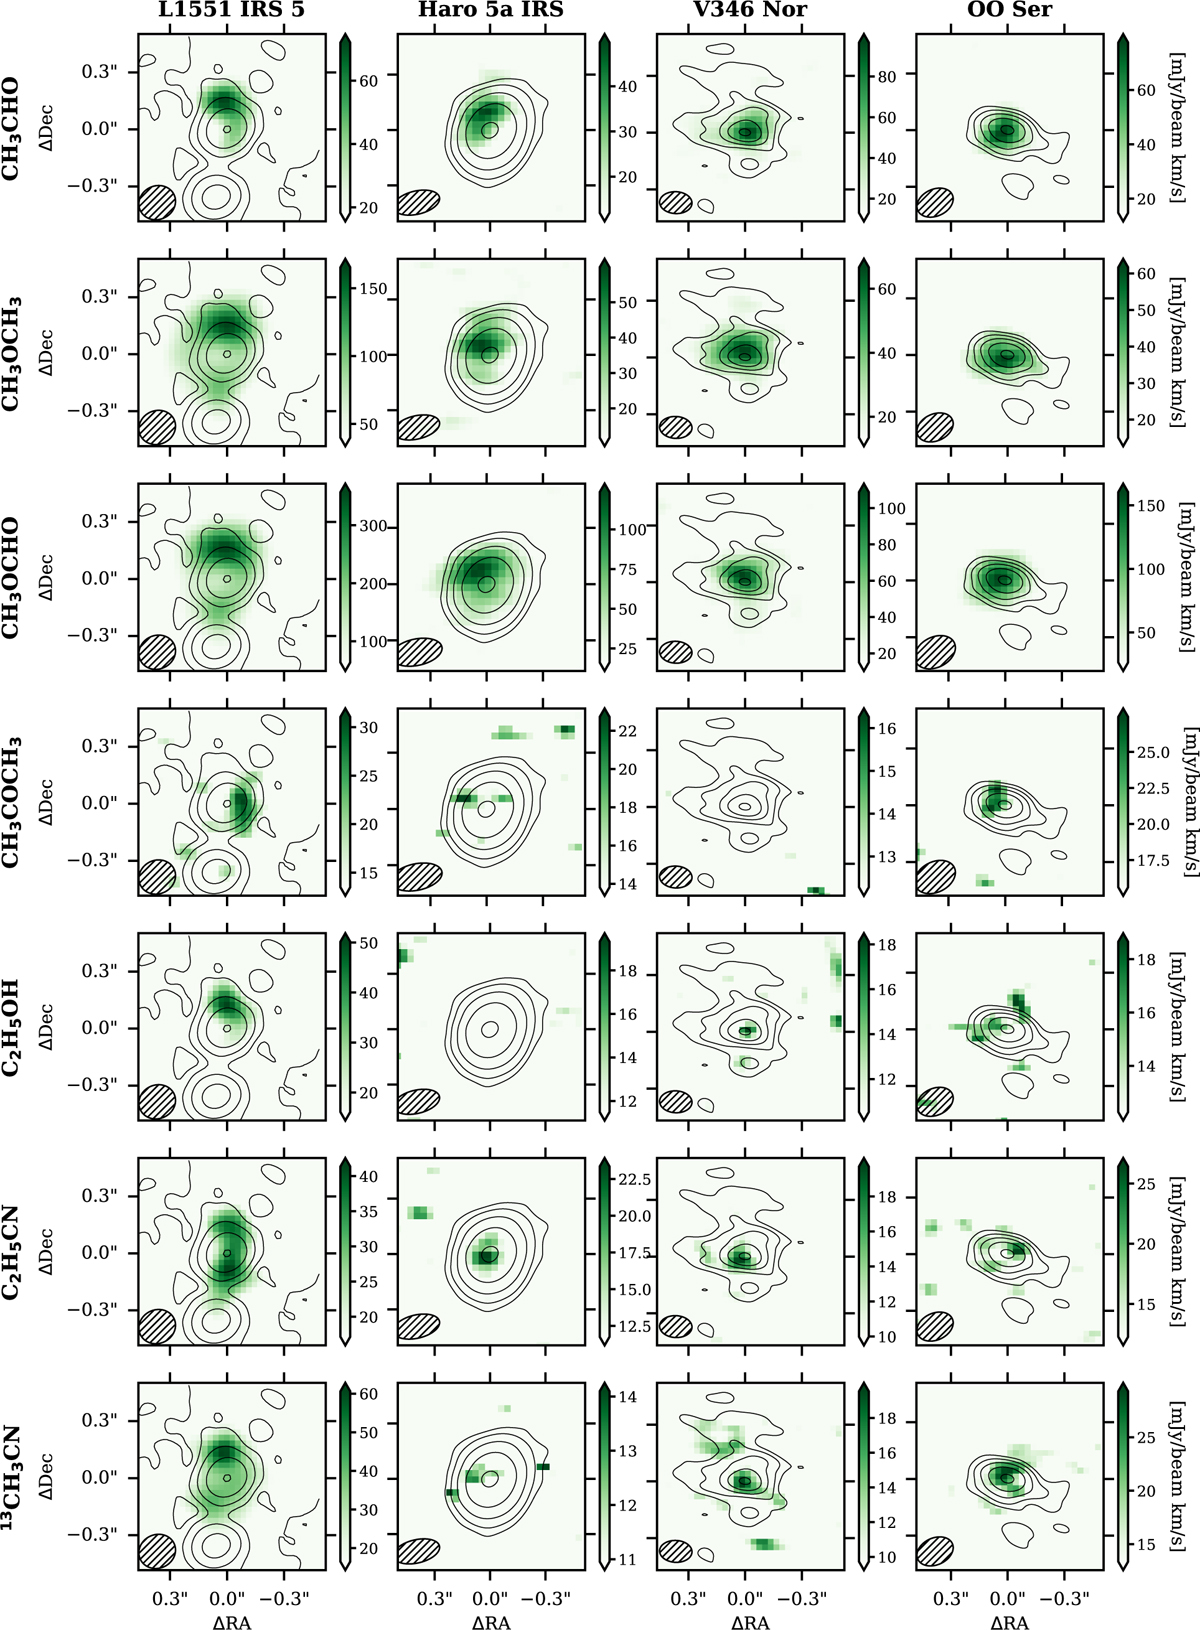
Fig. 3
Download original image
Integrated emission maps of a representative line for seven species on each of the FUor-type young stars. Each map has been centered around the peak of the continuum of the protostar. From top to bottom, the Eup values of the transitions are 108.3, 80.9, 111.5, 115.5, 175.3, 157.7, and 142.4 K. The contours trace the continuum emission and are at the same levels as in Fig. 1.
Current usage metrics show cumulative count of Article Views (full-text article views including HTML views, PDF and ePub downloads, according to the available data) and Abstracts Views on Vision4Press platform.
Data correspond to usage on the plateform after 2015. The current usage metrics is available 48-96 hours after online publication and is updated daily on week days.
Initial download of the metrics may take a while.