Fig. 5
Download original image
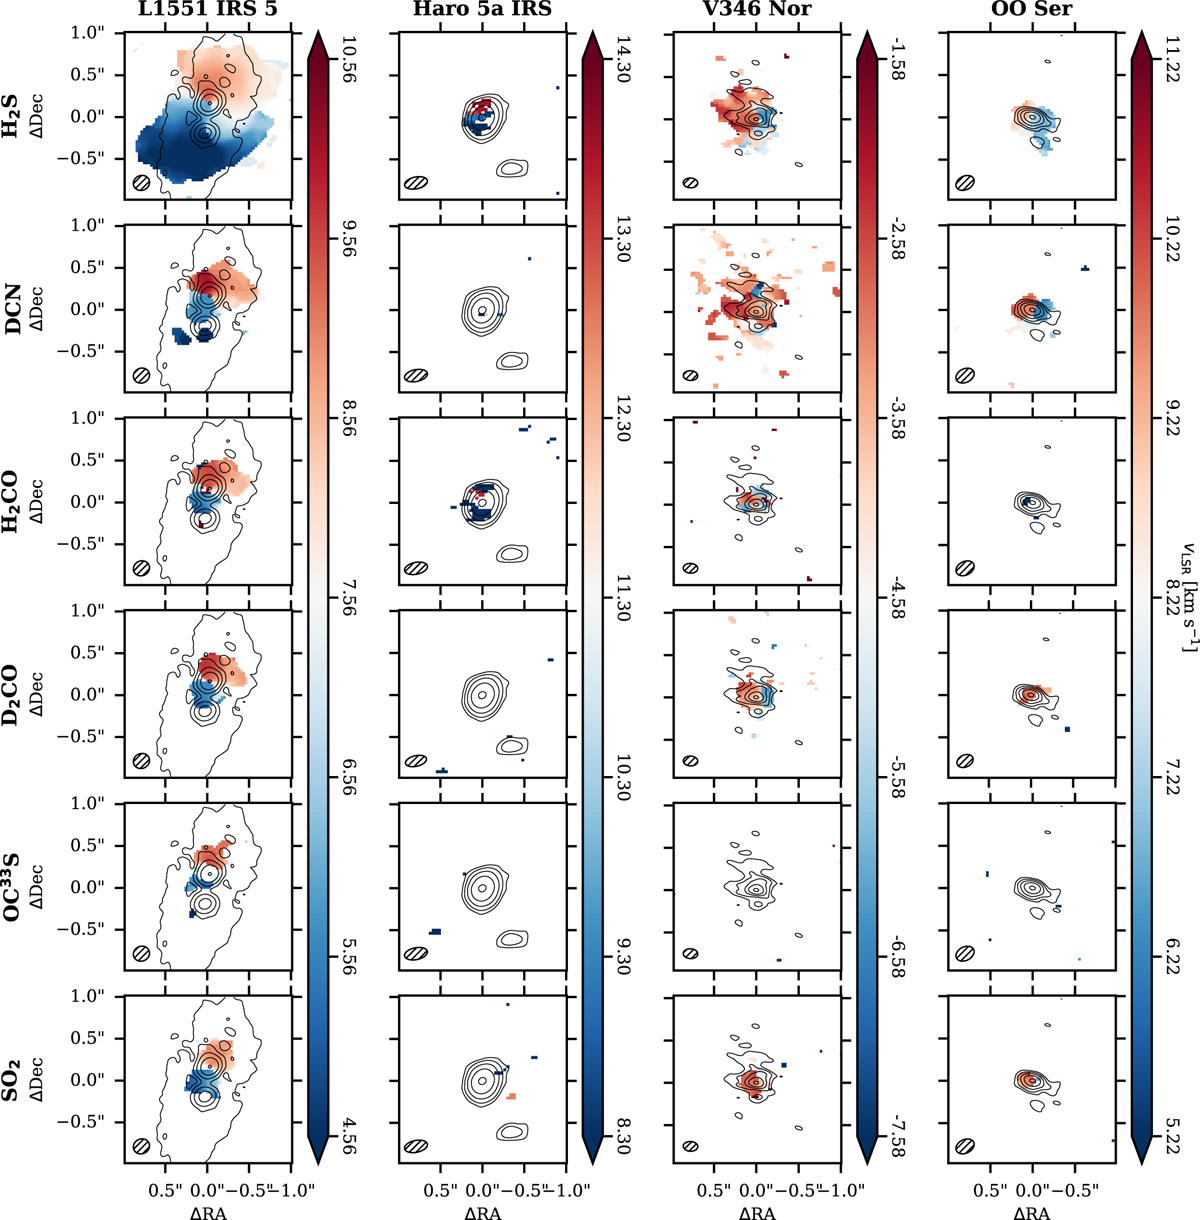
Moment 1 maps of the small molecules found in our targets. From left to right are L1551 IRS 5, Haro 5a IRS, OO Ser, and V346 Nor. The color scale of L1551 IRS 5 is centered around the average velocity of its two disks, while for the remainder of the targets the color scales have been centered on the systemic velocity of each protostar. All the color scales are limited to ±3 km s−1. The contours trace the continuum emission and are at the same levels as in Fig. 1. The beams are shown in the bottom left corner of each panel.
Current usage metrics show cumulative count of Article Views (full-text article views including HTML views, PDF and ePub downloads, according to the available data) and Abstracts Views on Vision4Press platform.
Data correspond to usage on the plateform after 2015. The current usage metrics is available 48-96 hours after online publication and is updated daily on week days.
Initial download of the metrics may take a while.