Fig. 1
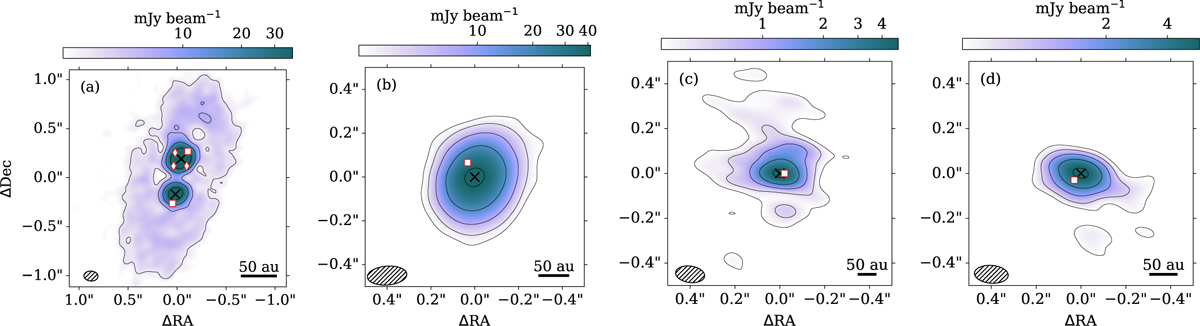
Download original image
Continuum maps of the four FUor sources at 1.33 mm. In all panels the cross markers indicate the continuum peaks, i.e., the positions of the protostars, and the square markers indicate the pixels used to extract the spectra. In the case of L1551 IRS 5, the diamond markers indicate the positions of the alternative pixels used to examine potential spatial changes of the abundances (see Sect. 5.5). Panel a shows the map of L1551 IRS 5 centered on the position between the two protostars. The contours are at 8, 18, 44, 105, and 250σ with σ = 0.37 mJy beam−1. Panel b is the map of Haro 5a IRS with contours at 5, 12, 30, 75, and 186σ with σ = 0.22 mJy beam−1. Panel c is V346 Nor with contours at 5, 10, 23, 49, and 106σ with σ = 0.05 mJy beam−1. Panel d shows OO Ser with contours at 5, 12, 30, 75, and 186σ with σ = 0.22 mJy beam−1.
Current usage metrics show cumulative count of Article Views (full-text article views including HTML views, PDF and ePub downloads, according to the available data) and Abstracts Views on Vision4Press platform.
Data correspond to usage on the plateform after 2015. The current usage metrics is available 48-96 hours after online publication and is updated daily on week days.
Initial download of the metrics may take a while.