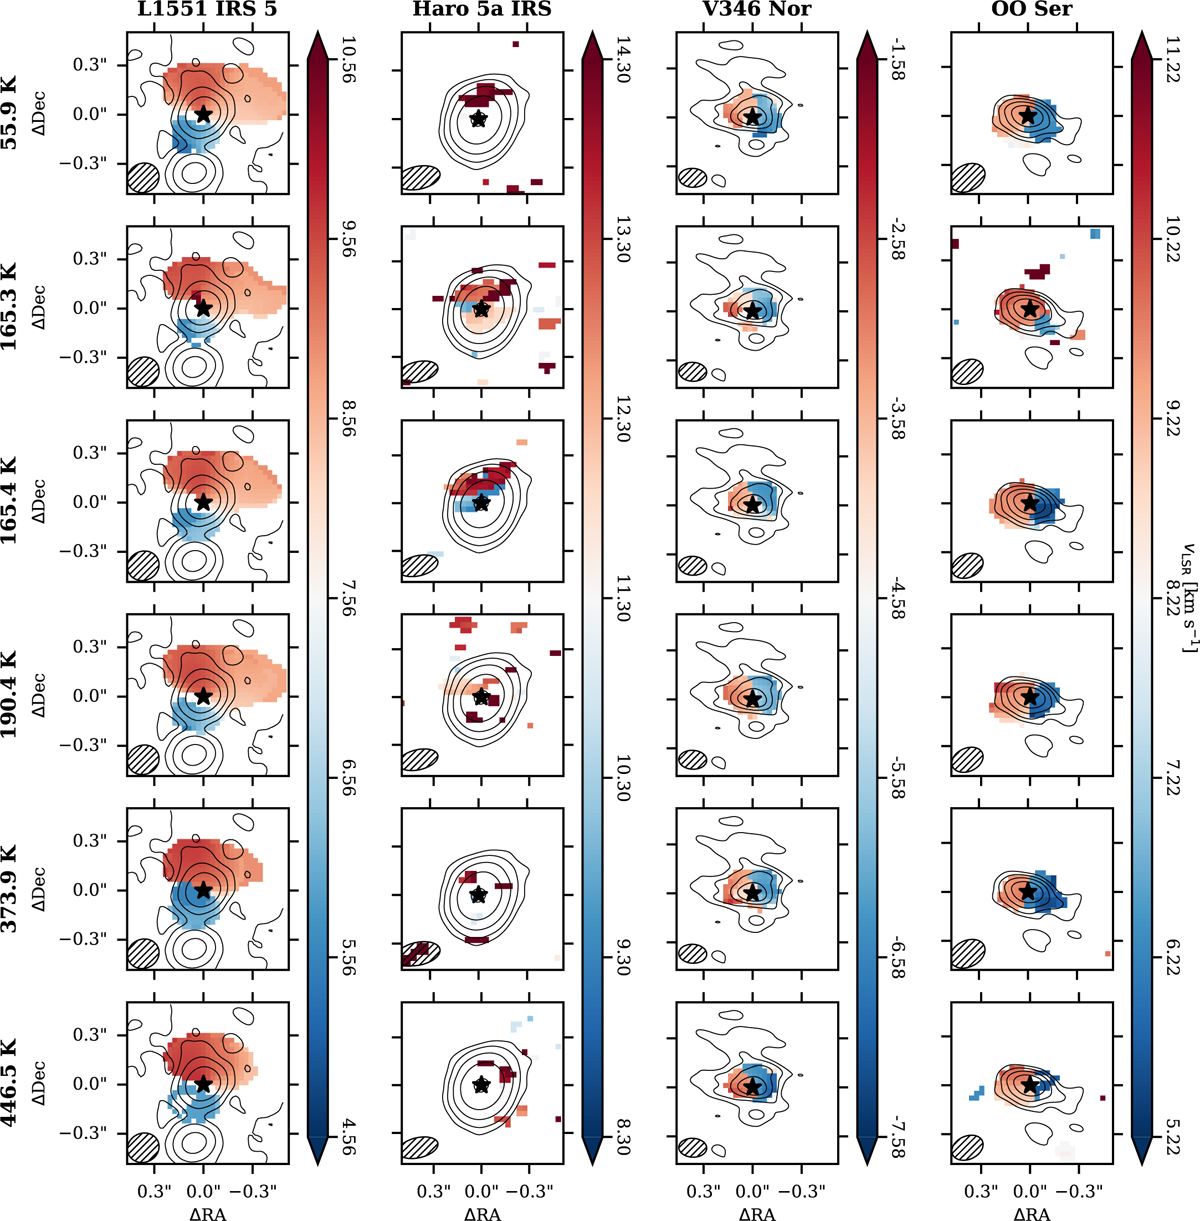
Fig. 2
Download original image
Moment 1 maps of the different CH3OH transitions found in our targets (from top to bottom in increasing Eup). From left to right are L1551 IRS 5, Haro 5a IRS, V346 Nor, and OO Ser. The color scale of each target has been centered on the systemic velocity of the protostar (see Table 2), and is limited to ±3 km s−1 with respect to this velocity. The contours trace the continuum emission and are at the same levels as in Fig. 1. The star markers indicate the positions of the protostars. The beams are shown in the bottom left of each panel. The southern disk of L1551 IRS 5 is not seen in the maps as it is quite faint and its systemic velocity is bluer than the limits of the color scale of the plot.
Current usage metrics show cumulative count of Article Views (full-text article views including HTML views, PDF and ePub downloads, according to the available data) and Abstracts Views on Vision4Press platform.
Data correspond to usage on the plateform after 2015. The current usage metrics is available 48-96 hours after online publication and is updated daily on week days.
Initial download of the metrics may take a while.