Fig. 1.
Download original image
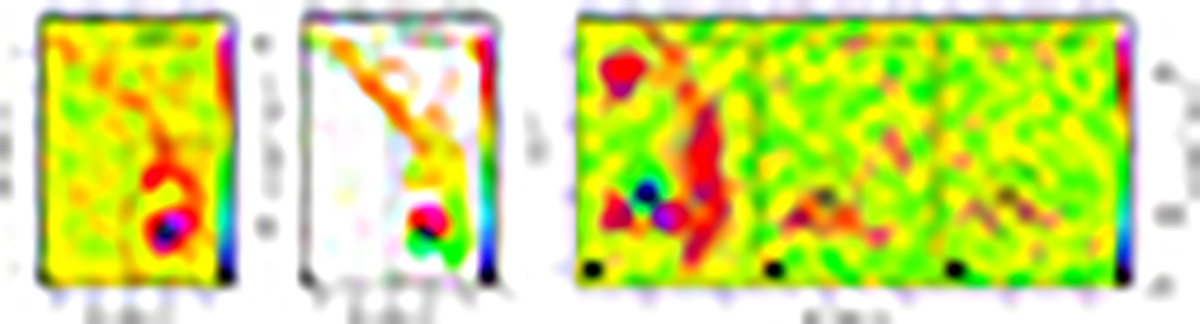
Streamer and disk of IRS 63 as probed by p-H2CO 3(0, 3)−2(0, 2), HDCO 4(1, 4)−3(1, 3), and o-D2CO 4(0, 4)−3(0, 3). From left to right: Panels A and B show the moment 0 and moment 1 maps of the H2CO emission. Panels C, D, and E show a zoom-in of H2CO, HDCO, and D2CO integrated intensity on the blueshifted velocity range [+2.0, +2.6] km s−1, which probes the terminal portion of the streamer impacting onto the disk. The map of HDCO covers a larger velocity range [+1.4, +2.6] km s−1 due to the larger channel width of the line cube (1.19 km s−1). The first contours and steps correspond to 3σ (0.5 mJy beam−1 km s−1).
Current usage metrics show cumulative count of Article Views (full-text article views including HTML views, PDF and ePub downloads, according to the available data) and Abstracts Views on Vision4Press platform.
Data correspond to usage on the plateform after 2015. The current usage metrics is available 48-96 hours after online publication and is updated daily on week days.
Initial download of the metrics may take a while.