Fig. B.1.
Download original image
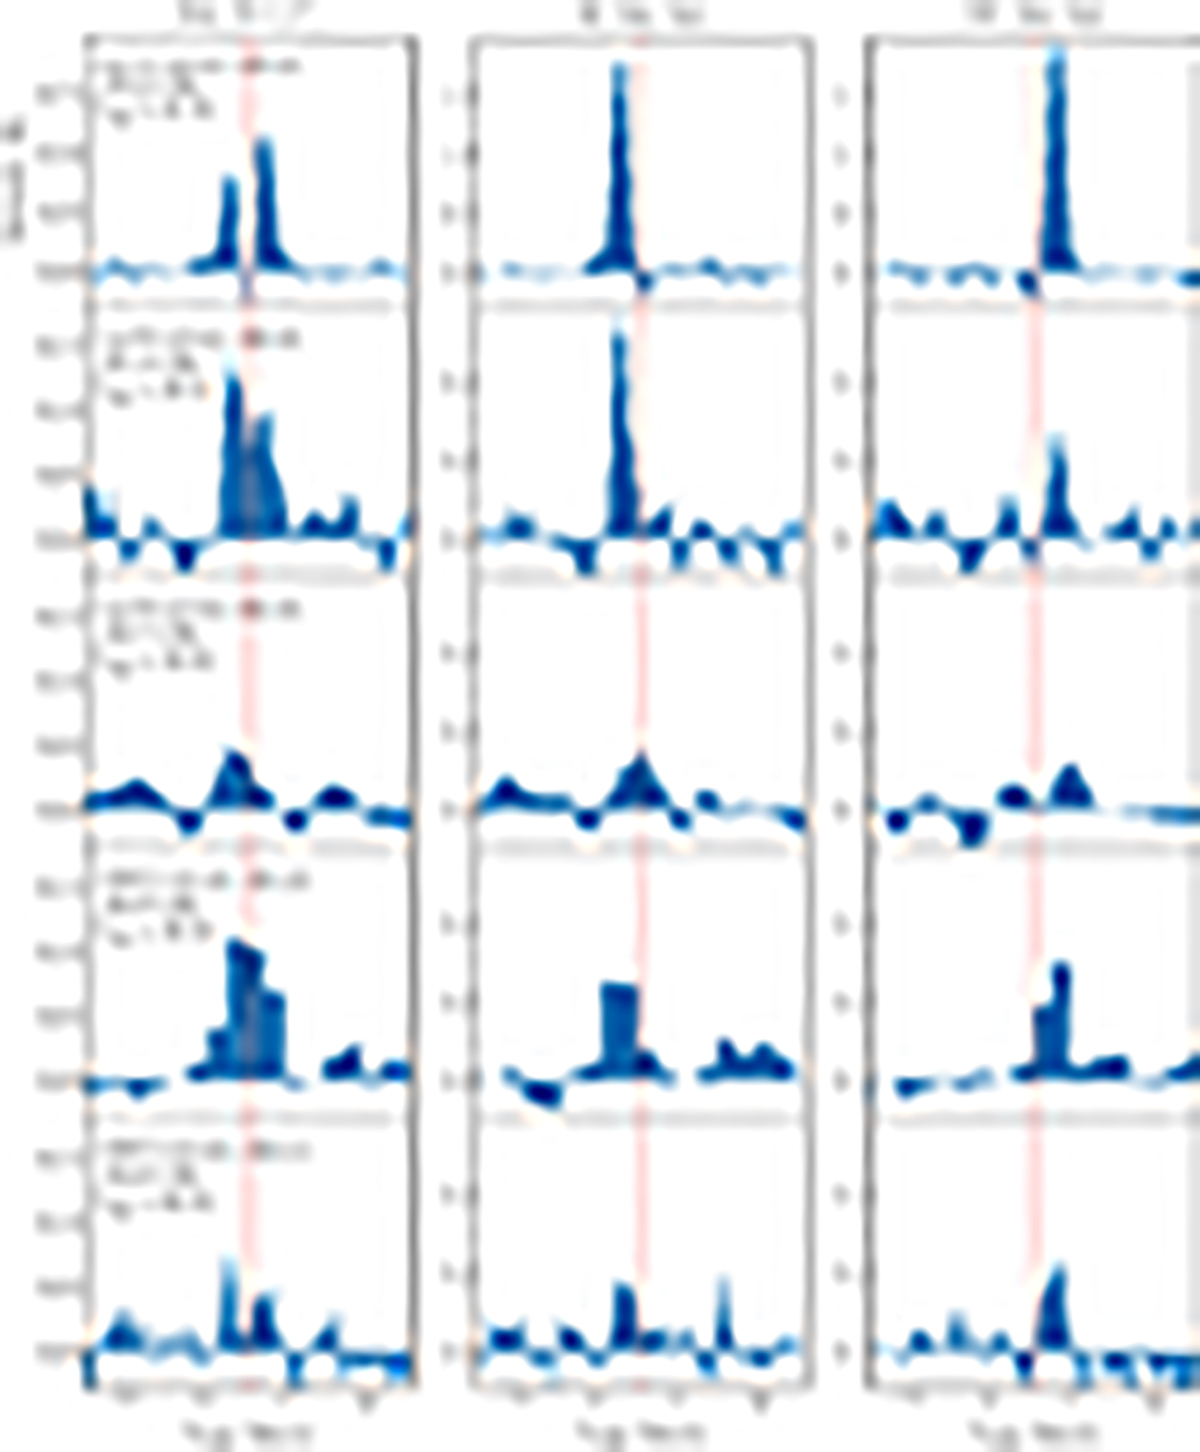
Spectra of the H2CO, HDCO, and D2CO lines integrated: on the entire disk (out to a radius of ![]() , 1st column), on the SE disk side (2nd column), on the NW disk side (3rd column). The red dashed line indicates the systemic velocity, VLSR = +2.8 km s−1. The line transition, frequency, and upper level energy are labeled on the upper-left of the panels in the first column.
, 1st column), on the SE disk side (2nd column), on the NW disk side (3rd column). The red dashed line indicates the systemic velocity, VLSR = +2.8 km s−1. The line transition, frequency, and upper level energy are labeled on the upper-left of the panels in the first column.
Current usage metrics show cumulative count of Article Views (full-text article views including HTML views, PDF and ePub downloads, according to the available data) and Abstracts Views on Vision4Press platform.
Data correspond to usage on the plateform after 2015. The current usage metrics is available 48-96 hours after online publication and is updated daily on week days.
Initial download of the metrics may take a while.