Fig. C.1.
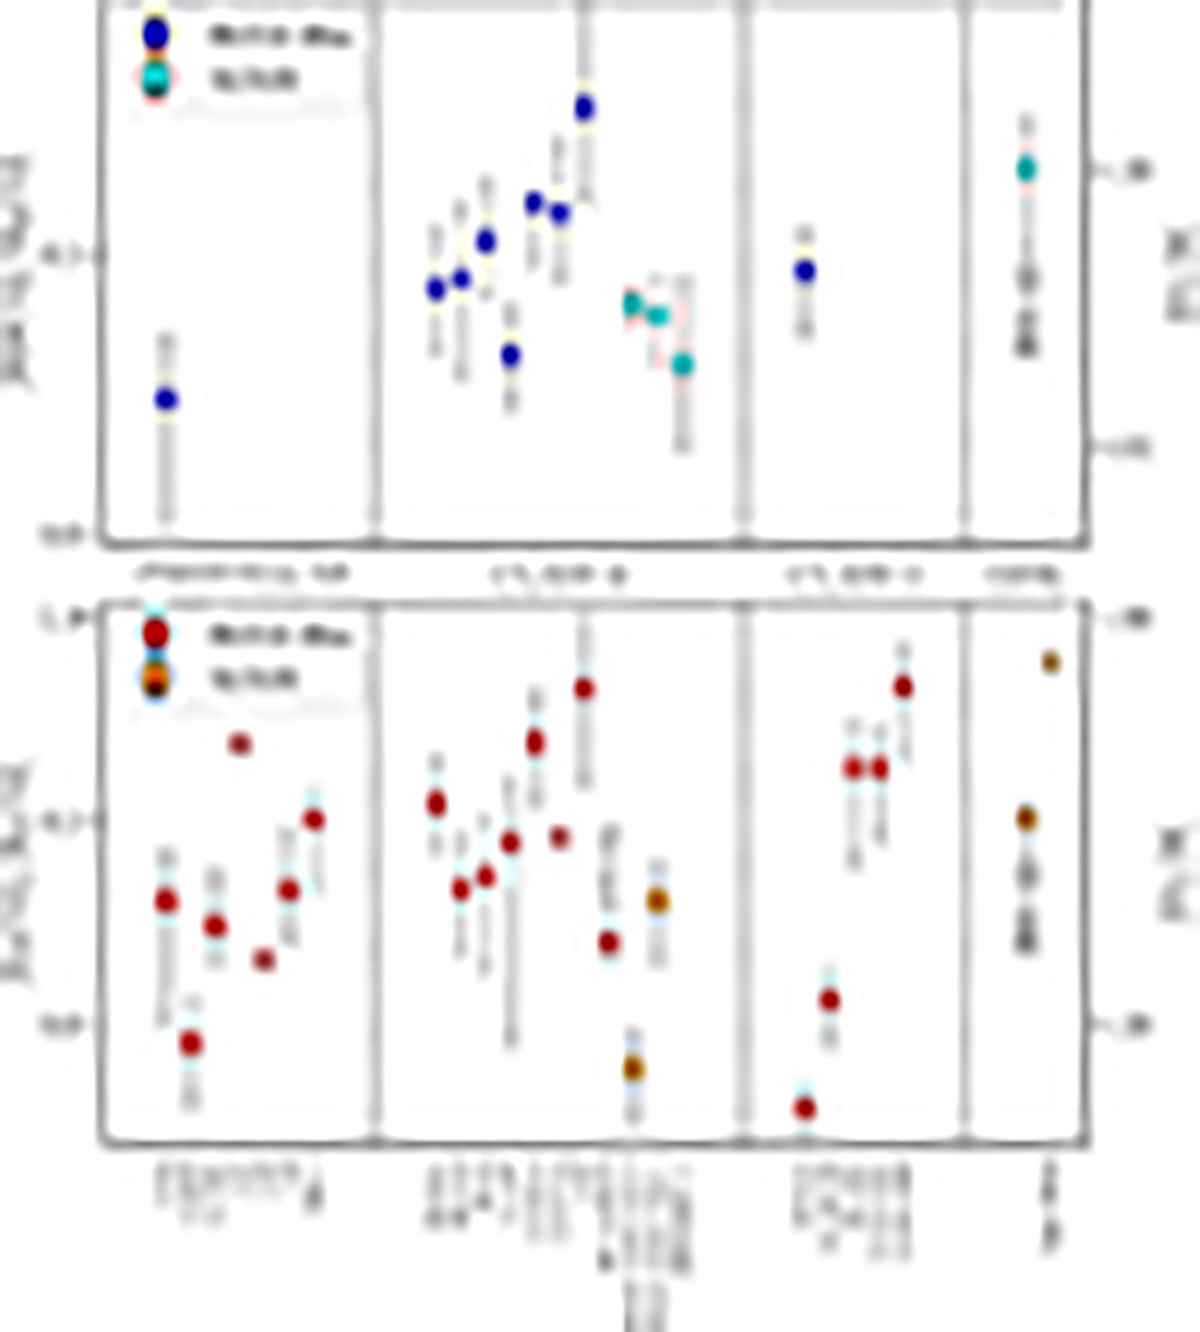
Download original image
Abundance ratios [HDCO]/[H2CO] (upper panel), and [D2CO]/[H2CO] (lower panel) estimated in prestellar cores (Chacón-Tanarro et al. 2019; Bacmann et al. 2003), in Class 0 (Parise et al. 2006; Watanabe et al. 2012; Persson et al. 2018; Manigand et al. 2020; Evans et al. 2023) and Class I (Bianchi et al. 2017; Mercimek et al. 2022) protostars, and in disks (van der Marel et al. 2021; Brunken et al. 2022), are compared with the values estimated in the disk of IRS 63 (this work). Blue and red circles indicate estimates obtained with IRAM-30m observations (with the exception of RCrA-IRS7B which is observed with ASTE-10m), while cyan and orange squares those obtained with ALMA. Upper limits are marked with triangles. In both panels the right y-axes indicate the corresponding [D]/[H] ratios. The source names are below the bottom panel.
Current usage metrics show cumulative count of Article Views (full-text article views including HTML views, PDF and ePub downloads, according to the available data) and Abstracts Views on Vision4Press platform.
Data correspond to usage on the plateform after 2015. The current usage metrics is available 48-96 hours after online publication and is updated daily on week days.
Initial download of the metrics may take a while.