Fig. 2.
Download original image
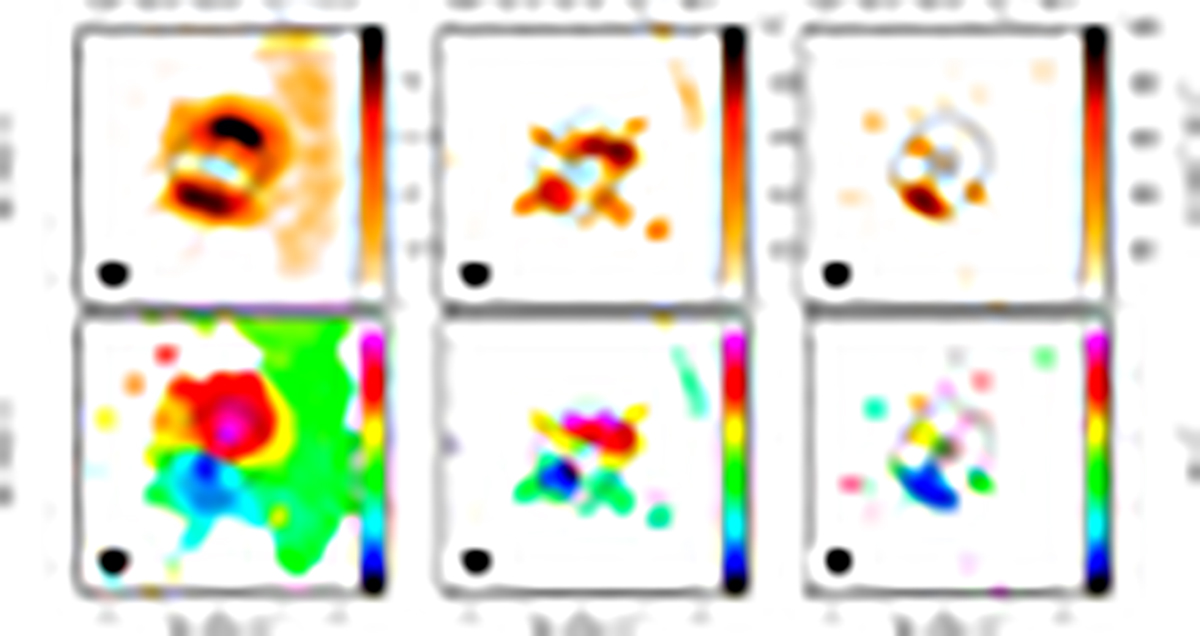
Zoom-in of the integrated intensity (moment 0, upper panels) and intensity weighted velocity (moment 1, lower panels) maps of the H2CO, HDCO, and D2CO line emission toward the IRS 63 disk (same transitions as in Fig. 1). The continuum emission at 1.3 mm is in black (contours from 10σ with steps of 500σ, with σ = 0.7 mJy beam−1). The transition and upper-level energy are labeled at the top, and the beam is shown in the lower left of each panel.
Current usage metrics show cumulative count of Article Views (full-text article views including HTML views, PDF and ePub downloads, according to the available data) and Abstracts Views on Vision4Press platform.
Data correspond to usage on the plateform after 2015. The current usage metrics is available 48-96 hours after online publication and is updated daily on week days.
Initial download of the metrics may take a while.