| Issue |
A&A
Volume 687, July 2024
|
|
|---|---|---|
| Article Number | A233 | |
| Number of page(s) | 15 | |
| Section | Interstellar and circumstellar matter | |
| DOI | https://doi.org/10.1051/0004-6361/202449711 | |
| Published online | 17 July 2024 | |
Unveiling the gas phase H2NCO radical: Laboratory rotational spectroscopy and interstellar searches in the direction of IRAS 16293-2422
1
Université Paris-Saclay, CNRS, Institut des Sciences Moléculaires d’Orsay,
91405
Orsay,
France
e-mail: marie-aline.martin@universite-paris-saclay.fr
2
Institut de Recherche en Astrophysique et Planétologie, Université de Toulouse, UT3-PS, CNRS, CNES,
9 av. du Colonel Roche,
31028
Toulouse Cedex 4,
France
3
Université Bordeaux, CNRS, Institut des Sciences Moléculaires,
33400
Talence,
France
4
Niels Bohr Institute, University of Copenhagen,
Øster Voldgade 5–7,
1350
Copenhagen K.,
Denmark
Received:
23
February
2024
Accepted:
7
May
2024
Context. The carbamoyl radical (H2NCO) is believed to play a central role in the ice-grain chemistry of crucial interstellar complex organic molecules such as formamide and acetamide. Yet, little is known about this radical, which remains elusive in laboratory gasphase experiments.
Aims. In order to enable interstellar searches of H2NCO, we have undertaken a mandatory laboratory characterisation of its pure rotational spectrum.
Methods. We report the gas-phase laboratory detection of H2NCO, produced by H-atom abstraction from formamide, using pure rotational spectroscopy at millimetre and submillimetre wavelengths. Millimetre-wave data were acquired using chirped-pulse Fourier-transform spectroscopy, while submillimetre-wave ones were obtained using Zeeman-modulated spectroscopy. Experimental measurements were guided by quantum-chemical calculations at the ωB97X-D/cc-pVQZ level of theory. Interstellar searches for the radical have been undertaken in the Protostellar Interferometric Line Survey (PILS) towards the solar-type protostar IRAS 16293-2422.
Results. From the assignment and fit of experimental transitions up to 660 GHz, reliable spectroscopic parameters for H2NCO in its ground vibrational state have been derived, enabling accurate spectral predictions. No transitions of the radical were detected in the PILS survey. The inferred upper limit shows that the H2NCO abundance is at least 60 times below that of formamide and 160 times below that of HNCO in this source; a value that is in agreement with predictions from a physico-chemical model of this young protostar.
Key words: astrochemistry / methods: laboratory: molecular / techniques: spectroscopic / ISM: abundances / submillimeter: general
© The Authors 2024
 Open Access article, published by EDP Sciences, under the terms of the Creative Commons Attribution License (https://creativecommons.org/licenses/by/4.0), which permits unrestricted use, distribution, and reproduction in any medium, provided the original work is properly cited.
This article is published in open access under the Subscribe to Open model. Subscribe to A&A to support open access publication.
1 Introduction
Alongside isocyanic acid (HNCO) and formamide (H2NCHO), the carbamoyl radical (H2NCO, also known such as NH2CO and carbamyl in the literature) is one of the simplest molecules that incorporates the four atomic elements vital for biological systems; namely, C, H, O, and N. Because it contains a peptide bond (NH−C(=O)−), it holds significant potential as a key molecular precursor under prebiotic and abiotic conditions (e.g. Poskrebyshev 2017). H2NCO is found, both experimentally and theoretically, to be of key importance in the ice-grain chemical networks of interstellar complex organic molecules (iCOMs; e.g. Haupa et al. 2019). Its formation under interstellar conditions is best explained by reactions occurring on grains; namely, H-atom abstraction from formamide (e.g. Förstel et al. 2016; Haupa et al. 2019), H-addition to HNCO (e.g. Miller & Melius 1992; Song & Kästner 2016), or to a lesser extent by the reaction between NH2 and CO (e.g. Agarwal et al. 1985; Bredehöft et al. 2017; Ligterink et al. 2018b). These sequences have been incorporated into current chemical models of gas-grain chemistry (Garrod et al. 2022; Belloche et al. 2019). Once formed, the H2NCO radical is believed to be a central intermediate in the formation of many interstellar molecules, from formamide (Raunier et al. 2004; Haupa et al. 2019) and HNCO (Hubbard et al. 1975) to larger amides and many iCOMs such as urea (NH2C(O)NH2, Agarwal et al. 1985; Ligterink et al. 2018b; Raunier et al. 2004; Slate et al. 2020), acetamide (CH3C(O)NH2 Ligterink et al. 2018b; Belloche et al. 2019; Garrod et al. 2022; Zeng et al. 2023), propiolamide (NH2C(O)C2H, Alonso et al. 2021), and acrylamide (NH2C(O)C2H3, Kolesniková et al. 2022). This common chemistry also potentially explains the observed correlations of the abundances of numerous iCOMs (see, e.g. Bisschop et al. 2007; López-Sepulcre et al. 2015; Gorai et al. 2020; Ligterink et al. 2022). Additionally, besides the aforementioned species, other molecules that contain the NCO bond – and that could thus be related to H2NCO – have already been detected in the interstellar medium; namely, the NCO radical (Marcelino et al. 2018), N-protonated isocyanic acid H2NCO+ (Gupta et al. 2013), methyl isocyanate CH3NCO (Halfen et al. 2015; Cernicharo et al. 2016), and ethyl isocyanate C2H5NCO (Rodríguez-Almeida et al. 2021).
In contrast to the vast amount of literature investigating H2NCO formation and reactivity, only a few studies have reported a direct detection of the species, all of which were condensed phase investigations. In the late 1960s, the radical was observed using electron paramagnetic resonance spectroscopy. However, some ambiguity persisted regarding the observed isomer, either a σ-electron radical (hence H2NCO, Livingston & Zeldes 1967; Yonezawa et al. 1968, 1969) or a π-electron one (HNCHO, Smith & Wood 1966; Fox & Smith 1968). The latter possibility was later deemed unlikely (Andrews 1970). More recently, matrix isolation experiments have enabled the observation of the infrared spectrum of the radical, produced by H-addition to HNCO (Pettersson et al. 1999) or H-abstraction from formamide (Haupa et al. 2019). The vibrational band assignments were supported by quantum chemical calculations (Pettersson et al. 1999). Other theoretical studies have also dived into the energetics of the [C,H2,N,O] isomeric family (Shapley & Bacskay 1999) and the thermochemistry of H2NCO (Shapley & Bacskay 1999; Nagy et al. 2010; Poskrebyshev 2015, 2017; Nguyen et al. 1996).
We here report the first detection of H2NCO in gas-phase laboratory experiments. The radical was produced by H-atom abstraction from formamide and its pure rotational spectrum was recorded at millimetre and submillimetre wavelengths, as is described in Sec. 2. Spectroscopic analysis of the experimental data has enabled the construction of a robust line frequency catalogue that was used to search for the radical towards the solar-type protostar IRAS 16293-2422 (Sec. 3).
2 Laboratory methods
2.1 Quantum chemical calculations
To initiate laboratory searches for transitions of H2NCO, quantum chemical calculations have been performed on the species. Geometry optimisation followed by harmonic and anharmonic frequency analysis have been carried out at the ωB97X-D/cc-pVQZ level of theory (Chai & Head-Gordon 2008; Dunning 1989; Woon & Dunning 1993), providing a reliable set of spectroscopic parameters (dipole moment projections; rotational, quartic, and sextic centrifugal distortion, spin-rotation (SR), and hyperfine constants). Special care was taken to ensure that the calculations of vibration-rotation quantities were performed in the principal axis system, as was recommended in McKean et al. (2008). Using Bayesian-corrected rotational constants – following Lee & McCarthy (2020) – the spectral predictions are expected to be very close to the experimental features, as has previously been seen in Buchanan et al. (2021) and Martin-Drumel et al. (2023). All of the calculations were performed using the Gaussian 16 suite of electronic structure programs (Frisch et al. 2016).
2.2 Synthesis of H2NCO
The H2NCO radical was produced by H-abstraction from formamide (≥99.5%, Merck), a reaction initiated by F atoms themselves produced by a 50 W microwave discharge in F2 (5% in He, Air Liquide). The process is similar to the one used in our previous works on CH2OH, CH2CN, and CH2CHO radicals (Chitarra et al. 2020, 2022; Coudert et al. 2022; Chahbazian et al. 2024). The two reaction cells used to synthesise and probe the radical have been presented in detail in Chitarra et al. (2022): both are 50 mm diameter cells mainly made of Pyrex, each adapted to one of our two spectrometers. The cell used for millimetre-wave chirped-pulse (CP) measurements is of about 70 cm total length and equipped with one inlet for F-injection, while the one used for submillimetre-wave measurements is about 2 m-long and equipped with three F-injection inlets. Using both cells, measurements were performed in a continuous flow ensured by a roots blower (EH250, Edwards), backed up by a chemically graded pump (PFPE-E2M28, Edwards). Since a second potential primary product of the reaction of H-abstraction from formamide is the HNCHO radical, if abstraction occurs on the nitrogen atom instead of the carbon one, initial searches for the signatures of both radicals were performed using various pressure ratios of formamide and F2:He mixture. The best signal of the H2NCO radical was obtained using a pressure of 5 μbar of formamide for a total pressure of 11 μbar. It is worth noting that the quoted pressures are only indicative as the pressure gauge was placed above the roots blower using a DN16 inlet, far downstream from the probed reaction cell, in order to preserve it from reactive products. Under these conditions, the pressure was similar with and without discharge.
2.3 Chirped-pulse millimetre-wave spectroscopy
A CP Fourier-transform millimetre-wave (CP-FTMMW, Bright-spec) instrument was used to perform measurements in the 75–110 GHz spectral region (W band). Spectra were acquired using a segmented approach implemented in the high dynamic range mode of the Brightspec Edgar acquisition software, as was previously detailed in Chitarra et al. (2022). Initial searches were performed for both H2NCO and HNCHO radicals using 500 000 averaged free induction decays, or FIDs (about 1 hour of acquisition) obtained using a pulse length of 0.5 μs. All of the measurements were repeated under the same conditions after placing a permanent magnet below the volume of the cell in which the precursors interact, allowing us to identify transitions affected by the magnetic field. Once the signal of H2NCO was found, multiple spectra were acquired under conditions found to maximise the production of this radical (5 μbar of formamide and 6 μbar of F2/He, 0.25 μs excitation pulse). The FID signals were acquired over 4 μs, starting 0.1 μs after the end of the excitation pulse. To retrieve frequency domain spectra, the FIDs were Fourier-transformed using a Kaiser-Bessel apodisation function over the first 2 μs since a Fourier transform over shorter FIDs yields a significant gain in the signal-to-noise ratio – at the expense of the spectral resolution – which, under our experimental conditions, has proven useful in detecting weak features in the spectra. The final spectrum was averaged in the frequency domain and corresponds to 2.9 million FIDs (again, a similar spectrum was recorded with a permanent magnet placed below the reaction cell). The resulting line frequency accuracies are estimated to be 100 kHz for strong, isolated lines and 200 kHz for weaker and/or broader ones.
2.4 Zeeman-modulated submillimetre-wave spectroscopy
The Zeeman-modulated submillimetre-wave spectrometer used in this study, which is an evolution from the double-modulation spectrometer that we used previously (Chitarra et al. 2022), has been presented in detail in Chahbazian et al. (2024). A radio-frequency synthesiser (Rhode & Schwarz), whose 10 MHz reference signal is provided by a Rubidium clock (Stanford Research), feeds a frequency multiplication chain (Virginia Diode Inc.) nominally operating over the 75–900 GHz range. In this study, measurements were performed from 140 GHz to 660 GHz using a single path configuration in which the radiation is collimated by a Teflon lens (100 mm focal length), transmitted through the reaction cell, and focused onto the detector using either an identical Teflon lens or, above 330 GHz, an off-axis parabolic mirror (300 mm focal length). Schottky diode detectors (VDI) were used in the 140–220 GHz and 220–330 GHz spectral ranges and a mechanically cooled Indium antimonide (InSb) bolometer (QMC) was employed above 330 GHz. Additionally, in the 140–220 GHz range, the output radiation from the VDI chain was attenuated by about 30% (Elmika, WR5 VA-015E), which was found to minimise the strong Fabry-Perot effect on the baseline without affecting the signal-to-noise ratio of the transitions. To operate under Zeeman modulation conditions, a 16.9 kHz sinusoidal signal – generated by a waveform generator followed by an audio amplifier – circulates in a coil surrounding the reaction cell, resulting in an alternating magnetic field of about 3.5 Gauss. The signal received by the detector is then demodulated by a lock-in amplifier at the frequency of this sinusoidal signal.
The pressure conditions found to maximise the signal of the H2NCO radical using CP spectroscopy were found to also yield to the maximum of signal in Zeeman-modulated spectroscopy. Surveys around the regions where clusters of lines of H2NCO were expected have been recorded. Thanks to the Zeeman modulation settings, broad spectral windows, from 100 MHz to 10 GHz, were scanned in a straightforward fashion, without being affected by the signal of the precursor and the saturation effects it would have induced in the lock-in amplifier in frequency-modulated or double-modulation spectroscopy, as was shown already in Chahbazian et al. (2024). The spectra were acquired using frequency steps of 100 kHz below 440 GHz, and 200 kHz above that value. Below 330 GHz and above 440 GHz, each frequency point was averaged between 200 ms and 400 ms. In the 330–440 GHz range where the signal-to-noise ratio on H2NCO was the strongest (a combination of the Boltzmann population, power of the source, sensitivity of the bolometer, and amplitude of the Zeeman splitting with respect to the width of the line), 50 ms averages were enough to reach an excellent signal-to-noise ratio for most lines taking values of (20–50). Finally, dedicated searches for weak b-type transitions (see Sec. 3.1) were performed in the 330–660 GHz region using a 5 s averaging time.
It is worth mentioning that the profiles of many H2NCO lines (in particular Ka = 2 ones) appear to be severely impacted by the effect of the magnetic field on the SR structure, which results in some very asymmetrical profiles. This became particularly noticeable above 330 GHz, where the signal-to-noise ratio is the strongest. We found that we could minimise this effect by positioning a polarising grid (pure wave polarisers) right after the radiation source in order to filter out the small portion of non-vertically polarised radiation emitted. A second polarising grid, also selecting vertical polarisation, was placed in front of the bolometer but its effect was not as significant, presumably because the bolometer sensor is not very sensitive to the polarisation of the radiation. A conservative frequency uncertainty has been used for transitions exhibiting asymmetric profiles. Overall, these uncertainties range from 50 kHz (from intense, symmetric lines) to 300 kHz (for weak, broad, or asymmetric lines) over the entire covered spectral range.
3 Results and discussion
3.1 Spectroscopic considerations
The H2NCO radical is planar and belongs to the Cs point group of symmetry. The molecular structure and geometrical parameters calculated in this study are displayed in Fig. 1. The calculated bond lengths and angles are in good agreement with those reported in the literature (Pettersson et al. 1999; Shapley & Bacskay 1999), although we suspect that there was some exchange in the values pertaining to each H atom in Fig. 8 of Pettersson et al. (1999). The radical possesses dipole moment projections of 3.7 Debye along the a axis of symmetry and 0.5 Debye along the b one.
H2NCO possesses a 2A′ electronic ground state and nine normal modes of vibration following the irreducible representation Γ = 7A′ + 2A″ (see Appendix A for vibrational frequencies and α values in the vibrationally excited states). It is a near-prolate asymmetric-top rotor with a Ray’s asymmetry parameter κ = −0.98. Due to the presence of an unpaired electron (S = 1/2) and three atoms with a non-zero nuclear spin (N, H1, and H2; with IN = 1 and ![$\[I_{\mathrm{H}_1}=I_{\mathrm{H}_2}=1 / 2\]$](/articles/aa/full_html/2024/07/aa49711-24/aa49711-24-eq1.png) ), each rotational energy level of
), each rotational energy level of ![$\[N_{K_a, K_c}\]$](/articles/aa/full_html/2024/07/aa49711-24/aa49711-24-eq2.png) quantum numbers is split by electron SR coupling (into a fine structure of J sub-levels) and hyperfine couplings (with hyperfine levels labelled using F1, F2, F quantum numbers). For all non-zero nuclear spin atoms, the hyperfine structure results from coupling between the electron spin and the nuclear spin. Additionally, for the 14N nucleus, there is also nuclear quadrupole coupling. Because the two protons are non-equivalent, this leads to a maximum of 24 sub-levels following the coupling scheme J = N + S, F1 = J + IN, F2 = F1 +
quantum numbers is split by electron SR coupling (into a fine structure of J sub-levels) and hyperfine couplings (with hyperfine levels labelled using F1, F2, F quantum numbers). For all non-zero nuclear spin atoms, the hyperfine structure results from coupling between the electron spin and the nuclear spin. Additionally, for the 14N nucleus, there is also nuclear quadrupole coupling. Because the two protons are non-equivalent, this leads to a maximum of 24 sub-levels following the coupling scheme J = N + S, F1 = J + IN, F2 = F1 + ![$\[\mathbf{I}_{\mathrm{H}_1}\]$](/articles/aa/full_html/2024/07/aa49711-24/aa49711-24-eq3.png) , and F = F2 +
, and F = F2 + ![$\[\mathbf{I}_{\mathrm{H}_2}\]$](/articles/aa/full_html/2024/07/aa49711-24/aa49711-24-eq4.png) .
.
In the present work, we observed some transitions presenting a fully resolved hyperfine structure. The effective Hamiltonian used to model the energy levels of the vibronic ground state is thus ![$\[\mathscr{H}=\mathscr{H}_{\text {rot }}+\mathscr{H}_{\mathrm{sr}}+\mathscr{H}_{\mathrm{hfs}, \mathrm{N}}+\mathscr{H}_{\mathrm{hfs}, \mathrm{H}_1}+\mathscr{H}_{\mathrm{hfs}, \mathrm{H}_2}\]$](/articles/aa/full_html/2024/07/aa49711-24/aa49711-24-eq5.png) , where
, where ![$\[\mathscr{H}_{\text {rot }}\]$](/articles/aa/full_html/2024/07/aa49711-24/aa49711-24-eq6.png) is the Hamiltonian operator for the rotational energy,
is the Hamiltonian operator for the rotational energy, ![$\[\mathscr{H}_{\text {sr }}\]$](/articles/aa/full_html/2024/07/aa49711-24/aa49711-24-eq7.png) that for the electron SR,
that for the electron SR, ![$\[\mathscr{H}_{\mathrm{hfs}, \mathrm{N}}\]$](/articles/aa/full_html/2024/07/aa49711-24/aa49711-24-eq8.png) is the hyperfine Hamiltonian for the 14N nucleus (and accounts for nuclear magnetic and nuclear quadrupole interactions), and
is the hyperfine Hamiltonian for the 14N nucleus (and accounts for nuclear magnetic and nuclear quadrupole interactions), and ![$\[\mathscr{H}_{\mathrm{hfs}, \mathrm{H}_1}\]$](/articles/aa/full_html/2024/07/aa49711-24/aa49711-24-eq9.png) and
and ![$\[\mathscr{H}_{\mathrm{hfs}, \mathrm{H}_2}\]$](/articles/aa/full_html/2024/07/aa49711-24/aa49711-24-eq10.png) are the hyperfine structure Hamiltonians accounting for the coupling of the spins of the two protons, H1 and H2, with the spin of the unpaired electron. The calculated spectroscopic parameters of this effective Hamiltonian are reported in Table 1.
are the hyperfine structure Hamiltonians accounting for the coupling of the spins of the two protons, H1 and H2, with the spin of the unpaired electron. The calculated spectroscopic parameters of this effective Hamiltonian are reported in Table 1.
Because H2NCO is a light species, its pure rotational spectrum extends far into the submillimetre-wave domain, even at low temperatures, as is illustrated in Fig. 2. The spectral regions investigated in this study are highlighted in the figure. Due to the dipole moment projection values, a-type transitions dominate the spectrum; b-type transitions are visible in the high-frequency tail of the spectra.
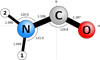 |
Fig. 1 Equilibrium structure of H2NCO calculated at the ωB97X-D/cc-pVQZ level of theory. Geometrical parameters (bond lengths in angstroms and angles in degrees) and principal axes of inertia are reported. The figure was generated using the PMIFST software from the PROSPE collection of programs developed by Kisiel (2001). 1 and 2 refer to the H1 and H2 labelling used in the text. |
Spectroscopic parameters of H2NCO in the S-reduction and relevant fit information.
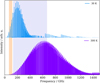 |
Fig. 2 Predicted pure rotational spectrum of H2NCO (in the ground vibrational state, υ = 0) up to 1.5 THz at 30 K (top) and 300 K (bottom). The spectral regions investigated in this study using the CP and Zeeman-modulated spectrometers are highlighted in orange and purple, respectively. |
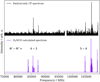 |
Fig. 3 CP-FTMMW spectrum after data treatment, allowing the identification of transitions from radical species (top trace) and comparison with predictions for H2NCO (υ = 0, 300 K) from the quantum chemical calculations performed in this study. The discontinuity in the experimental trace corresponds to a very noisy region that has not been plotted for the sake of clarity. |
3.2 Assignments and fit
We used the PGOPHER program (Western 2017) to search for, and assign, transitions of the H2NCO radical. The final fit and spectral predictions were performed with the Pickett CALPGM suite of programs (Pickett 1991) using a Watson S-reduced Hamiltonian.
In the CP-FTMMW spectrum, two clusters of transitions closely matching what was expected for the N′ − N″ = 4–3 and 5–4 transitions of H2NCO are readily observed (Fig. 3). The detailed procedure used to retrieve a spectrum displaying only transitions from open-shell species and to identify these transitions is reported in Appendix B. Spectroscopic assignments of H2NCO transitions were straightforward: the two clusters of lines are separated by about 21 370 MHz when the calculated B + C value for H2NCO is 21 425 MHz (0.3% error) and the experimental transitions display the Ka, fine structure, and hyperfine structure patterns expected from the prediction. A closer look at the spectrum reveals that the N′ − N″ = 4–3 lines and 5–4, Ka = 0 lines lie only about 140 MHz and 180 MHz higher than the prediction, respectively (an error of about 0.2%). In total, 85 transitions (36 different frequencies) were assigned to the N′ − N″ = 4–3 (Ka = 0, 1) and 5–4 (Ka = 0–3) clusters of transitions. These initial assignments enabled preliminary adjustments of the spectroscopic constants, subsequently facilitating measurements at submillimetre wavelengths. A comparison of a portion of the CP spectrum with a simulation obtained using the final set of spectroscopic constants is shown in Appendix B.
From 146 GHz to 660 GHz, 3469 a-type transitions (1395 different frequencies) of H2NCO were assigned. An example of the N′ − N″ = 18–17 a-type transitions, which spread over about 16 GHz, is shown in Fig. 4. Spectral acquisitions were mostly performed over small regions around the predictions. Under our experimental conditions, transitions measured using Zeeman modulation mostly present a profile close to the second derivative of a Gaussian line. Many of the observed transitions display a partially resolved hyperfine structure, like for example the Ka = 3 cluster highlighted in orange in Fig. 4. Further information about the hyperfine structure and how it was included in the fit is reported in Appendix C. Figure 4 also illustrates the anomalously strong intensity of some Ka components compared to what was expected from the simulation (for instance the Ka = 2, Ka + Kc = N cluster around 389400 MHz) and asymmetry of some components (for instance the lowest and highest frequency transitions of the Ka = 3 cluster highlighted in orange). These effects, which may reflect a high sensitivity of the SR structure to the magnetic field, are discussed in greater detail in Appendix D. Finally, we observe on the experimental spectrum some transitions that likely arise from vibrational satellites of H2NCO, like for example the small cluster of transitions around 385 GHz not reproduced by the simulation in Fig. 4. No definite quantum number assignments were performed due to the limited number of observed features (since most of these satellites lie outside the spectral windows scanned in this study). This is explained in greater detail in Appendix E.
Once enough a-type transitions had been included in the model to ensure its robustness, dedicated searches for weak b-type transitions were undertaken. In total, 34 lines (ten different frequencies) with ![$\[K_a^{\prime}-K_a^{\prime \prime}=0-1\]$](/articles/aa/full_html/2024/07/aa49711-24/aa49711-24-eq11.png) were included in the fit. An example of two such b-type transitions, an SR doublet, is shown in Fig. 5. The asymmetry of the simulated transitions (in particular the higher frequency one) and to some extent of the experimental lines (despite their limited signal-to-noise ratio) is due to the presence of unresolved hyperfine components on the blue side of each transition, which create a weak shoulder in the resulting lines. The inclusion of these b-type transitions in the fit allows for a significant improvement in the determination of the A and ΔK constants.
were included in the fit. An example of two such b-type transitions, an SR doublet, is shown in Fig. 5. The asymmetry of the simulated transitions (in particular the higher frequency one) and to some extent of the experimental lines (despite their limited signal-to-noise ratio) is due to the presence of unresolved hyperfine components on the blue side of each transition, which create a weak shoulder in the resulting lines. The inclusion of these b-type transitions in the fit allows for a significant improvement in the determination of the A and ΔK constants.
Overall, 3588 lines (1441 different frequencies) with J″ ≤ 30 and ![$\[K_a^{\prime \prime}\]$](/articles/aa/full_html/2024/07/aa49711-24/aa49711-24-eq12.png) ≤ 12 have been assigned and included in the fit. The model contains 15 rotational parameters (rotational and centrifugal distortion constants), six SR parameters (including two higher-order ones), and 15 hyperfine parameters. To reproduce the observed frequencies at their experimental accuracy, 22 of these parameters have been adjusted, while the others were kept fixed at their calculated values. The fit takes a root-mean-square value of 107 kHz and a reduced standard deviation of 0.84. The resulting set of parameters is reported in Table 1, where it is compared to the calculated values. All the adjusted parameters are in excellent agreement with the calculations, with the rotational constants showing a relative difference of 0.2% or less from the Bayesian-scaled predicted values, and the diagonal quartic centrifugal distortion constants within about 5% of the calculated values. The experimental SR and hyperfine parameters are not as close to the calculated values but close enough that spectral assignments were straightforward.
≤ 12 have been assigned and included in the fit. The model contains 15 rotational parameters (rotational and centrifugal distortion constants), six SR parameters (including two higher-order ones), and 15 hyperfine parameters. To reproduce the observed frequencies at their experimental accuracy, 22 of these parameters have been adjusted, while the others were kept fixed at their calculated values. The fit takes a root-mean-square value of 107 kHz and a reduced standard deviation of 0.84. The resulting set of parameters is reported in Table 1, where it is compared to the calculated values. All the adjusted parameters are in excellent agreement with the calculations, with the rotational constants showing a relative difference of 0.2% or less from the Bayesian-scaled predicted values, and the diagonal quartic centrifugal distortion constants within about 5% of the calculated values. The experimental SR and hyperfine parameters are not as close to the calculated values but close enough that spectral assignments were straightforward.
Using the spectroscopic parameters of H2NCO derived from this work, reliable predictions can be made up to about 700 GHz (extrapolation to higher frequencies than the experimental measurements can be unreliable; thus, prediction above 700 GHz using the present model should be taken with caution). A spectral catalogue at 300 K (with a fully resolved hyperfine structure) is available on Zenodo together with the assignment and fit files1. The catalogue frequencies should be accurate to 100 kHz or better up to 650 GHz; that is, 1.0 km s−1 at 30 GHz, 0.6 km s−1 at 50 GHz, 0.3 km s−1 at 100 GHz, and 0.1 km s−1 at 350 GHz. It is worth noting that these values may be larger than the line widths observed in cold interstellar sources below 50 GHz. For instance, TMC-1 line widths are 0.72 km s−1 around 40 GHz in the QUIJOTE survey (Agúndez et al. 2022). Future experimental work targeting the lowest frequency Ka = 0 transitions of H2NCO (N = 1–0 around 21.4 GHz, N = 2–1 around 42.8 GHz, and N = 3–1 around 64.2 GHz) may help reduce these uncertainties. To help recalculate the catalogue intensities at various temperatures, partition functions have been calculated (from 300 K to 9 K) and are reported in Appendix F.
As final notes, in the course of the present measurements, we observed transitions of carbamyl fluoride (FC(O)NH2) in the 75–110 GHz region (no higher-frequency transitions have been measured due to the open-shell species selectivity of the Zeeman-modulated measurements). The species was previously investigated only in the 16–40 GHz region by Rigden & Jackson (1966); the present measurements and combined fit with the literature data are reported in Appendix G. Lastly, we did not observe transitions that could belong to the HNCHO isomer of H2NCO. This non-observation can be rationalised by several factors: (1) the lower intensity of HNCHO transitions compared to H2NCO; (2) the fact that HNCHO may not be synthesised in our experiment; and/or (3) the fact that the transitions of HNCHO could lie outside of the spectral ranges scanned in this study. With respect to point one, from the spectroscopic information given by the quantum chemical calculations performed in this work (see Appendix H), the lowest-energy cis conformer of HNCHO possesses dipole moment projections lower than 1 D. Were cis-HNCHO to be synthesised in a concentration similar to H2NCO, its transitions might thus remain below our detection limit. The trans conformer of HNCHO possesses more favourable dipole moment projections (over 2 Debye) but lies 10.5 kJ mol−1 higher in energy than the cis one. If thermodynamic factors govern the conformer population under our experimental conditions, a much lower concentration of this species may be found, yet again impacting its detectability. Concerning point two, previous studies have indicated that even though HNCHO should be the most stable isomer, H-abstraction would favour H2NCO (Zeng et al. 2023). Regardless, some experimental tests could be performed by using Cl atoms instead of F ones for the H-abstraction, to thus assess whether the halogen nature plays a role in the favoured site for H-abstraction on the precursor (carbon versus nitrogen atom). Finally, concerning point three, a previous study has reported the existence of a fast non-planar transition between the cis and trans conformations of the HNCHO radical that leads to an equilibrium between these configurations (Andrews 1970). Further high-level quantum chemical calculations may be warranted to confirm that point and determine the actual equilibrium geometry of HNCHO, and thus the best predicted rotational constants to perform a dedicated search for the species in specific spectral regions.
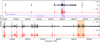 |
Fig. 4 Overview of the N′ − N″ = 18–17 a-type transition of H2NCO observed experimentally and comparison with a 300 K simulation obtained using the final spectroscopic constants (Table 1). The lowest Ka values are reported for both asymmetric components in the upper panel (in blue and purple). The lower panel corresponds to a zoom into the Ka = 3–12 region highlighted in light purple in the upper panel. The area highlighted in orange displays a partially resolved hyperfine structure (Ka = 3). The simulation was obtained using a Gaussian profile with a full width at half maximum of 1.3 MHz; the second derivative of the PGOPHER trace is plotted for visual comparison with the experimental spectrum. |
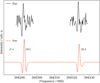 |
Fig. 5
|
![$\[N_{K_a^{\prime}, K_c^{\prime}}^{\prime}-N_{K_a^{\prime \prime}, K_c^{\prime \prime}}^{\prime \prime}=21_{0,21}-20_{1,20}\]$](/articles/aa/full_html/2024/07/aa49711-24/aa49711-24-eq13.png)
3.3 Astrochemical implications
To test the new spectroscopic predictions for H2NCO, we carried out a search for it using the data from the Protostellar Interferometric Line Survey (PILS). The PILS is a large spectral survey carried out towards the solar-type protostar IRAS 16293-2422 with the Atacama Large millimetre/submillimetre Array (ALMA) 12 m array and the Atacama Compact Array (ACA) in band 7. It has a spatial resolution of ~0.5″ and a sensitivity of 4–5 mJy beam−1 for a bin width of 1 km s−1 (Jørgensen et al. 2016). This survey, which covers the spectral range 329–363 GHz, has led to several new molecular detections in low-mass protostars (e.g. Lykke et al. 2017; Ligterink et al. 2017; Fayolle et al. 2017; Coutens et al. 2018, 2019; Manigand et al. 2021). Formamide and several of its isotopologues (NHDCHO, NH2CDO, and NH213CHO) were detected at a position located one beam offset from the continuum peak position of the B component (IRAS 16293 B in the following; Coutens et al. 2016). Cyanamide (H2NCN) was also detected towards the same position (Coutens et al. 2018). A search for the H2NCO radical is consequently pertinent towards this source.
Local thermodynamic equilibrium (LTE) models were produced with the CASSIS2 software and compared to the spectrum extracted at the same position as the previous molecular studies. The models assume a line width of 1 km s−1, a source size of 0.5″, and a υLSR of 2.7 km s−1, and take into account the total partition function given in Appendix F. The excitation temperatures of complex organic molecules vary in this source between ~125 and 300 K (Jørgensen et al. 2018). Different excitation temperatures were consequently assumed in the search, but independently of the assumed temperature no detected lines could be claimed above the noise of the observed spectrum. We used the brightest H2NCO lines predicted by the models that are not contaminated by emission of other molecules to derive upper limits on the column density; namely, the a-type, R-branch transitions involving ![$\[N_{K_a^{\prime \prime}, K_c^{\prime \prime}}^{\prime \prime}=15_{5,10 / 11}\]$](/articles/aa/full_html/2024/07/aa49711-24/aa49711-24-eq14.png) (both SR components around 342.957 and 343.059 GHz), 161,16 (around 355.358 and 355.393 GHz), 161,16 (around 359.950 and 359.981 GHz), and
(both SR components around 342.957 and 343.059 GHz), 161,16 (around 355.358 and 355.393 GHz), 161,16 (around 359.950 and 359.981 GHz), and ![$\[N_{K_a^{\prime \prime}, K_c^{\prime \prime}}^{\prime \prime}\left(J^{\prime \prime}\right)=15_{6,9 / 10}(15.5)\]$](/articles/aa/full_html/2024/07/aa49711-24/aa49711-24-eq15.png) (around 343.109 GHz). Based on the transitions at 342.957, 343.059 and 343.109 GHz, the upper limit is estimated to be about 1.7 × 1014 cm−2 if the excitation temperature is similar to NH2CHO (~300 K, Coutens et al. 2016). For a lower excitation temperature of ~ 125 K, we used the groups of transitions at 355.358, 355.393, 359.950, and 359.981 GHz and found a very close upper limit of 8.0 × 1013 cm−2. These undetected lines are shown in Fig. 6.
(around 343.109 GHz). Based on the transitions at 342.957, 343.059 and 343.109 GHz, the upper limit is estimated to be about 1.7 × 1014 cm−2 if the excitation temperature is similar to NH2CHO (~300 K, Coutens et al. 2016). For a lower excitation temperature of ~ 125 K, we used the groups of transitions at 355.358, 355.393, 359.950, and 359.981 GHz and found a very close upper limit of 8.0 × 1013 cm−2. These undetected lines are shown in Fig. 6.
Coutens et al. (2016) find column densities of NH2CHO and HNCO equal to 1.0 × 10¹⁶ and 2.7 × 1016 cm−2, respectively, using their 13C isotopologue lines and a 12C/13C ratio of 68 (Milam et al. 2005). H2NCO is consequently ≳60 times less abundant than NH2CHO and ≳160 times less abundant than HNCO towards IRAS 16293 B. The radical NCO has never been searched towards IRAS 16293-2422 as far as we know. We searched for it in the PILS data but we only derived an upper limit of 7 × 1014 cm−2 for Tex = 300 K and 5 × 1014 cm−2 for Tex = 125 K. Among the other NCO-bearing molecules detected in IRAS 16293B, CH3NCO has a column density of ~3–4 × 1015 cm−2 (Ligterink et al. 2017; Martín-Doménech et al. 2017) and is at least 17 times more abundant than H2NCO. Acetamide (CH3C(O)NH2) has also been tentatively detected by Ligterink et al. (2018b) with a column density of (9–25) × 1014 cm−2 depending on the excitation temperature. If confirmed, it would mean that this molecule is ≳5–15 times more abundant than H2NCO.
To understand the astrophysical implications of the nondetection of H2NCO in IRAS 16293 B, we compare the upper limit derived above to the calculated abundance obtained using the model in Coutens et al. (2022); Manigand et al. (2021) that uses the Nautilus code (Ruaud et al. 2016) – a three-phase gas, dust grain, ice surface, and dust grain, ice, mantle time-dependent chemical model employing kida.uva.2014 (Wakelam et al. 2015) as the basic reaction network. The model was recently updated to better describe iCOMs on grains and in the gas phase (800 individual species are included in the network and are involved in 9000 separate reactions, Coutens et al. 2022; Manigand et al. 2021). The physical model to describe IRAS 16293 B evolution consists of the two successive evolutionary stages of a low-mass protostar: a uniform and constant stage, corresponding to the pre-stellar phase, or the cold-core phase, followed (after 1 × 10⁶ yr) by a collapse phase, as is described in Manigand et al. (2021). The following conditions are used in the pre-stellar phase: homogeneous gas with a density equal to 2.5 × 104 cm−3; a temperature of 10 K for both gas and dust; a visual extinction of 10 mag; a cosmic-ray ionisation rate of 1.3 × 10⁻¹⁷ s−1; a standard external ultraviolet field of 1 G0; and the same initial abundances as in Manigand et al. (2021).
The evolution of the abundances during the cold-core phase and the collapse phase is shown in Fig. 7. H2NCO and the species directly related to it, HNCO and NH2CHO, are mostly produced on grain surfaces and the closed shell species, HNCO and NH2CHO, are released in the gas phase when the temperature reaches the desorption temperature, between 120 and 130 K – the binding energy of HNCO is measured as being equal to 3900 K (Noble et al. 2015) and that of NH2CHO is between 5056 and 6990 K (Chaabouni et al. 2018). More precisely, in our network HNCO is mainly produced by the reaction s-N + s-HCO, where s-means species on grain. This reaction is effective even at 10 K in the cold-core phase as N is, along with atomic hydrogen, relatively mobile on grains when we consider its adsorption energy to be equal to 700 K (Molpeceres et al. 2020; Shimonishi et al. 2018) and Ediffusion = 0.4 × Ebinding (Hasegawa et al. 1992). H2NCO is produced by hydrogenation of HNCO (which presents a barrier but is made possible by tunnelling), H-atom abstraction from s-NH2CHO, and also by the s-CN + s-H2O reaction, which according to a recent theoretical study is possible by a concerted effect of water molecules in the ice (Rimola et al. 2018). Finally, NH2CHO is produced by the hydrogenation of H2NCO and by the s-NH2 + s-HCO reaction. The agreement between the modelled abundances of HNCO and NH2CHO and the observations of IRAS 16293 B (and also molecular clouds for HNCO) is relatively good, given the many uncertainties and unknowns (for example the branching ratios between the s-NH2CHO and s-NH3 + s-CO pathways for the s-H + s-H2NCO reaction).
Figure 7 also shows that the calculated abundance of s-H2NCO is high as long as the temperature does not exceed 25 K. Above this temperature, certain radicals become mobile on ice—s-HCO, for example, has a relatively low binding energy of around 3000 K (Enrique-Romero et al. 2016; Minissale et al. 2016; Sameera et al. 2017; Wakelam et al. 2017), but not H2NCO, whose binding energy is calculated to be around 7000 K (Wakelam et al. 2017). Then, as the s-radical + s-radical reaction is barrierless, the radicals will react with each other on the grains before being able to desorb. It should be noted that as the diffusion energy of the radicals is always notably lower than the binding energy (Ediffusion = 0.4 × Ebinding in our model), the radicals will diffuse before desorbing and will therefore be rapidly destroyed on the grains before they can be injected into the gas phase. The only possibility for radicals to desorb is if they are produced at temperatures above their desorption temperature, as in the case of NO, or possibly HCO, detected in IRAS 16293 B (Ligterink et al. 2018a; Rivilla et al. 2019). The non-detection of H2NCO suggests that this radical is neither produced at a high temperature on grains nor produced efficiently in the protostellar hot gas phase. However, its non-detection does not compromise its important role as an intermediate in NH2CHO production.
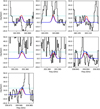 |
Fig. 6 Undetected transitions of H2NCO that were used to determine the column density upper limits. The ALMA observed spectrum of IRAS 16293 B is in black. The LTE model for Tex = 300 K is in red, while the one for Tex = 125 K is in blue. The dotted cyan line corresponds to the 3 rms level per 1 km s−1, 1 km s−1 being the typical line width at this position. |
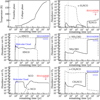 |
Fig. 7 Time evolution of the temperature and the abundances (with respect to molecular hydrogen) in the gas phase (solid lines) and on the grain surface (dashed) of HNCO, H2NCO, NH2CHO NCO, and CH3NCO species during the cold-core phase and the collapse phase. The time axis is reversed to better visualise the evolution of the abundances. The observed gas-phase abundances are indicated in blue. Detections in IRAS 16293 B are from Coutens et al. (2016); Hernández-Gómez et al. (2018);? for HNCO and from Coutens et al. (2016); Jørgensen et al. (2020); ? for NH2CHO. Detections in dense molecular clouds are from ? Marcelino et al. (2009) and Turner et al. (1999). The upper limits for the relative abundance of the gas phase H2NCO and NCO in IRAS 16293 B are shown in red. The observed abundances for IRAS 16293 B are calculated from the observed column densities using an H2 column density equal to 1.5 × 1023 cm−2 so that the chemical model reproduces the observed abundance of CH3OH (this is equivalent to using abundances relative to CH3OH). |
4 Conclusions
We have conducted an extensive investigation into the room-temperature pure rotational spectrum of the H2NCO radical (previously never detected in the gas phase in the laboratory) in the 75–660 GHz region. Close to 1500 frequencies have been assigned in υ = 0, upon guidance from quantum-chemical calculations, enabling a robust set of spectroscopic parameters to be derived for the species. Using this model, accurate spectral predictions can be made over the entire millimetre-and submillimetre-wave spectral regions. This opens up the possibility for interstellar searches for the radical in cold to warm environments (T ≤ 300 K). Searches have been undertaken towards IRAS 16293 B, a source where the related molecule NH2CHO is abundant, using the PILS survey. No transition of the radical has been detected and upper limits on the column densities have been derived. The non-detection of H2NCO in the gas phase is consistent with a physico-chemical model of the formation of complex molecules during the earliest stages of the source.
Acknowledgements
This work has been supported by the Région Ile-de-France, through DIM-ACAV+, the Agence Nationale de la Recherche (ANR-19-CE30-0017-01), the “Investissements d’Avenir” LabEx PALM (ANR-10-LABX-0039-PALM), and the Programme National “Physique et Chimie du Milieu Interstellaire” (PCMI) of CNRS/INSU with INC/INP co-funded by CEA and CNES. Quantum chemical calculations were performed using HPC resources from the “Mésocentre” computing centre of CentraleSupélec and École Normale Supérieure Paris-Saclay supported by CNRS and Région Île-de-France (http://mesocentre.centralesupelec.fr/). This paper makes use of the following ALMA data: ADS/JAO.ALMA#2013.1.00278.S. ALMA is a partnership of ESO (representing its member states), NSF (USA) and NINS (Japan), together with NRC (Canada) and NSC and ASIAA (Taiwan), in cooperation with the Republic of Chile. The Joint ALMA Observatory is operated by ESO, AUI/NRAO and NAOJ. A.C. received financial support from the European Research Council (ERC) under the European Union’s Horizon 2020 research and innovation programme (ERC Starting Grant “Chemtrip”, grant agreement No 949278). J.K.J. acknowledges support from the Independent Research Fund Denmark (grant number 0135-00123B). We thank T. Huet for the loan of the audio-amplifier and M. Goubet, Z. Kisiel, M. D. Marshall, and B. J. Esselman for useful discussion regarding the vibration-rotation calculations with Gaussian.
Appendix A Additional calculation outputs
Fundamental modes of H2NCO calculated in this study (ωB97X-D/cc-pVQZ). Energies are reported in cm−1 and intensities in km mol−1.
Calculated α values (in MHz) for H2NCO in excited vibrational states (ωB97X-D/cc-pVQZ). Predictions of the rotational constants values in υi = 1 can be retrieved using the formula Bi = B0 + αBi.
Appendix B Initial searches for radical products using the chirped-pulse spectrometer
As was mentioned in section 2.3, we performed initial searches for H-abstraction products from formamide using the CP spectrometer because it ideally allows one to rapidly and repeatedly scan a broad spectral region under various experimental conditions. The initial searches were performed using a 0.5 μs excitation pulse, which was found to give a reasonably good signal for both strong and moderate dipole moment transitions, in order to scan without bias for potential reaction products in our experiment. Starting with a pressure found to maximise the signal of formamide in our flow conditions (5 μbar), we recorded several CP spectra for formamide:F2/He ratio of 1:0.5, 1:1, 1:2, and 1:3. Each of these spectra were recorded for about 1 hour (500,000 averages) and the measurement was repeated after placing a permanent magnet below the cell. Before recording the spectra, we ensured that the added pressure of F2/He did not degrade the signal of the precursor (as high pressure can cause the polarised molecules to relax faster by collision, and hence yield shortened FIDs).
Because the experimental conditions were relatively stable during the scans, and because the magnet does not affect the signal of either the precursor lines or the close-shell products of the reaction, it was possible to essentially subtract the spectrum recorded with the magnet from the one recorded without it for each formamide:F2/He pressure ratio. As a result of this, only transitions whose intensities are affected by the magnetic field appear on the resulting spectrum. Concretely, because CP spectra display some negative noise and spurs, and because there were some slight variations in the line intensity of the precursor, special care was taken in the subtraction procedure in order to not add positive noise to the subtracted spectrum and to filter all signal from the precursor. To do so, all negative intensity points in the spectrum recorded with the magnet were set to zero. Then, for each frequency point, the resulting intensity from this treated spectrum was multiplied by a constant factor (typically 1 to 1.2, to account for intensity fluctuations in the precursor signal) and subtracted from the corresponding intensity in the spectrum recorded without a magnet. To enable a straightforward display of the subtracted spectrum, a negative intensity cut-off was applied to values below the noise level. Finally, remaining spurious signals were identified by a visual inspection of the subtracted spectrum and discarded (intensity set to zero), as were some particularly noisy regions of the spectrum (typically with our instrument the region around 97.5 GHz is extremely noisy).
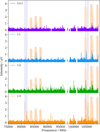 |
Fig. B.1 Comparison of the different CP spectra after data treatment allowed us to identify transitions from radical species (formamide:F2/He pressure ratios of 1:0.5, 1:1, 1:2, and 1:3, from top to bottom). The shaded areas correspond to ±200 MHz windows around the spectral predictions from the NCO and H2NCO radicals (in light blue and orange, respectively). For NCO, predictions are from the CDMS database (Endres et al. 2016) based on the experimental work by Kawaguchi et al. (1985). For H2NCO, calculated values are from this work and the relative intensity is proportional to the expected line intensity at 300 K, in arbitrary units. Discontinuities in the experimental spectra correspond to very noisy regions that have not been plotted for the sake of clarity. |
Overall, this procedure allowed us to search for transitions arising on radical species in each spectrum. Fig. B.1 shows the resulting spectra. Around the areas where transitions of H2NCO were expected, features are easily distinguishable in all spectra; they are strongest in the 1:1 and 1:2 ratio spectra. The only other radical clearly identifiable in the spectra is NCO, which presents strong transitions in the 1:3 ratio spectrum. The experimental data do not allow for a comparison of the production of the two radicals in terms of concentration because of both the different polarisation of the two radicals (which depends on their dipole moment projections) and the respective volumes within which they are present (which depend on the lifetime or reactivity of each species). However, we qualitatively see here that a high concentration of F atoms yields multiple H-abstractions from formamide. As a final note, transitions of H2NCO are more than 1000 times weaker than transitions of formamide in the CP spectra; thus, the identification of the radical features was only possible because the precursor spectral density was not too large, allowing for transitions of H2NCO to lie in transparency windows. The methodology used in the present study would not be applicable to a precursor presenting a very dense spectrum in the W-band region.
Following identification of H2NCO in these spectra, experimental conditions were optimised to maximise the signal of this radical. A pulse length of 0.25 μs was found to maximise the signal of the observed a-type transitions, as was expected from the relatively large projected dipole moment of 3.7 Debye. Long acquisitions were subsequently undertaken, ultimately yielding a 2.9 million averaged FID spectrum. The procedure enabling us to retrieve a radical-only spectrum was applied to that spectrum; the resulting spectrum is displayed in Fig. 3 of the main text and a zoom of the ![$\[N_{K_a^{\prime}, K_c^{\prime}}^{\prime}-N_{K_a^{\prime \prime}, K_c^{\prime \prime}}^{\prime \prime}=5_{0,5}-4_{0,4}\]$](/articles/aa/full_html/2024/07/aa49711-24/aa49711-24-eq16.png) is shown in Fig. B.2.
is shown in Fig. B.2.
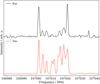 |
Fig. B.2 Experimental CP spectrum in the 107 GHz region where the |
![$\[N_{K_a^{\prime}, K_c^{\prime}}^{\prime}-N_{K_a^{\prime \prime}, K_c^{\prime \prime}}^{\prime \prime}=5_{0,5}-4_{0,4}\]$](/articles/aa/full_html/2024/07/aa49711-24/aa49711-24-eq17.png)
Other species synthesised In the final CP spectrum, many close-shell molecules synthesised in the experiment are visible. We observe notably strong lines of HCN (including transitions in υ2 = 1 and υ3 = 1, and of the H13CN and HC15N species), HNC, and HNCO (including strong vibrational satellites and both 13C and 15N isotopologues), as well as lines of the fluorinated species HFCO, FC(O)NH2, F2CO, and FCN (in υ = 0, υ2 = 1). Transitions of FC(O)NH2 are observed for the first time in the 75–110 GHz spectral region (see Appendix G for additional information).
Appendix C Hyperfine structure and fit detail
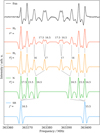 |
Fig. C.1 Evolution of the structure of the |
![$\[N_{K_a^{\prime}, K_c^{\prime}}^{\prime}-N_{K_a^{\prime \prime}, K_c^{\prime \prime}}^{\prime \prime}=17_{2,16}-16_{2,15}\]$](/articles/aa/full_html/2024/07/aa49711-24/aa49711-24-eq18.png)
As was mentioned in the main text, many transitions present a resolved hyperfine structure, as is illustrated in Fig. C.1, in which the experimental spectrum of the ![$\[N_{K_a^{\prime}, K_c^{\prime}}^{\prime}-N_{K_a^{\prime \prime}, K_c^{\prime \prime}}^{\prime \prime}=17_{2,16}-16_{2,15}\]$](/articles/aa/full_html/2024/07/aa49711-24/aa49711-24-eq19.png) transition is compared to a simulation of the fine structure (J quantum number) and successive hyperfine structures (F1, F2, F quantum numbers). In this transition, the central frequency components show a fully resolved hyperfine structure, while the lowest- and highest-frequency components lie essentially at the frequency of nitrogen-hyperfine-split components. Special care was taken to include these components in the fit. To limit the number of lines in the fit, we introduced two dummy vibrational states into the model (i.e. at the same energy as υ = 0), accounting for various cases of resolved hyperfine structure. The fully resolved hyperfine structure corresponds to υ = 0 (red trace in Fig. C.1). For this state, all the parameters from Table 1 are included. Transitions displaying only N and H1 hyperfine structure (orange trace in Fig. C.1) are coded as υ = 1 ; the hyperfine parameters pertaining to H2 are omitted. Finally, transitions showing only an N-resolved hyperfine structure (green trace in Fig. C.1) are coded as υ = 2; the hyperfine parameters pertaining to both H1 and H2 are omitted. However, the hyperfine splitting is often asymmetrical with respect to the unsplit transition. A striking example is visible in Fig. C.1 for the
transition is compared to a simulation of the fine structure (J quantum number) and successive hyperfine structures (F1, F2, F quantum numbers). In this transition, the central frequency components show a fully resolved hyperfine structure, while the lowest- and highest-frequency components lie essentially at the frequency of nitrogen-hyperfine-split components. Special care was taken to include these components in the fit. To limit the number of lines in the fit, we introduced two dummy vibrational states into the model (i.e. at the same energy as υ = 0), accounting for various cases of resolved hyperfine structure. The fully resolved hyperfine structure corresponds to υ = 0 (red trace in Fig. C.1). For this state, all the parameters from Table 1 are included. Transitions displaying only N and H1 hyperfine structure (orange trace in Fig. C.1) are coded as υ = 1 ; the hyperfine parameters pertaining to H2 are omitted. Finally, transitions showing only an N-resolved hyperfine structure (green trace in Fig. C.1) are coded as υ = 2; the hyperfine parameters pertaining to both H1 and H2 are omitted. However, the hyperfine splitting is often asymmetrical with respect to the unsplit transition. A striking example is visible in Fig. C.1 for the ![$\[F_1^{\prime \prime}=16.5 \rightarrow F_2^{\prime \prime}\]$](/articles/aa/full_html/2024/07/aa49711-24/aa49711-24-eq20.png) transitions but to some extent this also affects the
transitions but to some extent this also affects the ![$\[F_1^{\prime \prime}=15.5 \rightarrow F_2^{\prime \prime}\]$](/articles/aa/full_html/2024/07/aa49711-24/aa49711-24-eq21.png) transitions. Thus, particular care was taken in the choice of the hyperfine case for the assignment. Concretely, an unresolved case was only chosen if it did not induce a significant frequency shift in the transition.
transitions. Thus, particular care was taken in the choice of the hyperfine case for the assignment. Concretely, an unresolved case was only chosen if it did not induce a significant frequency shift in the transition.
Finally, Fig. C.1 also illustrates the asymmetry in the line profile observed for many transitions recorded by Zeeman modulation spectroscopy; here, the lowest- and highest-frequency components of the transition that exhibit a shape closer to that of a second derivative. This effect is investigated in greater detail in Appendix D.
Appendix D Line profile in Zeeman modulation
In the course of our measurements by Zeeman modulation spectroscopy, we have noticed that some transitions exhibit an asymmetric line profile (e.g. see Figs. 4 and C.1). Some of these asymmetries may be explained by the effect of Faraday rotation of the polarisation around frequencies of radical transitions. We were able to partially correct this effect by adding polarisation grids in front of the source and detector, as is illustrated in Fig. D.1.
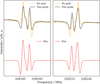 |
Fig. D.1 Experimental spectra of the |
![$\[N_{K_a^{\prime}, K_c^{\prime}}^{\prime}-N_{K_\alpha^{\prime \prime}, K_c^{\prime \prime}}^{\prime \prime}=16_{0,16}-15_{0,15}\]$](/articles/aa/full_html/2024/07/aa49711-24/aa49711-24-eq22.png)
For other transitions, the asymmetry of the transitions remains visible despite the use of the polarisation grids. This is striking for Ka = 2 transitions (the lowest- and highest-frequency components are systematically affected). To better understand this effect, we recorded the ![$\[N_{K_a^{\prime}, K_c^{\prime}}^{\prime}-N_{K_a^{\prime \prime}, K_c^{\prime \prime}}^{\prime \prime}=15_{2,14}-14_{2,13}\]$](/articles/aa/full_html/2024/07/aa49711-24/aa49711-24-eq23.png) a-type transition using conventional source-frequency-modulation spectroscopy. The spectrum was acquired using a 48.157 kHz source frequency modulation (FM), a 360 kHz FM deviation, 100 kHz frequency steps, and an acquisition time of 150 ms per frequency point. The resulting spectrum is plotted in Fig. D.2, where it is compared with the spectrum recorded using Zeeman modulation. A portion of the spectrum on the FM trace is not exploitable because of the saturation of the precursor transitions, a common caveat when investigating discharge products using source-frequency-modulation spectroscopy. Other weaker transitions arising from close-shell species are also visible (for instance around 320819 GHz). The acquisition using Zeeman modulation strongly benefits from the open-shell species selectivity, as was already mentioned in Chahbazian et al. (2024), although at the expense of the resolution, since it yields broader features (the Ka = 2 transitions are particularly affected). By looking more closely at the two asymmetric components of the transition shown in Fig. D.2 (lower panels), we observe that the maximum of the positive component of the line does not correspond to the centre frequency of the transition. Special care was thus taken to retrieve experimental frequencies for these components, and a large frequency uncertainty (typically 300 kHz) was used in the fit.
a-type transition using conventional source-frequency-modulation spectroscopy. The spectrum was acquired using a 48.157 kHz source frequency modulation (FM), a 360 kHz FM deviation, 100 kHz frequency steps, and an acquisition time of 150 ms per frequency point. The resulting spectrum is plotted in Fig. D.2, where it is compared with the spectrum recorded using Zeeman modulation. A portion of the spectrum on the FM trace is not exploitable because of the saturation of the precursor transitions, a common caveat when investigating discharge products using source-frequency-modulation spectroscopy. Other weaker transitions arising from close-shell species are also visible (for instance around 320819 GHz). The acquisition using Zeeman modulation strongly benefits from the open-shell species selectivity, as was already mentioned in Chahbazian et al. (2024), although at the expense of the resolution, since it yields broader features (the Ka = 2 transitions are particularly affected). By looking more closely at the two asymmetric components of the transition shown in Fig. D.2 (lower panels), we observe that the maximum of the positive component of the line does not correspond to the centre frequency of the transition. Special care was thus taken to retrieve experimental frequencies for these components, and a large frequency uncertainty (typically 300 kHz) was used in the fit.
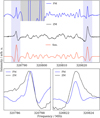 |
Fig. D.2 Experimental spectra recorded around the |
![$\[N_{K_a^{\prime}, K_c^{\prime}}^{\prime}-N_{K_a^{\prime \prime}, K_c^{\prime \prime}}^{\prime \prime}=15_{2,14}-14_{2,13}\]$](/articles/aa/full_html/2024/07/aa49711-24/aa49711-24-eq24.png)
Presently, we do not fully understand the line profile observed in Zeeman modulation, or the asymmetry of some of the components. It is interesting to note that the transitions particularly affected by the asymmetry already present some asymmetry in source-frequency-modulation spectroscopy, as is visible in the lower panels of Fig. D.2, an effect that cannot be explained by the presence of unresolved hyperfine components. It is possible that these transitions are particularly affected by an external magnetic field (Earth’s one in the case of the source-frequency-modulation spectrum). This would also be consistent with the fact that these transitions are overall stronger than other transitions in the Zeeman modulation spectrum (as is visible in Fig 4).
Appendix E Vibrational satellites
The fundamental modes of H2NCO calculated in this study are reported in Table A.1. At room temperature, the three lowest-energy vibrational states, υ9 = 1 (~ 282 cm−1), υ7 = 1 (~ 540 cm−1), and υ8 = 1 (~ 631 cm−1), should possess a significant population: 13 to 26 % (based on the anharmonic and harmonic calculated energies), ~ 7 %, and ~ 5 % of the ground state population, respectively. Indeed, in broad surveys of the experimental spectrum recorded using the Zeeman modulation spectrometer (in particular in the 300–400 GHz range where we have a very good signal-to-noise ratio), we observe several clusters with a similar shape to those of H2NCO in υ = 0, weaker and at lower frequencies. This is exemplified in Fig. E.1, where the most prominent clusters have been highlighted using three shading colours. The lines in the light purple regions exhibit an intensity of about 25 % that of H2NCO; they thus likely correspond to pure rotation in υ9 = 1. The clusters in the orange regions are about ten times weaker than H2NCO, and thus may arise from transitions in υ7 = 1. Finally, a weak cluster is visible in the cyan region, with transition intensities about 97 % weaker than H2NCO; they may correspond to either υ8 = 1 or υ9 = 2.
Unambiguous identification of vibrational satellites requires spectroscopic assignments in these excited vibrational states. Simulations of the pure rotational spectrum of H2NCO in υ9 = 1, υ7 = 1, and υ8 = 1 are presented in the lower panel of Fig. E.1, alongside the final simulation in υ = 0. The simulations were obtained using the predicted rotational constants in the excited states (using the α values from our calculations, Table A.2); all the other parameters being kept fixed to those in υ = 0. The harmonic energies of the excited states have been used, since this was found to better reproduce the relative intensity of the transitions that we believe are from υ9 = 1. The most convincing identification is perhaps υ9 = 1, with a prediction that appears only slightly shifted from the clusters observed in the experimental spectrum. Individual transition assignments, however, have proven challenging based on this portion of the spectrum only. Indeed, we have not performed systematic surveys over the entire spectral region, and even for the N′ − N″ = 17 − 16 transition shown in the figure, the experimental measurements lack coverage in the regions where the Ka = 0, 1 and the lowest-frequency Ka = 2 transitions lie. Dedicated measurements should be undertaken to fully unveil the spectrum of these vibrational satellites.
As a side note, Fig. E.1 also illustrates the somewhat anomalous intensities of the ![$\[K_a^{\prime \prime}=2\]$](/articles/aa/full_html/2024/07/aa49711-24/aa49711-24-eq25.png) a-type clusters on the experimental spectrum. These clusters indeed appear much stronger than what was expected from the simulation, an effect that is visible over the entire submillimetre spectral region probed in this study. It is worth noting that these
a-type clusters on the experimental spectrum. These clusters indeed appear much stronger than what was expected from the simulation, an effect that is visible over the entire submillimetre spectral region probed in this study. It is worth noting that these ![$\[K_a^{\prime \prime}=2\]$](/articles/aa/full_html/2024/07/aa49711-24/aa49711-24-eq26.png) clusters are also those that exhibit the most asymmetric line profiles. It seems that they are the most sensitive to the modulation of the magnetic field (as was mentioned already in section D).
clusters are also those that exhibit the most asymmetric line profiles. It seems that they are the most sensitive to the modulation of the magnetic field (as was mentioned already in section D).
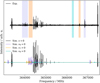 |
Fig. E.1 Experimental spectrum recorded around the N′ − N″ = 17 − 16 a-type transition of H2NCO using Zeeman modulation spectroscopy (upper trace), and comparison with PGOPHER simulations for υ = 0 and the three lowest vibrationally excited states at 300 K. The simulation in υ = 0 was obtained using the final set of spectroscopic parameters (see Table 1). Those in the excited states were obtained using the harmonic vibrational energies, the predicted rotational constants in these states (calculated using the α values in Table A.2), and the other spectroscopic parameters from υ = 0. For all simulations, a Gaussian profile with a full width at half maximum of 1.3 MHz has been used. Shaded areas in the upper trace highlight regions where the observed transitions likely arise from vibrational satellites. |
Appendix F Partition function
The rotational partition function was calculated at various temperatures using SPCAT for the fully resolved hyperfine structure (since components are observed over the entire submillimetre-wave domain). Special care was taken to ensure convergence of the partition function (which required calculation up to N = 130). Because the molecule possesses low-lying vibrational modes that are significantly populated at 300 K, as is seen in Appendix E, the vibration partition function was also calculated using the formula (Gordy & Cook 1984)
![$\[Q_{\mathrm{vib}}=\Pi_{i=1}^{N_{\mathrm{vib}}} \frac{1}{1-e^{-E_i(\text { vib }) / k T}},\]$](/articles/aa/full_html/2024/07/aa49711-24/aa49711-24-eq27.png) (F.1)
(F.1)
where Nvib is the number of vibrational modes considered in the product, Ei(vib) is the vibrational energy of the ith vibrational mode (in cm−1; see Table A.1), k is the Boltzmann constant (expressed in cm−1 /K for homogeneity), and T is the temperature in Kelvin. Based on the results of the relative intensities of the υ9 = 1 vibrational satellites of H2NCO observed in the experimental spectrum, which seem to be in agreement with the expected population assuming the harmonic energy of this mode, we decided to compute the harmonic value of the vibrational partition function (![$\[Q_{\mathrm{vib}}=Q_{\mathrm{vib}}^{\mathrm{harm}}\]$](/articles/aa/full_html/2024/07/aa49711-24/aa49711-24-eq28.png) ). For the calculation, we only considered the vibrational modes that have a significant population at room temperature, and hence those that have energies lower than 1000 cm−1 ; namely, υ9 = 1, υ9 = 2, υ9 = 3, υ7 = 1, υ8 = 1, (υ9, υ7) = (1, 1), and (υ9, υ8) = (1, 1). The total partition function was then obtained using the formula
). For the calculation, we only considered the vibrational modes that have a significant population at room temperature, and hence those that have energies lower than 1000 cm−1 ; namely, υ9 = 1, υ9 = 2, υ9 = 3, υ7 = 1, υ8 = 1, (υ9, υ7) = (1, 1), and (υ9, υ8) = (1, 1). The total partition function was then obtained using the formula
![$\[Q_{\text {tot }}=Q_{\text {rot }} Q_{\text {vib }}.\]$](/articles/aa/full_html/2024/07/aa49711-24/aa49711-24-eq29.png) (F.2)
(F.2)
The different values are reported in Table F.1.
The catalogue intensities values reported in the electronic supporting information were calculated using Qtot(300 K). Intensities at lower temperatures can be recalculated using the corresponding Qtot(T) values.
Rotational, vibrational, and total partition functions for H2NCO (fully resolved hyperfine structure) at various temperatures.
Appendix G FC(O)NH2
While assigning transitions from known molecules on the CP-FTMMW spectrum, we have observed three clusters of transitions, lying at around 84, 95, and 106 GHz, as is shown in Fig. G.1. These lines were rapidly assigned to FC(O)NH2, for which transitions in υ = 0 have previously been measured in the 16–40 GHz range by Rigden & Jackson (1966) using Stark spectroscopy (J′ ≤ 4, Ka′ ≤ 6, 46 at different frequencies). A fit of the literature transitions with a Watson-S Hamiltonian using Pickett’s SPFIT software has enabled spectral predictions in the W-band range and assignments of the observed transitions of those molecules. We assigned 215 lines (both a- and b-type) corresponding to transitions involving J′ ≤ 50 and K′a ≤ 42. Many of the transitions exhibit a partially resolved hyperfine nitrogen structure. Because of unresolved asymmetric splitting for most of the transitions, the total number of lines in the fit is much larger (1277 total). Transitions from Rigden & Jackson (1966) and the CP-FTMMW spectrum were assigned a 100–200 kHz and 50–150 kHz frequency uncertainty, respectively. The resulting spectroscopic parameters are reported in Table G.1 and a simulation using these constants is shown in Fig. G.1. The corresponding fit files are available on Zenodo.3
Spectroscopic parameters of FC(O)NH2 in the S-reduction and relevant fit information. 1σ errors are reported within parentheses in the unit of the last digit; they were formatted using the PIFORM software developed by Kisiel (2001).
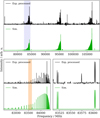 |
Fig. G.1 CP experimental spectrum after processing allowed the removal of contributions from known close-shell species (upper trace), and comparison with a PGOPHER simulation for FC(O)NH2 in υ = 0. The simulation was obtained using the final set of spectroscopic parameters (see Table G.1), a temperature of 300 K, and a Gaussian profile with a full width at half maximum of 0.6 MHz. The shaded area in light purple in the upper panel is zoomed in on in the bottom left panel; that in orange is zoomed in on in the lower right panel. Discontinuities in the processed experimental spectrum correspond to regions where lines of other molecules were lying. |
Appendix H HNCHO
HNCHO was investigated by quantum-chemical calculations in a similar fashion as its H2NCO isomer at the ωB97X-D/cc-pVQZ level of theory. The radical possesses two planar conformations, both belonging to the Cs point group of symmetry; namely, cis (H–N–C–O dihedral angle of 0 °) and trans (H–N–C–O dihedral angle of 180 °), the latter lying 10.5 kJ/mol higher than the former. Both conformers are displayed in Fig. H.1, along with relevant structural information. The permanent dipole moment projections take values of μa = 0.7 Debye and μb = 0.2 Debye for the cis conformer and μa = 2.0 Debye and μb = 2.7 Debye for the trans one. The predicted spectroscopic constants for these two conformers are reported in Table H.1.
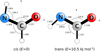 |
Fig. H.1 Equilibrium structure of cis and trans HNCHO calculated at the ωB97X-D/cc-pVQZ level of theory. Geometrical parameters (bond lengths in angstroms and angles in degrees) and principal axes of inertia are reported. The figure was generated using the PMIFST software from the PROSPE collection of programs developed by Kisiel (2001). |
Calculated spectroscopic parameters (in MHz) of HNCHO cis and trans conformers in the S-reduction.
References
- Agarwal, V. K., Schutte, W., Greenberg, J. M., et al. 1985, Origins Life Evol. Biosph., 16, 21 [NASA ADS] [CrossRef] [Google Scholar]
- Agúndez, M., Marcelino, N., Cabezas, C., et al. 2022, A&A, 657, A96 [NASA ADS] [CrossRef] [EDP Sciences] [Google Scholar]
- Alonso, E. R., Kolesniková, L., Belloche, A., et al. 2021, A&A, 647, A55 [NASA ADS] [CrossRef] [EDP Sciences] [Google Scholar]
- Andrews, P. 1970, J. Mol. Struct., 6, 85 [NASA ADS] [CrossRef] [Google Scholar]
- Belloche, A., Garrod, R. T., Müller, H. S. P., et al. 2019, A&A, 628, A10 [NASA ADS] [CrossRef] [EDP Sciences] [Google Scholar]
- Bisschop, S. E., Fuchs, G. W., Van Dishoeck, E. F., & Linnartz, H. 2007, A&A, 474, 1061 [CrossRef] [EDP Sciences] [Google Scholar]
- Bredehöft, J. H., Böhler, E., Schmidt, F., Borrmann, T., & Swiderek, P. 2017, ACS Earth Space Chem., 1, 50 [CrossRef] [Google Scholar]
- Buchanan, Z., Lee, K. L. K., Chitarra, O., et al. 2021, J. Mol. Spectrosc., 377, 111425 [NASA ADS] [CrossRef] [Google Scholar]
- Cernicharo, J., Kisiel, Z., Tercero, B., et al. 2016, A&A, 587, L4 [NASA ADS] [CrossRef] [EDP Sciences] [Google Scholar]
- Chaabouni, H., Diana, S., Nguyen, T., & Dulieu, F. 2018, A&A, 612, A47 [NASA ADS] [CrossRef] [EDP Sciences] [Google Scholar]
- Chahbazian, R., Martin-Drumel, M.-A., & Pirali, O. 2024, J. Phys. Chem. A, 128, 370 [NASA ADS] [CrossRef] [Google Scholar]
- Chai, J.-D., & Head-Gordon, M. 2008, Phys. Chem. Chem. Phys., 10, 6615 [NASA ADS] [CrossRef] [Google Scholar]
- Chitarra, O., Martin-Drumel, M.-A., Gans, B., et al. 2020, A&A, 644, A123 [NASA ADS] [CrossRef] [EDP Sciences] [Google Scholar]
- Chitarra, O., Pirali, O., Spaniol, J.-T., et al. 2022, J. Phys. Chem. A, 126, 7502 [NASA ADS] [CrossRef] [Google Scholar]
- Coudert, L. H., Chitarra, O., Spaniol, J.-T., et al. 2022, J. Chem. Phys., 156, 244301 [NASA ADS] [CrossRef] [Google Scholar]
- Coutens, A., Jørgensen, J. K., Van Der Wiel, M. H. D., et al. 2016, A&A, 590, L6 [NASA ADS] [CrossRef] [EDP Sciences] [Google Scholar]
- Coutens, A., Willis, E. R., Garrod, R. T., et al. 2018, A&A, 612, A107 [NASA ADS] [CrossRef] [EDP Sciences] [Google Scholar]
- Coutens, A., Ligterink, N. F. W., Loison, J. C., et al. 2019, A&A, 623, L13 [NASA ADS] [CrossRef] [EDP Sciences] [Google Scholar]
- Coutens, A., Loison, J.-C., Boulanger, A., et al. 2022, A&A, 660, L6 [NASA ADS] [CrossRef] [EDP Sciences] [Google Scholar]
- Dunning, T. H. 1989, J. Chem. Phys., 90, 1007 [Google Scholar]
- Endres, C. P., Schlemmer, S., Schilke, P., Stutzki, J., & Müller, H. S. 2016, J. Mol. Spectrosc., 327, 95 [NASA ADS] [CrossRef] [Google Scholar]
- Enrique-Romero, J., Rimola, A., Ceccarelli, C., & Balucani, N. 2016, MNRAS, 459, L6 [Google Scholar]
- Fayolle, E. C., Öberg, K. I., Jørgensen, J. K., et al. 2017, Nat. Astron., 1, 703 [NASA ADS] [CrossRef] [Google Scholar]
- Förstel, M., Maksyutenko, P., Jones, B. M., et al. 2016, Chem. Commun., 52, 741 [CrossRef] [Google Scholar]
- Fox, W. M., & Smith, P. 1968, J. Chem. Phys., 48, 1868 [NASA ADS] [CrossRef] [Google Scholar]
- Frisch, M. J., Trucks, G. W., Schlegel, H. B., et al. 2016, Gaussian 16 Revision A.01 https://gaussian.com/citation/ [Google Scholar]
- Garrod, R. T., Jin, M., Matis, K. A., et al. 2022, ApJS, 259, 1 [NASA ADS] [CrossRef] [Google Scholar]
- Gorai, P., Bhat, B., Sil, M., et al. 2020, ApJ, 895, 86 [Google Scholar]
- Gordy, W., & Cook, R. L. 1984, Microwave Molecular Spectra, 3rd edn., Techniques of chemistry (New York: Wiley), 18 [Google Scholar]
- Gupta, H., Gottlieb, C. A., Lattanzi, V., Pearson, J. C., & McCarthy, M. C. 2013, ApJ, 778, L1 [Google Scholar]
- Halfen, D. T., Ilyushin, V. V., & Ziurys, L. M. 2015, ApJ, 812, L5 [Google Scholar]
- Hasegawa, T. I., Herbst, E., & Leung, C. M. 1992, ApJS, 82, 167 [Google Scholar]
- Haupa, K. A., Tarczay, G., & Lee, Y.-P. 2019, J. Am. Chem. Soc., 141, 11614 [CrossRef] [Google Scholar]
- Hernández-Gómez, A., Loinard, L., Caux, E., et al. 2018, MNRAS, 483, 2014 [Google Scholar]
- Hubbard, J. S., Voecks, G. E., Hobby, G. L., et al. 1975, J. Mol. Evol., 5, 223 [NASA ADS] [CrossRef] [Google Scholar]
- Jørgensen, J. K., van der Wiel, M. H. D., Coutens, A., et al. 2016, A&A, 595, A117 [Google Scholar]
- Jørgensen, J. K., Müller, H. S. P., Calcutt, H., et al. 2018, A&A, 620, A170 [Google Scholar]
- Jørgensen, J. K., Belloche, A., & Garrod, R. T. 2020, Ann. Rev. Astron. Astrophys., 58, 727 [CrossRef] [Google Scholar]
- Kawaguchi, K., Saito, S., & Hirota, E. 1985, Mol. Phys., 55, 341 [NASA ADS] [CrossRef] [Google Scholar]
- Kisiel, Z. 2001, Assignment and Analysis of Complex Rotational Spectra, eds. J. Demaison, K. Sarka, & E. A. Cohen (Dordrecht: Springer Netherlands), 91 [Google Scholar]
- Kolesniková, L., Belloche, A., Koucký, J., et al. 2022, A&A, 659, A111 [NASA ADS] [CrossRef] [EDP Sciences] [Google Scholar]
- Lee, K. L. K., & McCarthy, M. 2020, J. Phys. Chem. A, 124, 898 [NASA ADS] [CrossRef] [Google Scholar]
- Ligterink, N. F. W., Coutens, A., Kofman, V., et al. 2017, MNRAS, 469, 2219 [Google Scholar]
- Ligterink, N. F. W., Calcutt, H., Coutens, A., et al. 2018a, A&A, 619, A28 [NASA ADS] [CrossRef] [EDP Sciences] [Google Scholar]
- Ligterink, N. F. W., Terwisscha van Scheltinga, J., Taquet, V., et al. 2018b, MNRAS, 480, 3628 [Google Scholar]
- Ligterink, N. F. W., Ahmadi, A., Luitel, B., et al. 2022, ACS Earth Space Chem., 6, 455 [NASA ADS] [CrossRef] [Google Scholar]
- Livingston, R., & Zeldes, H. 1967, J. Chem. Phys., 47, 4173 [NASA ADS] [CrossRef] [Google Scholar]
- López-Sepulcre, A., Jaber, A. A., Mendoza, E., et al. 2015, MNRAS, 449, 2438 [CrossRef] [Google Scholar]
- Lykke, J. M., Coutens, A., Jørgensen, J. K., et al. 2017, A&A, 597, A53 [NASA ADS] [CrossRef] [EDP Sciences] [Google Scholar]
- Manigand, S., Coutens, A., Loison, J. C., et al. 2021, A&A, 645, A53 [NASA ADS] [CrossRef] [EDP Sciences] [Google Scholar]
- Marcelino, N., Agúndez, M., Cernicharo, J., Roueff, E., & Tafalla, M. 2018, A&A, 612, L10 [NASA ADS] [CrossRef] [EDP Sciences] [Google Scholar]
- Marcelino, N., Cernicharo, J., Tercero, B., & Roueff, E. 2009, ApJ, 690, L27 [CrossRef] [Google Scholar]
- Martín-Doménech, R., Rivilla, V. M., Jiménez-Serra, I., et al. 2017, MNRAS, 469, 2230 [Google Scholar]
- Martin-Drumel, M.-A., Spaniol, J.-T., Hölzel, H., et al. 2023, Faraday Discuss., 245, 284 [NASA ADS] [CrossRef] [Google Scholar]
- McKean, D. C., Craig, N. C., & Law, M. M. 2008, J. Phys. Chem. A, 112, 6760 [NASA ADS] [CrossRef] [Google Scholar]
- Milam, S. N., Savage, C., Brewster, M. A., Ziurys, L. M., & Wyckoff, S. 2005, ApJ, 634, 1126 [Google Scholar]
- Miller, J. A., & Melius, C. F. 1992, Int. J. Chem. Kinet., 24, 421 [CrossRef] [Google Scholar]
- Minissale, M., Dulieu, F., Cazaux, S., & Hocuk, S. 2016, A&A, 585, A24 [NASA ADS] [CrossRef] [EDP Sciences] [Google Scholar]
- Molpeceres, G., Zaverkin, V., & Kästner, J. 2020, MNRAS, 499, 1373 [Google Scholar]
- Nagy, B., Csontos, J., Kállay, M., & Tasi, G. 2010, J. Phys. Chem. A, 114, 13213 [NASA ADS] [CrossRef] [Google Scholar]
- Nguyen, M. T., Sengupta, D., Vereecken, L., Peeters, J., & Vanquickenborne, L. G. 1996, J. Phys. Chem., 100, 1615 [CrossRef] [Google Scholar]
- Noble, J. A., Theule, P., Congiu, E., et al. 2015, A&A, 576, A91 [NASA ADS] [CrossRef] [EDP Sciences] [Google Scholar]
- Pettersson, M., Khriachtchev, L., Jolkkonen, S., & Rasanen, M. 1999, J. Phys. Chem. A, 103, 9154 [CrossRef] [Google Scholar]
- Pickett, H. M. 1991, J. Mol. Spectrosc., 148, 371 [Google Scholar]
- Poskrebyshev, G. A. 2015, Kinet. Catal., 56, 245 [CrossRef] [Google Scholar]
- Poskrebyshev, G. A. 2017, Comput. Theor. Chem., 1118, 81 [CrossRef] [Google Scholar]
- Raunier, S., Chiavassa, T., Duvernay, F., et al. 2004, A&A, 416, 165 [NASA ADS] [CrossRef] [EDP Sciences] [Google Scholar]
- Rigden, J. S., & Jackson, R. H. 1966, J. Chem. Phys., 45, 3646 [NASA ADS] [CrossRef] [Google Scholar]
- Rimola, A., Skouteris, D., Balucani, N., et al. 2018, ACS Earth and Space Chemistry, 2, 720 [NASA ADS] [CrossRef] [Google Scholar]
- Rivilla, V. M., Beltrán, M. T., Vasyunin, A., et al. 2019, MNRAS, 483, 806 [NASA ADS] [CrossRef] [Google Scholar]
- Rodríguez-Almeida, L. F., Rivilla, V. M., Jiménez-Serra, I., et al. 2021, A&A, 654, L1 [CrossRef] [EDP Sciences] [Google Scholar]
- Ruaud, M., Wakelam, V., & Hersant, F. 2016, MNRAS, 459, 3756 [Google Scholar]
- Sameera, W. M. C., Senevirathne, B., Andersson, S., Maseras, F., & Nyman, G. 2017, J. Phys. Chem. C, 121, 15223 [CrossRef] [Google Scholar]
- Shapley, W. A., & Bacskay, G. B. 1999, J. Phys. Chem. A, 103, 4505 [NASA ADS] [CrossRef] [Google Scholar]
- Shimonishi, T., Nakatani, N., Furuya, K., & Hama, T. 2018, ApJ, 855, 27 [Google Scholar]
- Slate, E. C. S., Barker, R., Euesden, R. T., Revels, M. R., & Meijer, A. J. H. M. 2020, MNRAS, 497, 5413 [NASA ADS] [CrossRef] [Google Scholar]
- Smith, P., & Wood, P. B. 1966, Can. J. Chem., 44, 3085 [NASA ADS] [CrossRef] [Google Scholar]
- Song, L., & Kästner, J. 2016, Phys. Chem. Chem. Phys., 18, 29278 [NASA ADS] [CrossRef] [Google Scholar]
- Turner, B. E., Terzieva, R., & Eric, H. 1999, ApJ, 518, 699 [NASA ADS] [CrossRef] [Google Scholar]
- Vastel, C., Bottinelli, S., Caux, E., Glorian, J. M., & Boiziot, M. 2015, in SF2A-2015: Proceedings of the Annual meeting of the French Society of Astronomy and Astrophysics, 313 [Google Scholar]
- Wakelam, V., Loison, J. C., Herbst, E., et al. 2015, ApJS, 217, 20 [NASA ADS] [CrossRef] [Google Scholar]
- Wakelam, V., Loison, J. C., Mereau, R., & Ruaud, M. 2017, Mol. Astrophys., 6, 22 [NASA ADS] [CrossRef] [Google Scholar]
- Western, C. M. 2017, J. Quant. Spec. Radiat. Transf., 186, 221 [NASA ADS] [CrossRef] [Google Scholar]
- Woon, D. E., & Dunning, T. H. 1993, J. Chem. Phys., 98, 1358 [NASA ADS] [CrossRef] [Google Scholar]
- Yonezawa, T., Noda, I., & Kawamura, T. 1968, Bull. Chem. Soc. Jpn., 41, 766 [CrossRef] [Google Scholar]
- Yonezawa, T., Noda, I., & Kawamura, T. 1969, Bull. Chem. Soc. Jpn., 42, 650 [CrossRef] [Google Scholar]
- Zeng, S., Rivilla, V. M., Jiménez-Serra, I., et al. 2023, MNRAS, 523, 1448 [NASA ADS] [CrossRef] [Google Scholar]
CASSIS has been developed by IRAP-UPS/CNRS (Vastel et al. 2015), http://cassis.irap.omp.eu
All Tables
Spectroscopic parameters of H2NCO in the S-reduction and relevant fit information.
Fundamental modes of H2NCO calculated in this study (ωB97X-D/cc-pVQZ). Energies are reported in cm−1 and intensities in km mol−1.
Calculated α values (in MHz) for H2NCO in excited vibrational states (ωB97X-D/cc-pVQZ). Predictions of the rotational constants values in υi = 1 can be retrieved using the formula Bi = B0 + αBi.
Rotational, vibrational, and total partition functions for H2NCO (fully resolved hyperfine structure) at various temperatures.
Spectroscopic parameters of FC(O)NH2 in the S-reduction and relevant fit information. 1σ errors are reported within parentheses in the unit of the last digit; they were formatted using the PIFORM software developed by Kisiel (2001).
Calculated spectroscopic parameters (in MHz) of HNCHO cis and trans conformers in the S-reduction.
All Figures
|
Fig. 1 Equilibrium structure of H2NCO calculated at the ωB97X-D/cc-pVQZ level of theory. Geometrical parameters (bond lengths in angstroms and angles in degrees) and principal axes of inertia are reported. The figure was generated using the PMIFST software from the PROSPE collection of programs developed by Kisiel (2001). 1 and 2 refer to the H1 and H2 labelling used in the text. |
| In the text | |
|
Fig. 2 Predicted pure rotational spectrum of H2NCO (in the ground vibrational state, υ = 0) up to 1.5 THz at 30 K (top) and 300 K (bottom). The spectral regions investigated in this study using the CP and Zeeman-modulated spectrometers are highlighted in orange and purple, respectively. |
| In the text | |
|
Fig. 3 CP-FTMMW spectrum after data treatment, allowing the identification of transitions from radical species (top trace) and comparison with predictions for H2NCO (υ = 0, 300 K) from the quantum chemical calculations performed in this study. The discontinuity in the experimental trace corresponds to a very noisy region that has not been plotted for the sake of clarity. |
| In the text | |
|
Fig. 4 Overview of the N′ − N″ = 18–17 a-type transition of H2NCO observed experimentally and comparison with a 300 K simulation obtained using the final spectroscopic constants (Table 1). The lowest Ka values are reported for both asymmetric components in the upper panel (in blue and purple). The lower panel corresponds to a zoom into the Ka = 3–12 region highlighted in light purple in the upper panel. The area highlighted in orange displays a partially resolved hyperfine structure (Ka = 3). The simulation was obtained using a Gaussian profile with a full width at half maximum of 1.3 MHz; the second derivative of the PGOPHER trace is plotted for visual comparison with the experimental spectrum. |
| In the text | |
|
Fig. 5
|
| In the text | |
|
Fig. 6 Undetected transitions of H2NCO that were used to determine the column density upper limits. The ALMA observed spectrum of IRAS 16293 B is in black. The LTE model for Tex = 300 K is in red, while the one for Tex = 125 K is in blue. The dotted cyan line corresponds to the 3 rms level per 1 km s−1, 1 km s−1 being the typical line width at this position. |
| In the text | |
|
Fig. 7 Time evolution of the temperature and the abundances (with respect to molecular hydrogen) in the gas phase (solid lines) and on the grain surface (dashed) of HNCO, H2NCO, NH2CHO NCO, and CH3NCO species during the cold-core phase and the collapse phase. The time axis is reversed to better visualise the evolution of the abundances. The observed gas-phase abundances are indicated in blue. Detections in IRAS 16293 B are from Coutens et al. (2016); Hernández-Gómez et al. (2018);? for HNCO and from Coutens et al. (2016); Jørgensen et al. (2020); ? for NH2CHO. Detections in dense molecular clouds are from ? Marcelino et al. (2009) and Turner et al. (1999). The upper limits for the relative abundance of the gas phase H2NCO and NCO in IRAS 16293 B are shown in red. The observed abundances for IRAS 16293 B are calculated from the observed column densities using an H2 column density equal to 1.5 × 1023 cm−2 so that the chemical model reproduces the observed abundance of CH3OH (this is equivalent to using abundances relative to CH3OH). |
| In the text | |
|
Fig. B.1 Comparison of the different CP spectra after data treatment allowed us to identify transitions from radical species (formamide:F2/He pressure ratios of 1:0.5, 1:1, 1:2, and 1:3, from top to bottom). The shaded areas correspond to ±200 MHz windows around the spectral predictions from the NCO and H2NCO radicals (in light blue and orange, respectively). For NCO, predictions are from the CDMS database (Endres et al. 2016) based on the experimental work by Kawaguchi et al. (1985). For H2NCO, calculated values are from this work and the relative intensity is proportional to the expected line intensity at 300 K, in arbitrary units. Discontinuities in the experimental spectra correspond to very noisy regions that have not been plotted for the sake of clarity. |
| In the text | |
|
Fig. B.2 Experimental CP spectrum in the 107 GHz region where the |
| In the text | |
|
Fig. C.1 Evolution of the structure of the |
| In the text | |
|
Fig. D.1 Experimental spectra of the |
| In the text | |
|
Fig. D.2 Experimental spectra recorded around the |
| In the text | |
|
Fig. E.1 Experimental spectrum recorded around the N′ − N″ = 17 − 16 a-type transition of H2NCO using Zeeman modulation spectroscopy (upper trace), and comparison with PGOPHER simulations for υ = 0 and the three lowest vibrationally excited states at 300 K. The simulation in υ = 0 was obtained using the final set of spectroscopic parameters (see Table 1). Those in the excited states were obtained using the harmonic vibrational energies, the predicted rotational constants in these states (calculated using the α values in Table A.2), and the other spectroscopic parameters from υ = 0. For all simulations, a Gaussian profile with a full width at half maximum of 1.3 MHz has been used. Shaded areas in the upper trace highlight regions where the observed transitions likely arise from vibrational satellites. |
| In the text | |
|
Fig. G.1 CP experimental spectrum after processing allowed the removal of contributions from known close-shell species (upper trace), and comparison with a PGOPHER simulation for FC(O)NH2 in υ = 0. The simulation was obtained using the final set of spectroscopic parameters (see Table G.1), a temperature of 300 K, and a Gaussian profile with a full width at half maximum of 0.6 MHz. The shaded area in light purple in the upper panel is zoomed in on in the bottom left panel; that in orange is zoomed in on in the lower right panel. Discontinuities in the processed experimental spectrum correspond to regions where lines of other molecules were lying. |
| In the text | |
|
Fig. H.1 Equilibrium structure of cis and trans HNCHO calculated at the ωB97X-D/cc-pVQZ level of theory. Geometrical parameters (bond lengths in angstroms and angles in degrees) and principal axes of inertia are reported. The figure was generated using the PMIFST software from the PROSPE collection of programs developed by Kisiel (2001). |
| In the text | |
Current usage metrics show cumulative count of Article Views (full-text article views including HTML views, PDF and ePub downloads, according to the available data) and Abstracts Views on Vision4Press platform.
Data correspond to usage on the plateform after 2015. The current usage metrics is available 48-96 hours after online publication and is updated daily on week days.
Initial download of the metrics may take a while.